| Lowest avg. residential electricity rate | ~8–9¢/kWh (Louisiana) (U.S. Energy Information Administration, 2023) |
| Highest avg. residential electricity rate | ~30–32¢/kWh (Hawaii) (U.S. Energy Information Administration, 2023) |
| National average residential rate | ~15.9¢/kWh (U.S. Energy Information Administration, 2023 annual average) |
| Typical EV monthly home charging consumption | 250–350 kWh (approx. 1,000 miles) (Based on 3–4 miles/kWh average EV efficiency) |
| Estimated monthly home charging cost (national avg.) | $40–$56/month (At 15.9¢/kWh and 250–350 kWh/month) |
| Public DC fast charging rate range | 28–48¢/kWh (Electrify America, EVgo, ChargePoint published rates, 2024) |
| States with lowest EV charging costs | Louisiana, Oklahoma, Wyoming, Idaho, Arkansas (EIA 2023 residential rate data) |
| States with highest EV charging costs | Hawaii, California, Connecticut, Massachusetts, New York (EIA 2023 residential rate data) |
Why Your State Determines More of Your EV Fuel Bill Than Your Car Does
Most EV buyers focus on the vehicle's rated range and efficiency. Fewer stop to ask the question that actually determines their monthly charging bill: what does electricity cost where I live? The answer varies more than most people expect — and it matters more than nearly any other variable.
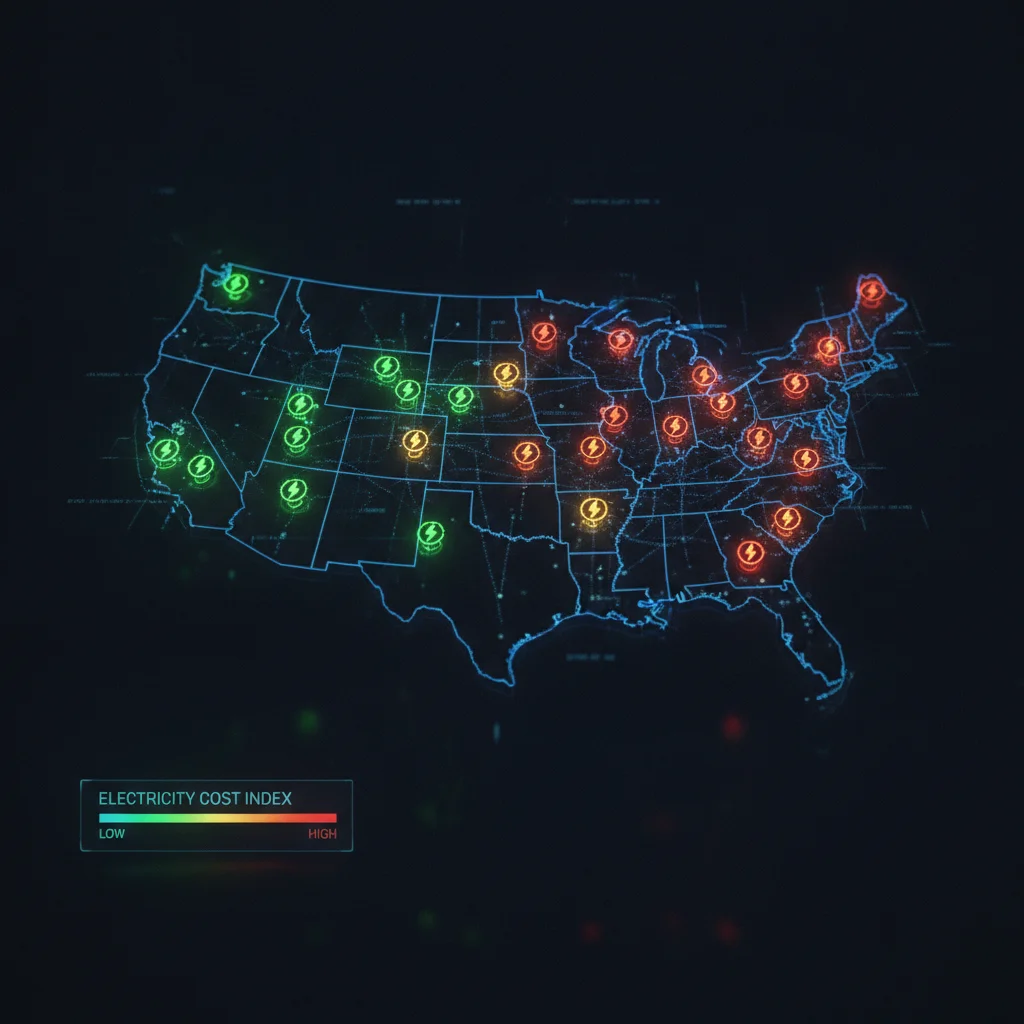
The U.S. Energy Information Administration (EIA) tracks residential electricity prices across all 50 states. As of the most recent full-year data, average retail electricity prices range from under 10 cents per kilowatt-hour (kWh) in Louisiana to more than 30 cents per kWh in Hawaii. That's a 3x swing. Applied to an EV that consumes 300 kWh per month — a reasonable estimate for someone driving roughly 1,000 miles — that translates to a charging bill anywhere from $30 to $90 or more, just based on geography.
This article breaks down those costs by state, explains why prices differ so dramatically, and gives you a framework for estimating your real-world monthly charging expense. If you want to go deeper on the math, see how the full EV charging cost formula works before coming back here for the state-level data.
| Lowest avg. residential electricity rate | ~8–9¢/kWh (Louisiana) (U.S. Energy Information Administration, 2023) |
| Highest avg. residential electricity rate | ~30–32¢/kWh (Hawaii) (U.S. Energy Information Administration, 2023) |
| National average residential rate | ~15.9¢/kWh (U.S. Energy Information Administration, 2023 annual average) |
| Typical EV monthly home charging consumption | 250–350 kWh (approx. 1,000 miles) (Based on 3–4 miles/kWh average EV efficiency) |
| Estimated monthly home charging cost (national avg.) | $40–$56/month (At 15.9¢/kWh and 250–350 kWh/month) |
| Public DC fast charging rate range | 28–48¢/kWh (Electrify America, EVgo, ChargePoint published rates, 2024) |
| States with lowest EV charging costs | Louisiana, Oklahoma, Wyoming, Idaho, Arkansas (EIA 2023 residential rate data) |
| States with highest EV charging costs | Hawaii, California, Connecticut, Massachusetts, New York (EIA 2023 residential rate data) |
State-by-State Electricity Rates: The Full Spectrum
The table below organizes states by their average residential electricity rate tier. Rates used are based on EIA 2023 annual average residential figures. Keep in mind that most EV owners charge at home on residential rates — not commercial or industrial rates — so these figures are the most directly applicable.
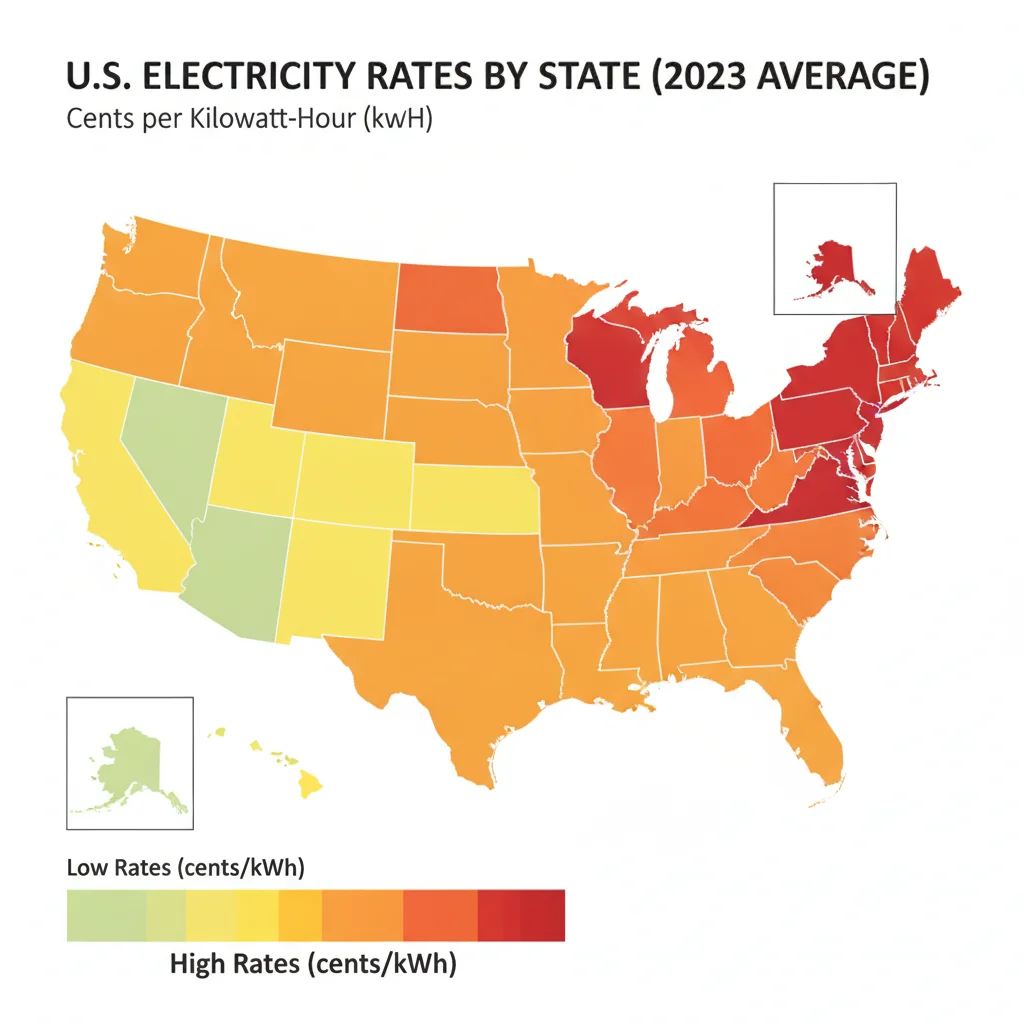
| Rate Tier | States | Avg. Rate (cents/kWh) | Est. Monthly Cost (300 kWh) |
|---|---|---|---|
| Very Low (under 10¢) | Louisiana, Oklahoma, Arkansas, North Dakota, Wyoming, Idaho | 8–10¢ | $24–$30 |
| Low (10–12¢) | Utah, Nebraska, Kansas, Kentucky, Tennessee, West Virginia, Montana, Mississippi | 10–12¢ | $30–$36 |
| Moderate (12–15¢) | Texas, Colorado, Missouri, Iowa, Indiana, Ohio, South Carolina, Alabama, Georgia, Florida, Wisconsin, Minnesota, Nevada, Oregon | 12–15¢ | $36–$45 |
| High (15–20¢) | Arizona, New Mexico, Virginia, North Carolina, Delaware, Maryland, Michigan, Illinois, Pennsylvania, Washington, Maine, Vermont | 15–20¢ | $45–$60 |
| Very High (20¢+) | New York, New Jersey, Connecticut, Massachusetts, Rhode Island, Alaska, California, Hawaii | 20–32¢ | $60–$96+ |
A few important notes on reading this table: first, state averages mask significant within-state variation. In California, for example, Pacific Gas & Electric (PG&E) customers in some rate tiers pay over 40 cents per kWh at peak hours, while Southern California Edison customers on time-of-use (TOU) plans can charge overnight for as little as 12–15 cents. Second, several states have specific EV-friendly utility rate programs that can meaningfully reduce your cost. State and utility incentives can further reduce what you pay — sometimes dramatically.
Washington state stands out as an interesting case: despite appearing in the high-rate tier on paper, the state has abundant hydroelectric power and many utilities offer very low off-peak EV rates. Drivers who participate in TOU programs there frequently pay well below the state average for overnight charging.
What Drives the Price Differences Between States
Electricity prices aren't arbitrary. They reflect the fuel mix, infrastructure age, regulatory environment, and geography of each state's power grid. Understanding why your state's rates are what they are helps you predict whether they'll change — and how you might work around them.
Generation Fuel Mix
States that rely heavily on hydroelectric power — Washington, Oregon, Idaho — tend to have the lowest residential electricity costs. The fuel is free; you're paying for infrastructure and distribution only. States reliant on natural gas or oil for generation (Hawaii is an extreme example) pay more because fuel costs fluctuate and are passed to ratepayers.
Regulatory Environment
Some states have deregulated electricity markets where consumers can shop among competing suppliers — Texas (ERCOT) and parts of the Northeast being notable examples. Competition can push prices down, but it also introduces complexity. Texas saw extremely low average rates for years before high-demand events caused volatility. Regulated states, by contrast, have more predictable pricing but potentially less room for consumers to seek better deals.
Transmission and Distribution Costs
Rural states with long distances between generation and end users pay more for the wires that carry the power. Hawaii's isolation makes it the most extreme case: nearly all power must be generated locally, often from imported oil. Alaska faces similar constraints in remote areas.
Grid Age and Infrastructure Investment
Older grid infrastructure requires ongoing capital investment that utilities recover through rates. Many Northeastern states have aging infrastructure and high population density that creates grid management complexity — contributing to their higher rates.
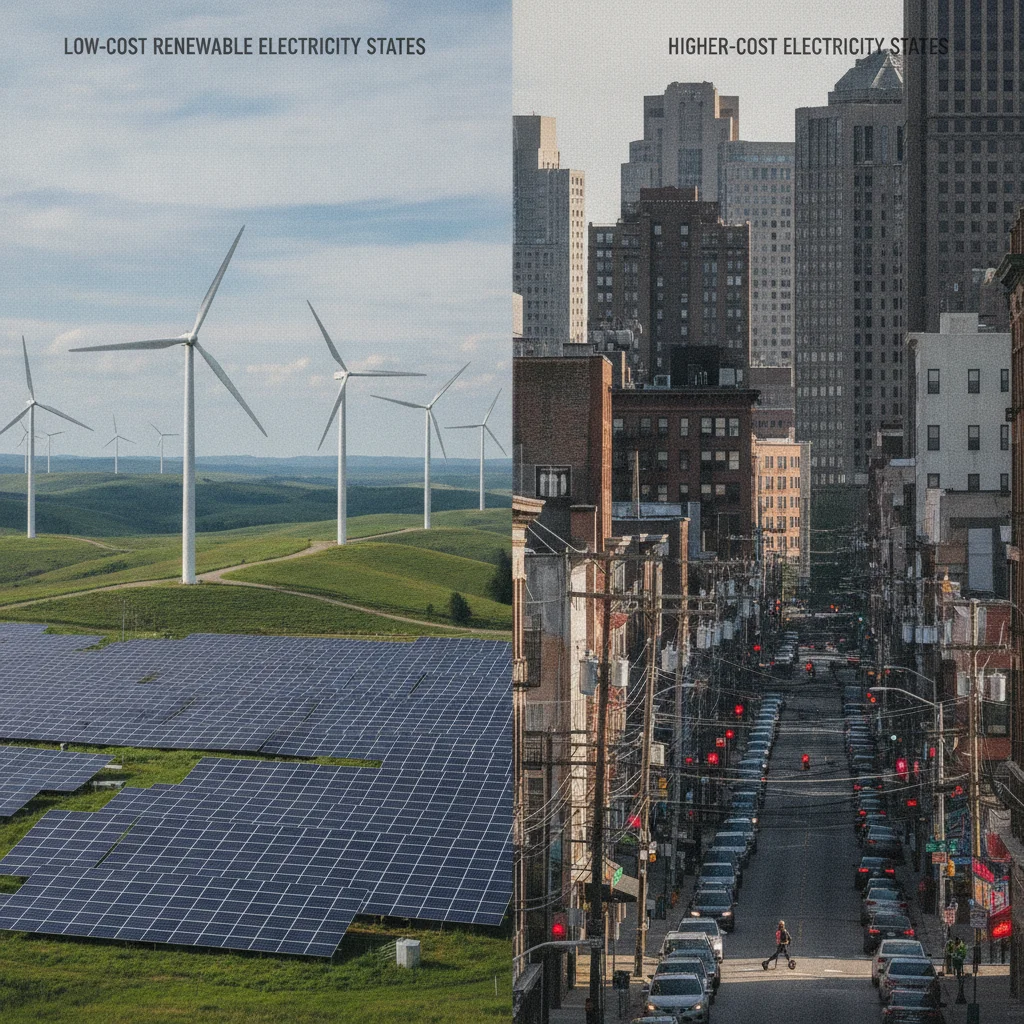
The practical implication for EV owners is this: your location's electricity cost is largely outside your control. What is within your control is when you charge. Time-of-use rates can be 30–50% cheaper than peak daytime rates in many markets. Understanding how rate structures affect your total charging cost is one of the most actionable things an EV owner can do to reduce their bill.
3x
Spread in residential electricity rates from cheapest to most expensive U.S. states
EIA 2023 data shows Louisiana at roughly 9¢/kWh and Hawaii at approximately 30¢/kWh.
$363/yr
Additional annual charging cost in a high-rate vs. moderate-rate state
Based on 1,200 miles/month, 3.5 miles/kWh efficiency, comparing 13¢ (Georgia) vs. 22¢ (Massachusetts) per kWh.
~$385/yr
Annual home charging cost for a typical EV in Louisiana
At 9¢/kWh, driving 15,000 miles/year in a vehicle averaging 3.5 miles/kWh.
30–50%
Potential savings from switching to an off-peak EV charging rate
Many utilities offer time-of-use plans where overnight charging costs significantly less than peak daytime rates.
1–2%/yr
Projected annual increase in average U.S. residential electricity rates
U.S. Energy Information Administration long-term outlook; well below historic gasoline price volatility.
Calculating Your Real Monthly Charging Cost
The standard formula for estimating home charging costs is straightforward:
Monthly Cost = (Miles Driven ÷ Vehicle Efficiency in miles/kWh) × Electricity Rate
For example, a driver in Georgia (average 13¢/kWh) who drives 1,200 miles per month in a vehicle with 3.5 miles/kWh efficiency would calculate: (1,200 ÷ 3.5) × $0.13 = approximately $44.57 per month.
The same driver in Massachusetts (average 22¢/kWh) would pay: (1,200 ÷ 3.5) × $0.22 = approximately $75.43 per month — a $30 monthly difference, or $363 per year, simply due to geography.
Scale that over five years of ownership: $1,815 in additional fuel costs purely from state electricity rates. That's meaningful money — enough to affect a vehicle purchase decision if you're comparing two models or considering whether to lease versus buy.
If you're planning a purchase and want to project your actual numbers, estimate your monthly EV charging bill before you buy using your specific driving habits and local rate.
Apartment Dwellers: The Public Charging Premium
Home charging is the baseline, but it isn't available to everyone. Apartment dwellers, renters without outlet access, and some condo residents must rely more heavily on public charging networks — which charge a significant premium over residential rates. DC fast chargers from networks like Electrify America and EVgo typically charge between 28–48 cents per kWh (or per-minute in some cases), regardless of your state's residential rate. This effectively negates the electricity cost advantage of living in a low-rate state. Apartment dwellers face a different EV cost reality that's worth understanding before purchasing.
kWh (kilowatt-hour)
The standard unit used to measure electricity consumption and to price electric vehicle charging. One kWh can power an average EV roughly 3–4 miles, depending on the vehicle's efficiency.
Residential electricity rate
The price per kilowatt-hour that a household pays to its utility for electricity used at home. This is the most relevant rate for EV owners who charge their vehicles overnight at home.
Time-of-Use (TOU) rate
A utility pricing structure that charges different rates depending on the time of day electricity is used. Off-peak hours — typically late night and early morning — carry lower rates, making overnight EV charging significantly cheaper in many markets.
EV efficiency (miles per kWh)
A measure of how far an electric vehicle travels per kilowatt-hour of electricity consumed. Higher efficiency means lower charging costs for the same number of miles driven.
DC Fast Charging
A high-power public charging method that can add significant range in 20–45 minutes. DC fast chargers are priced well above residential rates, typically 28–48 cents per kWh or on a per-minute basis.
Deregulated electricity market
A state energy market where consumers can choose their electricity supplier from competing providers, rather than being served by a single regulated utility. Texas is the most prominent example in the U.S.
Regional Highlights and Key Takeaways
Rather than reviewing all 50 states individually, the most useful approach is to highlight the regions where charging costs most dramatically affect the EV value proposition — for better and for worse.
Best-Value States for EV Charging
Louisiana, Oklahoma, Wyoming, Idaho: These states consistently post the nation's lowest residential electricity rates. An EV owner in Louisiana paying 9 cents per kWh and driving 15,000 miles per year in a 3.5 miles/kWh vehicle pays roughly $385 per year to charge — less than what many ICE vehicle owners spend on oil changes alone. The EV fuel cost advantage over gasoline is most dramatic here.
Moderate-Cost States: The Majority of EV Owners
Texas, Colorado, Florida, Georgia, Oregon, Nevada: These populous states land in the 12–15 cent range where EV charging is meaningfully cheaper than gasoline but the savings are not as dramatic. TOU rates and home charging optimization can push real-world costs further down. Texas deserves special mention: its deregulated market means some providers specifically offer EV-friendly plans with very low overnight rates — and Tesla owners in particular have historically received free overnight charging through certain providers.
High-Cost States: Where EV Math Gets More Complicated
California, New York, Massachusetts, Connecticut, Hawaii: These states combine high electricity rates with high gasoline prices — which means EVs still often pencil out favorably versus gasoline, but the fuel cost savings are compressed. A California PG&E customer on a standard tiered rate pays enough per kWh that a fuel-efficient hybrid might approach EV operating costs. The solution for most California EV owners is enrolling in the utility's EV rate or TOU plan, which can cut overnight charging costs substantially.
For a complete look at how public infrastructure availability intersects with these cost figures by region, see which states have charging coverage gaps that could affect your practical cost of ownership.
The Trajectory: Rates Are Not Static
One final point that often goes undiscussed: electricity rates, unlike gasoline, tend to rise slowly and predictably over time. The EIA projects average residential rates will increase roughly 1–2% annually over the next decade — far slower than the historic volatility of gasoline prices. That predictability has real value for household budgeting, even in high-rate states. And the ongoing build-out of renewable generation in states like Texas, Colorado, and the Southwest may put downward pressure on rates in some markets over time. The NEVI program's infrastructure investment is also expected to influence public charging pricing as competition among networks increases.
EIA State Electricity Profiles
The U.S. Energy Information Administration publishes detailed electricity price data for every state, updated monthly. Use it to find your state's current residential rate and track trends over time.
EV Charging Cost Calculator Guide
<a href="/electric-vehicles/charging-infrastructure/charging-costs-savings/ev-charging-cost-calculator-understanding-the-inputs-that-matter">Learn which variables determine your actual monthly EV charging bill</a> — from kWh rate to battery size to driving efficiency.
Home Charging Setup Guide
<a href="/electric-vehicles/charging-infrastructure/home-charging-setup">Setting up home charging correctly</a> is the foundation of low-cost EV ownership. This hub covers equipment selection, installation, and rate plan optimization.
Public Charging Networks Hub
<a href="/electric-vehicles/charging-infrastructure/public-charging-networks">Compare DC fast-charging networks</a> across the U.S., including pricing structures, coverage maps, and membership plans that can reduce per-session costs.
Federal and State EV Incentives Guide
Tax credits, utility rebates, and state-level programs can offset home charger installation costs and reduce your effective electricity rate. <a href="/electric-vehicles/charging-infrastructure/charging-costs-savings/federal-and-state-incentives-that-reduce-ev-charging-costs">See what's available in your state</a>.
Everything That Affects EV Charging Costs
<a href="/electric-vehicles/charging-infrastructure/charging-costs-savings/everything-that-affects-the-cost-of-charging-an-ev-an-end-to-end-guide">A comprehensive end-to-end look</a> at every factor that determines what you pay to charge an electric vehicle — from hardware to habits to utility rate plans.
All claims are backed by peer-reviewed research. Sources on request.