| Best overall selling season | Spring (March–May) (Consistent across NADA and CarGurus market data) |
| Worst overall selling season | Winter (December–February) (Wholesale auction price trends, multiple years) |
| Convertible peak window | March–May |
| Pickup truck peak window | May–August |
| AWD/4WD SUV peak window | October–December |
| Typical seasonal price swing | 5%–15% above or below off-peak value (Range varies by vehicle type and region) |
| Valuation tool data lag | 4–8 weeks behind live market (Reflects wholesale auction feed cadence) |
| Tax refund buyer surge | February–March (IRS average refund delivery window) |
| Private sale vs. trade-in seasonal premium | 5–12% (private) vs. 2–4% (dealer) (Directional estimate based on auction and retail spread data) |
Why Timing Your Sale Matters More Than Most Sellers Think
Most sellers fixate on mileage and condition when pricing a used car. Those matter — but they ignore a third variable that can move your resale price by 5% to 15% without you changing a thing about the vehicle: the calendar.
Used car demand is not flat across the year. Buyers shop differently in February than they do in May. Tax refund season floods the market with buyers. Summer heat sells trucks. Winter kills convertible values. These patterns repeat reliably enough that sellers who understand them can pocket an extra $1,000 to $3,000 just by choosing the right 60-day window to list.
This article is a reference guide to those patterns — broken down by vehicle type, season, and the underlying depreciation mechanics that explain why timing works the way it does. For a broader strategic overview, see the complete market timing guide for car sellers.
| Best overall selling season | Spring (March–May) (Consistent across NADA and CarGurus market data) |
| Worst overall selling season | Winter (December–February) (Wholesale auction price trends, multiple years) |
| Convertible peak window | March–May |
| Pickup truck peak window | May–August |
| AWD/4WD SUV peak window | October–December |
| Typical seasonal price swing | 5%–15% above or below off-peak value (Range varies by vehicle type and region) |
| Valuation tool data lag | 4–8 weeks behind live market (Reflects wholesale auction feed cadence) |
| Tax refund buyer surge | February–March (IRS average refund delivery window) |
| Private sale vs. trade-in seasonal premium | 5–12% (private) vs. 2–4% (dealer) (Directional estimate based on auction and retail spread data) |
Seasonal Demand by Vehicle Type: A Reference Chart
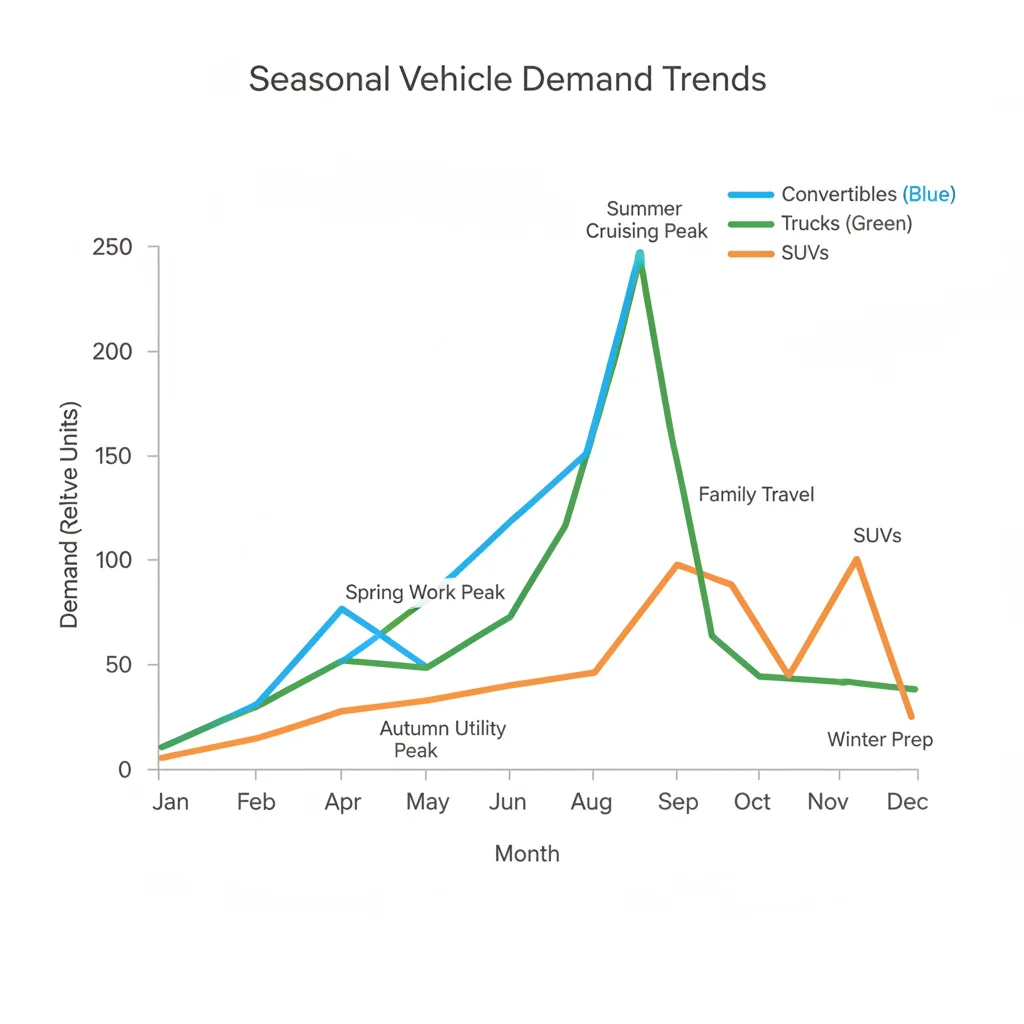
Not every car peaks at the same time. The table below maps common vehicle categories to their strongest and weakest demand windows. Use it as a quick lookup when planning your listing date.
| Vehicle Type | Peak Demand Window | Soft Demand Window | Typical Price Premium at Peak |
|---|---|---|---|
| Convertibles / Roadsters | March – May | November – January | +8% to +14% |
| Pickup Trucks (full-size) | May – August | December – February | +6% to +12% |
| 4WD / AWD SUVs | October – December | June – August | +4% to +9% |
| Fuel-Efficient Sedans / Hybrids | March – June (gas price spikes) | October – January | +5% to +10% (correlated with gas prices) |
| Sports Cars (non-convertible) | April – July | November – February | +5% to +8% |
| Minivans | February – April (tax season) | September – November | +3% to +6% |
| Electric Vehicles | March – June; September – November | December – February | +3% to +7% (highly model-dependent) |
These ranges are directional, not guaranteed. Local market conditions, model scarcity, and economic cycles layer on top of seasonal patterns. But across multiple years of wholesale and retail auction data, the seasonal peaks above hold with enough consistency to be actionable.
For a deeper look at how convertibles, trucks, and SUVs diverge, the article timing your sale to match your vehicle type walks through each category in detail.
Structural depreciation
The long-term, unavoidable decline in a vehicle's value caused by age, mileage accumulation, and wear. It follows a predictable curve regardless of market conditions and cannot be reversed by timing.
Seasonal depreciation
A temporary, demand-driven dip in a vehicle's market value tied to the time of year. Unlike structural depreciation, it reverses when buyer demand returns — making timing a real lever for sellers.
Wholesale auction price
The price dealers pay for vehicles at closed wholesale auctions such as Manheim or ADESA. These prices feed valuation tools like KBB and typically lag real-world retail demand by 4–8 weeks.
Peak demand window
The calendar period when buyer interest and competition for a specific vehicle type is highest, typically resulting in faster sales and stronger offers for sellers.
Private-party value
The price a vehicle commands when sold directly from one individual to another, without a dealer intermediary. Private-party values tend to be higher than trade-in values, especially during peak demand windows.
Tax refund season
The February–April period when the IRS issues the majority of income tax refunds, injecting lump-sum cash into the used car buyer market and spiking demand for vehicles priced between $8,000 and $20,000.
Model year cycle
The annual rhythm of new vehicle introductions, typically running August through October for most brands. New model arrivals can suppress demand for outgoing-year used vehicles and influence dealer trade-in offers.
The Mechanics of Seasonal Depreciation
Depreciation is usually described as a straight-line or exponential decline in value over time. Reality is messier. Value dips and recovers with demand, and demand follows the calendar. Understanding the two types of depreciation — structural and seasonal — helps sellers know which lever they can actually control.
Structural Depreciation
Structural depreciation is the long-term loss of value tied to age, mileage, and wear. A 3-year-old vehicle with 36,000 miles has lost roughly 40%–50% of its original MSRP regardless of when you sell it. You cannot reverse this by waiting for spring. The optimal window to sell before depreciation accelerates article covers the age-and-mileage thresholds where structural depreciation kicks into high gear.
Seasonal Depreciation
Seasonal depreciation is the temporary, demand-driven fluctuation layered on top of the structural curve. It is reversible — but only if you sell at the right moment. A convertible worth $22,000 in April might realistically fetch only $19,500 in December. The car hasn't aged meaningfully in eight months. The market's appetite for it has simply changed.
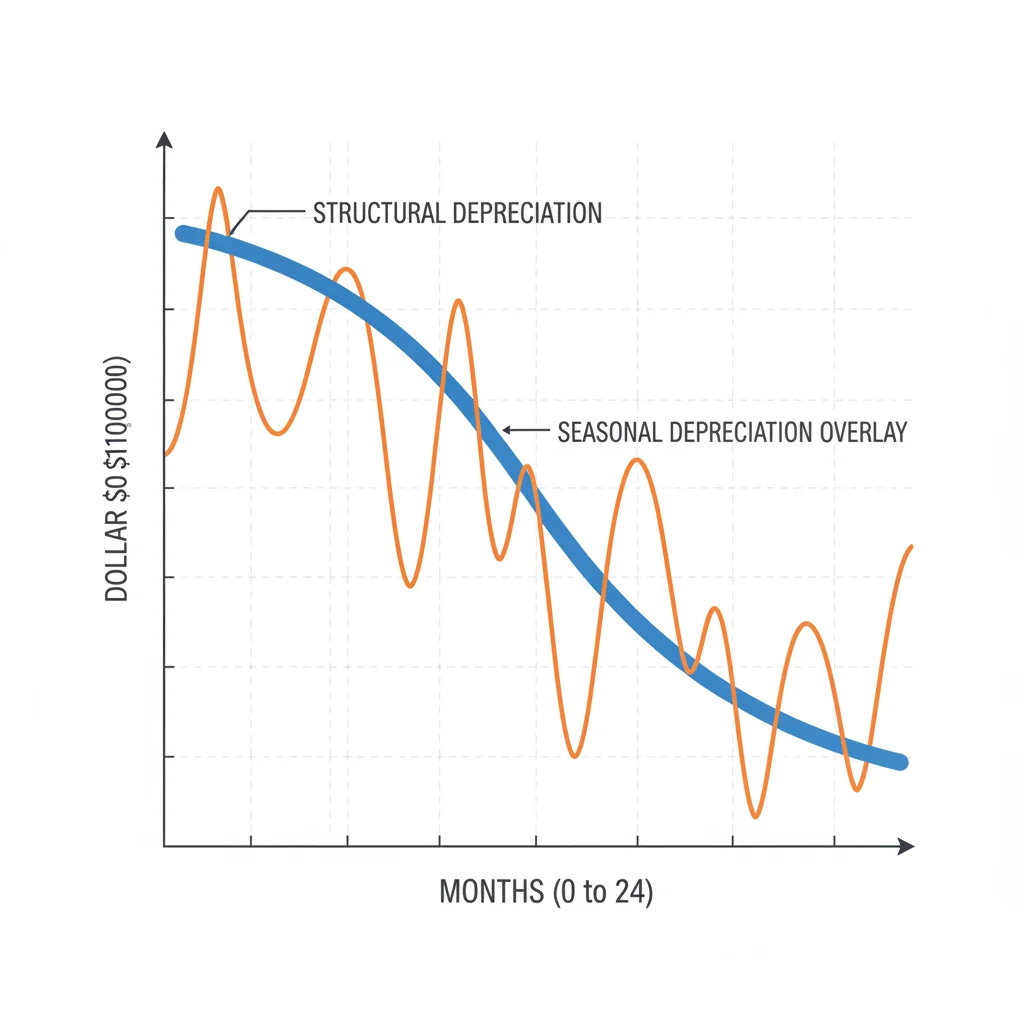
The key insight: you cannot fight structural depreciation, but you can ride seasonal peaks. The practical strategy is to sell before the structural curve drops significantly and during the seasonal peak for your vehicle type. These two windows do not always align, which is why sellers sometimes have to choose between waiting for peak season and selling now before another 5,000 miles erode the value further.
When Seasonal and Structural Timing Conflict
If your vehicle is approaching a high-depreciation threshold — such as 60,000 miles or 5 years of age — waiting for peak season may cost you more than you gain. For example, adding 4,000 miles while waiting three months for spring could reduce structural value by $800–$1,200, partially or fully offsetting the seasonal premium. Run the numbers before deciding to hold.
Live Listings vs. Valuation Tools: Use Both
KBB and Edmunds give you a baseline, but they lag real-time demand. Before pricing your car, search CarGurus or AutoTrader for identical or near-identical listings in your zip code. If active listings cluster 8%–12% above your KBB estimate during peak season, that premium is real buyer behavior — not an outlier. Price into it, but not above it.
For a detailed look at how depreciation curves vary by vehicle class — sedans vs. trucks vs. EVs — see the companion article on depreciation curves by vehicle type.
Season-by-Season Seller's Playbook
Spring (March – May): The Broadest Selling Window
Spring is the most favorable season for the widest range of vehicles. Tax refund checks arrive in February and March, putting cash in buyers' hands. Convertibles and sports cars wake up as temperatures rise. Families shopping before summer road trips drive minivan and mid-size SUV demand. Listing in late March through April typically hits both the tax-refund buyer pool and the warm-weather enthusiast pool simultaneously.
Best vehicles to sell in spring: convertibles, sports cars, fuel-efficient sedans (especially if gas prices are rising), minivans.
For a direct comparison of spring vs. winter outcomes, the article selling in spring vs. selling in winter breaks down the data season by season.
Summer (June – August): Truck and Outdoor-Recreation Season
Full-size pickup trucks reach their annual value peak between May and August. Contractors budget for new work trucks at the start of the season. Buyers planning camping, towing, or outdoor projects pull the trigger in June and July. A well-maintained F-150 or Silverado listed in late May or early June will face the highest buyer competition of the year.
Best vehicles to sell in summer: full-size pickups, mid-size trucks, overlanding-equipped 4x4 SUVs.
The article why pickup values peak in summer explains the contractor and recreation buyer cycles driving this window.
Fall (September – November): AWD and 4WD Season Begins
As temperatures drop, AWD and 4WD-equipped vehicles become more attractive to buyers in northern and mountain markets. Buyers in the Snow Belt start thinking about winter tires and capable vehicles in September — often two to three months before the first serious snow. Listing an AWD crossover or 4WD truck in October positions you squarely in front of that buyer mindset.
Best vehicles to sell in fall: AWD crossovers, 4WD trucks, all-season or off-road-equipped SUVs.
Up to 14%
Convertible price premium in spring vs. winter
Consistent with seasonal retail and auction pricing patterns observed across multiple used car market analyses.
+$1,000–$3,000
Estimated seller gain from optimal seasonal timing
Approximate range for a $20,000–$30,000 vehicle sold during peak vs. off-peak demand window.
4–8 weeks
Lag between live market and valuation tool updates
Reflects wholesale auction data feed cadences used by major tools including Kelley Blue Book and Edmunds.
January
Lowest used car demand month of the year
Supported by multi-year NADA and CarGurus seasonal listing and sale-rate data.
May–August
Peak window for full-size pickup truck values
Driven by contractor purchasing cycles and outdoor recreation buyer demand each year.
Winter (December – February): The Seller's Weak Season — With Exceptions
January is statistically the worst month to list most vehicles. Buyer activity falls, dealers tighten trade-in offers, and auction prices soften. The exceptions are 4WD trucks and SUVs in snowy regions, which can actually see demand stay elevated through December. For everything else — especially convertibles and sports cars — winter listings almost always result in lower offers or longer time on market.
Best vehicles to sell in winter: 4WD pickups and heavy-duty trucks in snow-belt markets. Nearly everything else should wait.
If you're stuck selling in winter, the market timing guide covers strategies to minimize the seasonal discount.
How Valuation Tools Reflect (and Lag) Seasonal Demand
Kelley Blue Book, Edmunds, and similar tools update their values periodically — but not in real time. Wholesale auction data typically feeds into these models with a 4–8 week lag. That means the value KBB shows you in January already reflects December's soft market. By mid-March, it starts reflecting February's stronger demand. Understanding this lag helps you interpret valuations more accurately.
Practical implication: If you're selling a convertible and KBB shows $21,000 in February, the real private-party value in April may be $22,500–$23,500 once seasonal demand catches up. Don't anchor your price to an off-peak estimate if you plan to sell at peak.
The article how seasonal demand inflates or deflates valuation tool estimates explains exactly how tools like KBB adjust — and where they fall short.
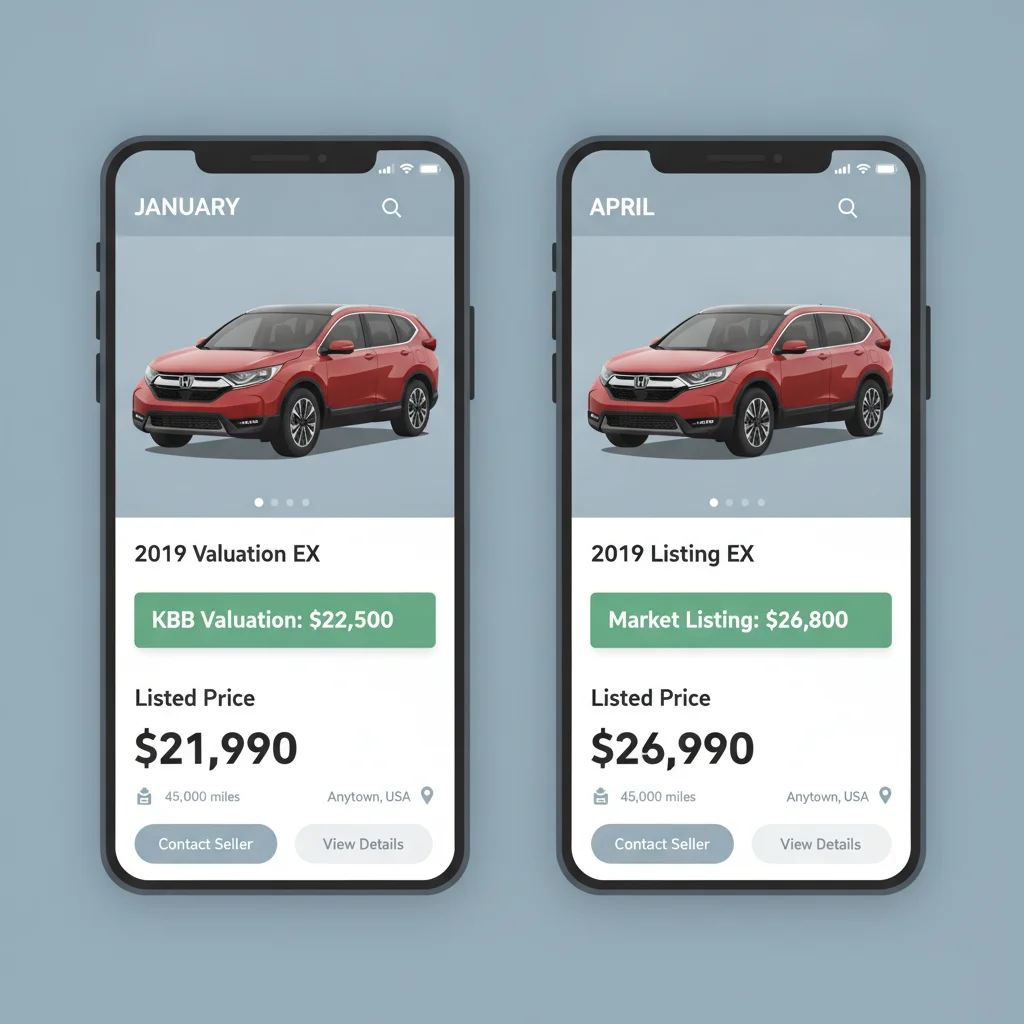
One practical workaround: check live listings on CarGurus or AutoTrader for your specific make, model, trim, and mileage. Active listing prices reflect real-time buyer competition better than any algorithmic valuation tool. If comparable vehicles are listing for 8%–10% above KBB in your area during peak season, that spread is real — and worth capturing.
When Seasonal and Structural Timing Conflict
If your vehicle is approaching a high-depreciation threshold — such as 60,000 miles or 5 years of age — waiting for peak season may cost you more than you gain. For example, adding 4,000 miles while waiting three months for spring could reduce structural value by $800–$1,200, partially or fully offsetting the seasonal premium. Run the numbers before deciding to hold.
Live Listings vs. Valuation Tools: Use Both
KBB and Edmunds give you a baseline, but they lag real-time demand. Before pricing your car, search CarGurus or AutoTrader for identical or near-identical listings in your zip code. If active listings cluster 8%–12% above your KBB estimate during peak season, that premium is real buyer behavior — not an outlier. Price into it, but not above it.
Trade-In vs. Private Sale: Does Season Affect Both Equally?
Seasonal demand affects private-party and dealer trade-in prices differently. Private buyers are often more emotionally responsive to season — a buyer who just decided they want a convertible for summer is willing to pay a premium. Dealers, by contrast, operate on wholesale auction expectations and don't fully pass through seasonal premiums to sellers.
That said, dealers do adjust trade-in offers based on their current lot needs. If a dealership is short on trucks heading into summer, they may offer more for your pickup than the same dealer would in January. The difference is smaller than the private-party premium — typically 2%–4% vs. 5%–12% — but it exists.
Bottom line: If maximizing seasonal upside is the goal, private-party sales outperform dealer trade-ins. If convenience matters more, at least time your trade-in to the right season to capture the smaller but real dealer-side seasonal bump. The article timing your trade-in to the season walks through how to negotiate a stronger dealer offer during peak demand months.
Also consider the model year cycle. Dealers become more motivated to acquire used inventory when new model arrivals deplete their pre-owned stock. See trade-in timing within the model year for a breakdown of those windows.

CarGurus Market Analysis
Search live listings for your make, model, trim, and mileage to see real-time pricing trends in your local market — more current than KBB or Edmunds during seasonal shifts.
Kelley Blue Book (KBB)
Get an instant estimated private-party, trade-in, and dealer retail value for your vehicle. Use as a baseline, but factor in the 4–8 week lag when selling during a seasonal peak.
Market Timing for Car Sellers: Everything You Need to Know
A comprehensive guide covering seasonal cycles, economic indicators, vehicle-type demand, and tactical windows for maximizing your sale price — the full strategic companion to this reference article.
Edmunds True Market Value
Edmunds' TMV tool provides transaction-based pricing data, giving you a useful second opinion alongside KBB when evaluating your vehicle's current market value.
Depreciation Curves by Vehicle Type
Understand how sedans, trucks, EVs, and SUVs depreciate at different rates so you can pinpoint the structural sweet spot for your sale — before the value curve drops sharply.

All claims are backed by peer-reviewed research. Sources on request.