
Key Takeaways
Seasonal Demand (Auto Market)
Seasonal demand refers to the predictable rise and fall in buyer interest for specific vehicle types at certain times of year. A convertible listed in April attracts more buyers — and commands a higher price — than the same car listed in November. This pattern isn't random; it follows consumer behavior, weather cycles, and life events like tax refunds and back-to-school spending. Understanding these cycles lets sellers time their listings to capture peak buyer interest.
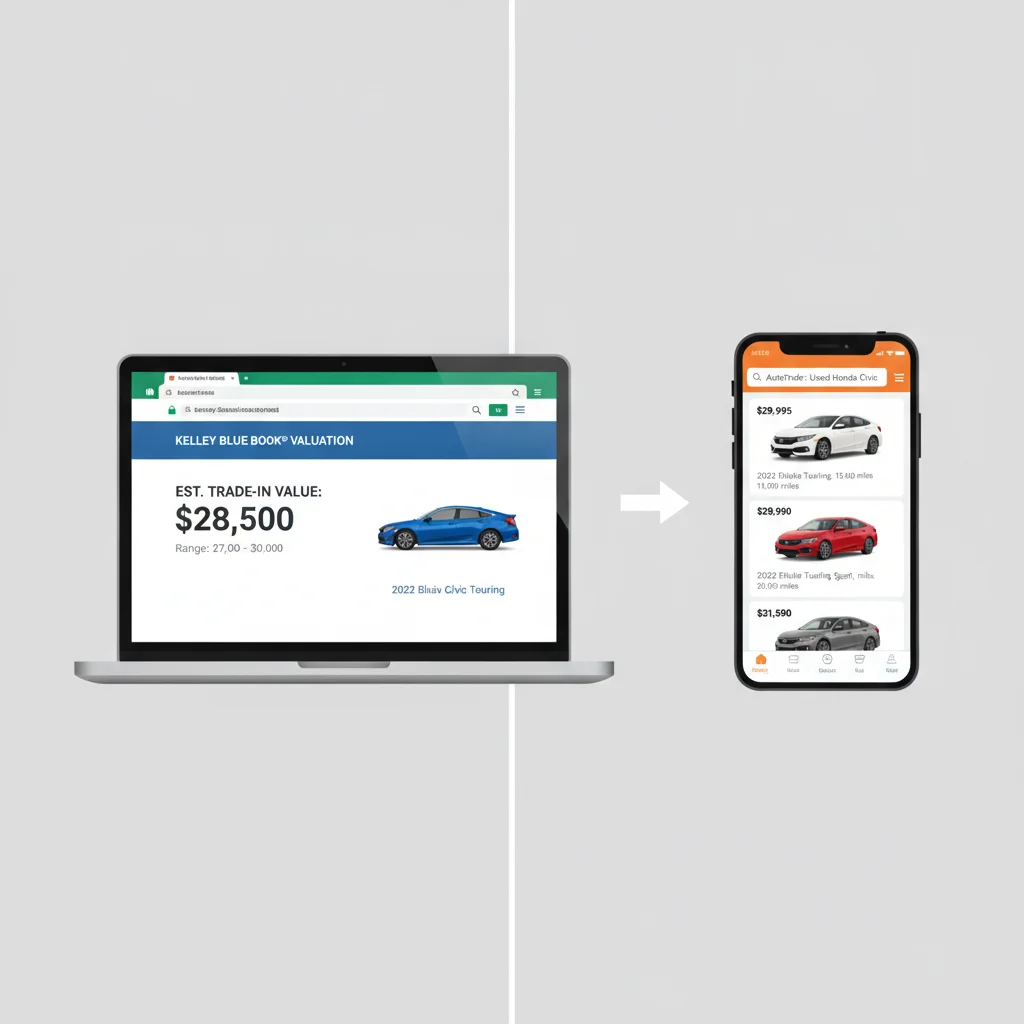
Valuation tools like Kelley Blue Book and Edmunds update their pricing algorithms using aggregated transaction data, but their regional and seasonal adjustments often lag real-time market conditions by several weeks — meaning a hot spring market may not be fully reflected in an online estimate until demand has already peaked.
Why Your Car's Value Isn't a Fixed Number
Every car has a title, a mileage reading, and a VIN — fixed facts. But market value isn't a fact. It's an estimate shaped by supply, demand, geography, and time of year. Most sellers treat their car's value like a single number printed on a receipt. That's a mistake that costs real money.
Online valuation tools give you a useful starting point, but they're averaging transaction data across thousands of sales over weeks or months. They're built to be accurate on average, not accurate for your specific car on the specific day you're trying to sell it. That gap between average and actual is where seasonal demand lives — and it can work strongly in your favor or against you, depending on when you list.
The concept applies across the entire used car market, but it hits hardest with vehicles that have strong lifestyle associations: open-top cars, off-road trucks, sport coupes, and fuel-economy leaders. These categories experience predictable demand cycles tied to weather, major spending events like tax season, and even school calendars.
Understanding seasonal demand doesn't require a data science degree. It requires knowing roughly when buyers want what you're selling — and using that timing as leverage. The rest of this article breaks down the mechanics, the vehicle categories most affected, how each major valuation tool handles seasonal data, and what you should actually be checking before you set your asking price.
The Seasonal Demand Calendar: Which Vehicles Peak When
Not every vehicle follows the same seasonal arc. Here's how the major categories break down, along with realistic dollar figures for the swings you can expect.
Convertibles and Sports Cars: Spring Is Everything
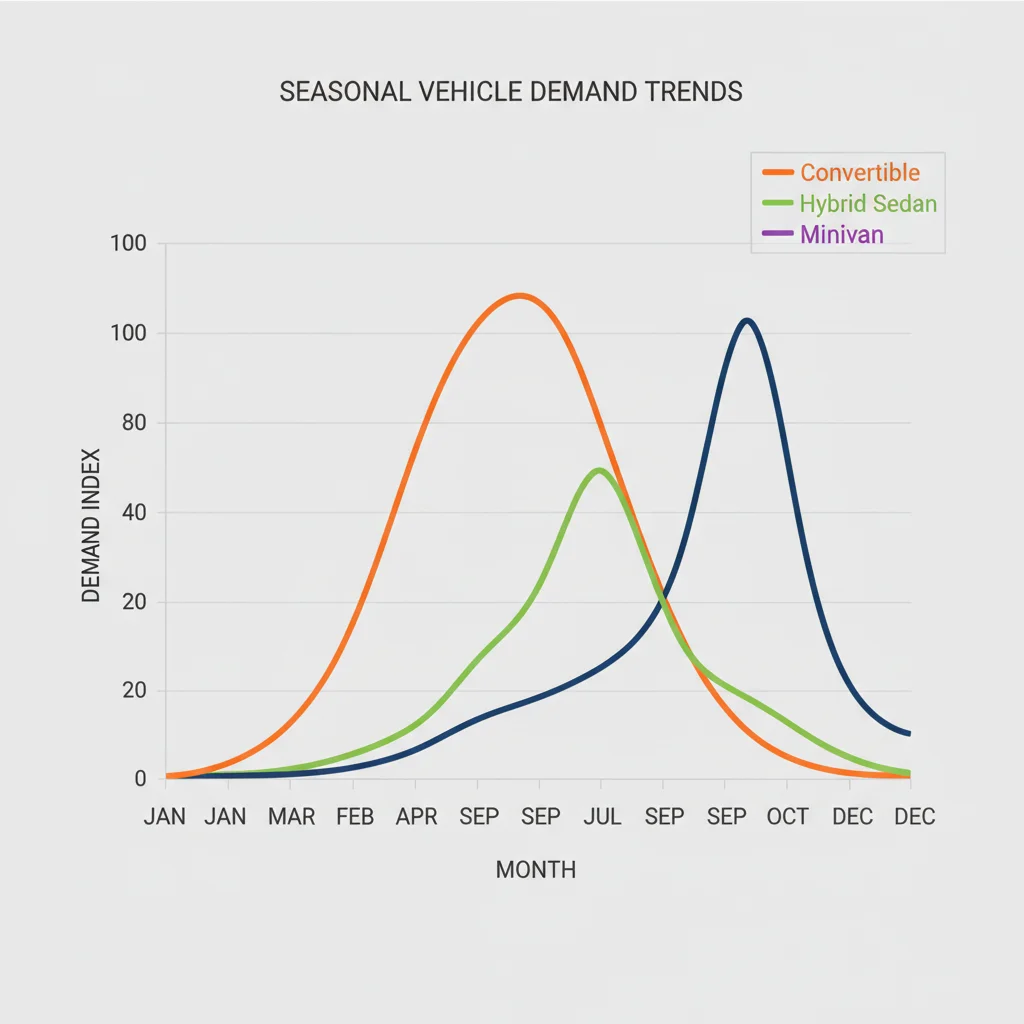
Demand for open-top vehicles — roadsters, convertibles, soft-top Jeeps — climbs sharply starting in February in warm-weather states and March through April in northern markets. Peak demand typically runs from March through Memorial Day weekend. By July, interest starts to soften, and listings that sit through August into September often require price reductions to move.
The price differential is real. A clean, mid-trim convertible listed in late March in a northern market will routinely attract $2,000–$4,000 more in offers than the same car listed in October. In colder climates, a November listing for a convertible is the worst possible timing — buyers know there are zero driving days ahead, and anyone shopping is purely opportunistic, looking for a bargain.
“The used car market is hyperlocal and hyper-seasonal. The same car listed two months apart, in the same zip code, can produce dramatically different outcomes — not because the car changed, but because the buyer pool did.”
— Brian Moody, Executive Editor, Autotrader
4WD Trucks and AWD SUVs: Fall Is Prime Time
Buyers in snow-belt states start thinking about winter capability in August and September. Demand for 4WD trucks, AWD crossovers, and heavy-duty SUVs builds through October and November. If you're selling a capable off-road or all-weather vehicle, listing by mid-October catches buyers while urgency is rising and before they've settled on a new vehicle purchase.
In southern states, seasonal movement is milder, but even Texas and Georgia see a modest uptick in 4WD interest in fall. The national averages still show a late-fall premium of $1,000–$2,500 for properly equipped trucks and SUVs. See how timing intersects with vehicle type for a deeper breakdown by segment.
Fuel-Efficient Sedans and Hybrids: Follow Gas Prices
This category is less season-driven and more event-driven. When gas prices spike — whether in spring due to refinery switchovers or in summer due to travel demand — interest in 40+ MPG sedans and hybrids rises quickly. When gas is cheap, these vehicles are a tougher sell regardless of season.
That said, there's a mild spring uptick tied to tax refund spending. Buyers with $3,000–$5,000 in refund money are active in the used market from late February through April, and fuel-efficient commuter cars are a common target. Timing a hybrid or high-MPG sedan sale to overlap with both tax season and a gas price spike is as close to perfect timing as you'll find in this category.
Minivans and Family SUVs: Summer and Late Summer
Family vehicle purchases often cluster around life transitions — a new baby, a move, kids starting school. Late summer (July–August) sees a meaningful uptick in minivan and family SUV sales as families reorganize before the school year. Spring also shows activity tied to tax refunds. Winter is the slowest period for this category.
$2,000–$4,000
Typical seasonal price swing for convertibles
Industry transaction data shows convertibles commonly fetch $2,000–$4,000 more when listed March–May versus October–December in northern U.S. markets.
3–6 weeks
Lag time in major valuation tool data
KBB and Edmunds algorithms typically lag real-time transaction prices by three to six weeks during fast-moving seasonal demand shifts.
11%
Jump in 4WD SUV search volume in October
AutoTrader internal data has shown search traffic for 4WD and AWD vehicles increases approximately 11% in October compared to the summer average.
$1,500+
Potential premium from peak-season timing
Sellers who list during peak demand windows for their vehicle category routinely achieve $1,500 or more above off-season comparable sale prices.
Top 3
Seasonal events driving used car demand spikes
Tax refund season (Feb–April), back-to-school (July–Aug), and pre-winter preparation (Sept–Oct) are the three most reliable annual demand catalysts in the used car market.
How Valuation Tools Handle Seasonal Data — and Where They Fall Short
The major online valuation tools are built for accuracy at scale, not real-time precision. Here's an honest assessment of what each one does well and where their seasonal data lags reality.
Kelley Blue Book (KBB)
KBB uses a proprietary algorithm that ingests dealer transaction data, auction results, and private party sales. It adjusts for region and market conditions, and it does incorporate seasonal trends — but on a rolling average basis. During a rapidly rising spring market, KBB estimates typically run 3–6 weeks behind actual transaction prices. If convertibles just started spiking in your area, KBB may still be showing a price that reflects the slower February market.
KBB is reliable for establishing a baseline. Don't use it as your ceiling in a hot seasonal market.
Edmunds True Market Value (TMV)
Edmunds is generally considered slightly more real-time than KBB because they update their transaction data more frequently and incorporate dealer inventory data. Their "True Market Value" label implies precision that's warranted in stable conditions, but seasonal spikes still outpace the algorithm. Edmunds is useful for cross-referencing KBB, and when both tools agree, you have a solid floor price.
NADA Guides
NADA pricing is built primarily for the lending industry — it's what banks and credit unions use to determine loan-to-value ratios. NADA values tend to run higher than KBB and Edmunds in many categories because they're designed to support collateral valuation, not necessarily reflect what a private party can realistically achieve. In a hot seasonal market, NADA can look almost prescient; in a slow off-season market, NADA values can set sellers up for disappointment when real buyers make lowball offers.
Carfax Listings and AutoTrader Comparables
This is where real-time price discovery actually happens. Searching active listings on Carfax, AutoTrader, or Cars.com for your exact vehicle — same year, make, model, trim, mileage range — tells you what real sellers are asking right now. Narrow it to your metro area or region for maximum relevance.
Listings aren't sale prices, but if 15 comparable vehicles in your area are all listed between $22,000 and $24,500, and KBB says $21,200, the market is running above the algorithm. In peak season, this gap is common. Check the listing age as well — cars sitting for 45+ days at a given price are priced too high for current demand. Cars listed within the last two weeks and already marked "price reduced" tell a different story.
Valuation Tools Are a Floor, Not a Ceiling
KBB, Edmunds, and NADA are built for average market conditions across large sample sizes. In peak seasonal demand windows, actual transaction prices frequently exceed tool estimates by $500–$2,500. Treat tool estimates as your negotiating floor — the minimum you should accept — not as the market rate you should ask for.
Seasonal Demand Compounds With Regional Demand
Seasonal pricing swings don't operate in isolation — they layer on top of regional supply and demand dynamics. A 4WD truck in Montana is worth more than the same truck in Florida year-round; in fall, the Montana premium gets even larger. Always filter your live listing comparables to your specific metro area, not national averages, for the most accurate price signal.
For sellers who also plan to trade in, understanding how seasonal timing affects dealer behavior is critical. Read how to time your trade-in to the season before you walk into a dealership.
Reading Live Market Signals Beyond the Valuation Tools
Valuation estimates give you a defensible number. Live market data gives you a real number. Using both together is the right approach. Here's a practical process for doing that before you price your listing.
- Pull three estimates: Get your vehicle's private party value from KBB, Edmunds TMV, and NADA. Note the range — if they're within $500 of each other, that's a stable baseline. If they diverge by $2,000+, the market is in flux.
- Search active listings: On AutoTrader or Cars.com, filter for your exact year, make, model, and trim within 100 miles. Note the price range and how many listings are available. High inventory with prices clustered near the bottom of the valuation range signals a buyer's market. Low inventory with prices above the tool estimates signals a seller's market.
- Check Facebook Marketplace: Private party sellers on Facebook often price more aggressively than dealers, and response rates reflect real buyer demand. A listing that generates 20 messages in 48 hours is priced at or below market. A listing that gets zero inquiries in a week is priced above it.
- Note listing age: Filter for "most recently listed" on AutoTrader or Carfax Listings. Fresh listings at high prices indicate seller confidence. Old listings at reduced prices indicate the market hasn't supported asking prices — a useful calibration point.
Use Listing Age as a Market Thermometer
When researching comparables on AutoTrader or Carfax Listings, sort by listing date rather than price. Vehicles listed within the past 7–10 days and already under contract or sold indicate strong demand at that price point. Vehicles listed for 45+ days with one or more price reductions tell you the market isn't supporting the original ask — don't repeat that mistake in your own listing.
Seasonal demand doesn't operate in isolation. Geography compounds it significantly — a 4WD truck commands more in Montana than in Miami regardless of season, and a convertible sells faster in San Diego in December than in Chicago in May. For the full picture on how location stacks on top of season, see regional price differences and how to use them.
Seller Strategy: Capturing Seasonal Premium Without Waiting Forever
Timing your sale to the ideal season sounds straightforward — but most people don't have the luxury of waiting six months for perfect conditions. Here's how to make the best decision with the timeline you actually have.
If You're at or Near Peak Season for Your Vehicle
List aggressively. Price at or slightly above the midpoint of comparable active listings, not at the floor set by the valuation tools. In a hot spring market for a convertible, buyers expect to pay market rate — they're not looking for a bargain, they're looking for the right car before the season starts. A well-photographed listing with a clean Carfax and a price in the top half of the comparable range will still move faster than you might expect.
If You're Three to Six Weeks Out from Peak
Start preparing now. Get a pre-sale inspection, pull your Carfax report, and photograph the car on a clear day. A listing that goes live exactly when demand peaks will outperform one that goes live after peak has passed. The first two weeks of your listing generate the most traffic — don't waste them by listing late.
If You're Selling in the Off-Season
Accept a modest price concession and emphasize timeless value signals: low mileage, complete service records, new tires, recent inspection. A convertible listed in November needs to be priced $1,000–$1,500 below spring comps to attract serious buyers. Trying to hold firm at peak-season prices will result in a listing that sits unsold until spring anyway — at which point you've spent months without the capital.
One alternative worth considering: if your vehicle has strong seasonal demand and you have flexibility, a short consignment arrangement through a local dealer can get your car in front of buyers even during slow months, though you'll give up 8–15% of sale price as a commission. Do the math against waiting — sometimes the commission is worth the liquidity.
The market timing hub covers additional strategies for reading economic and seasonal signals together. And if you're curious how broader economic conditions interact with seasonal patterns, what happens to used car prices in a recession is worth reading alongside this piece.
Putting It All Together: A Practical Pricing Framework
Here's a consolidated framework for setting a seasonal-aware asking price that's grounded in actual data:
| Step | Action | Tool |
|---|---|---|
| 1 | Get baseline private party estimate | KBB, Edmunds |
| 2 | Check lender-side value | NADA Guides |
| 3 | Find comparable active listings | AutoTrader, Cars.com |
| 4 | Check listing age and price reductions | Carfax Listings, AutoTrader |
| 5 | Assess seasonal position | Your own calendar awareness |
| 6 | Set price based on market position | Your judgment, informed by above |
If active listings are above the valuation tool estimate and your vehicle is in peak season, price at the high end of comparable listings. If active listings cluster at or below the tool estimates and you're in an off-season, price at or slightly below the midpoint to generate offers. Either way, build in a negotiation buffer of 3–5% — most buyers expect to negotiate, and pricing with room to move makes everyone feel like they won.
For a deeper look at how to apply seasonal reasoning specifically to depreciation timing, seasonal depreciation patterns and the best time to sell fills in the longer-term picture. And if you're on the buying side watching prices climb every spring, the spring car shopping surge explains exactly what you're up against.
Valuation Tools Are a Floor, Not a Ceiling
KBB, Edmunds, and NADA are built for average market conditions across large sample sizes. In peak seasonal demand windows, actual transaction prices frequently exceed tool estimates by $500–$2,500. Treat tool estimates as your negotiating floor — the minimum you should accept — not as the market rate you should ask for.
Seasonal Demand Compounds With Regional Demand
Seasonal pricing swings don't operate in isolation — they layer on top of regional supply and demand dynamics. A 4WD truck in Montana is worth more than the same truck in Florida year-round; in fall, the Montana premium gets even larger. Always filter your live listing comparables to your specific metro area, not national averages, for the most accurate price signal.

All claims are backed by peer-reviewed research. Sources on request.