| Average First-Year Depreciation | 15–25% of MSRP (Edmunds and KBB historical data) |
| 3-Year Depreciation: Full-Size Trucks | 20–30% (iSeeCars 2023 Depreciation Study) |
| 3-Year Depreciation: Mid-Size Sedans | 35–45% (iSeeCars 2023 Depreciation Study) |
| 3-Year Depreciation: Non-Tesla EVs | 45–65% (iSeeCars / Recurrent EV data, 2023) |
| Best Private-Party Price Advantage Over Trade-In | 10–20% more (KBB private party vs. trade-in comparison, 2024) |
| Seasonal Price Swing (Trucks, Spring vs. Winter) | $1,000–$2,500 (CarGurus seasonal pricing analysis) |
| Average Vehicle Depreciation at Year 5 | ~50% of original MSRP lost (Edmunds True Cost to Own data) |
Why Depreciation Curves Aren't One-Size-Fits-All
Most sellers make the same mistake: they look up their car's current value, set a price, and list it. What they miss is timing — and timing depends entirely on understanding how your specific vehicle type loses value over the years, not just today's number.
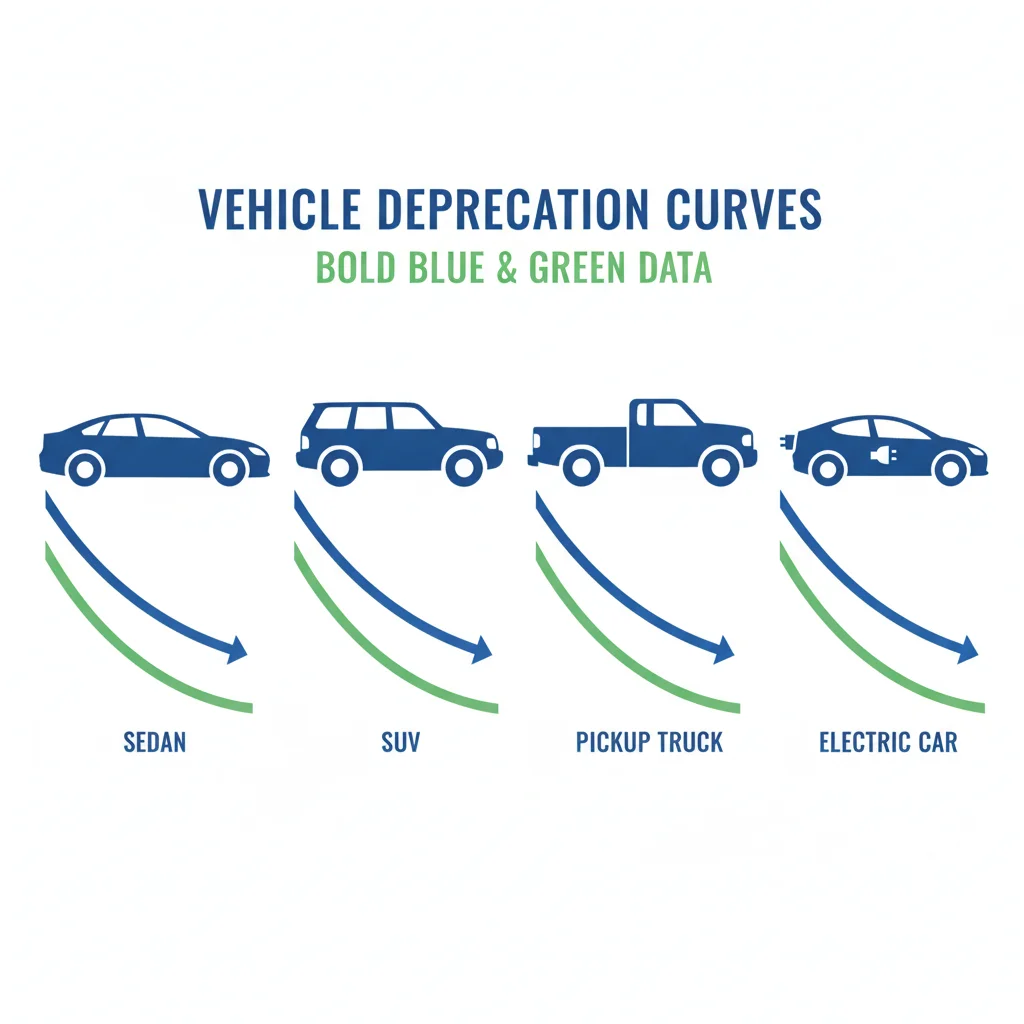
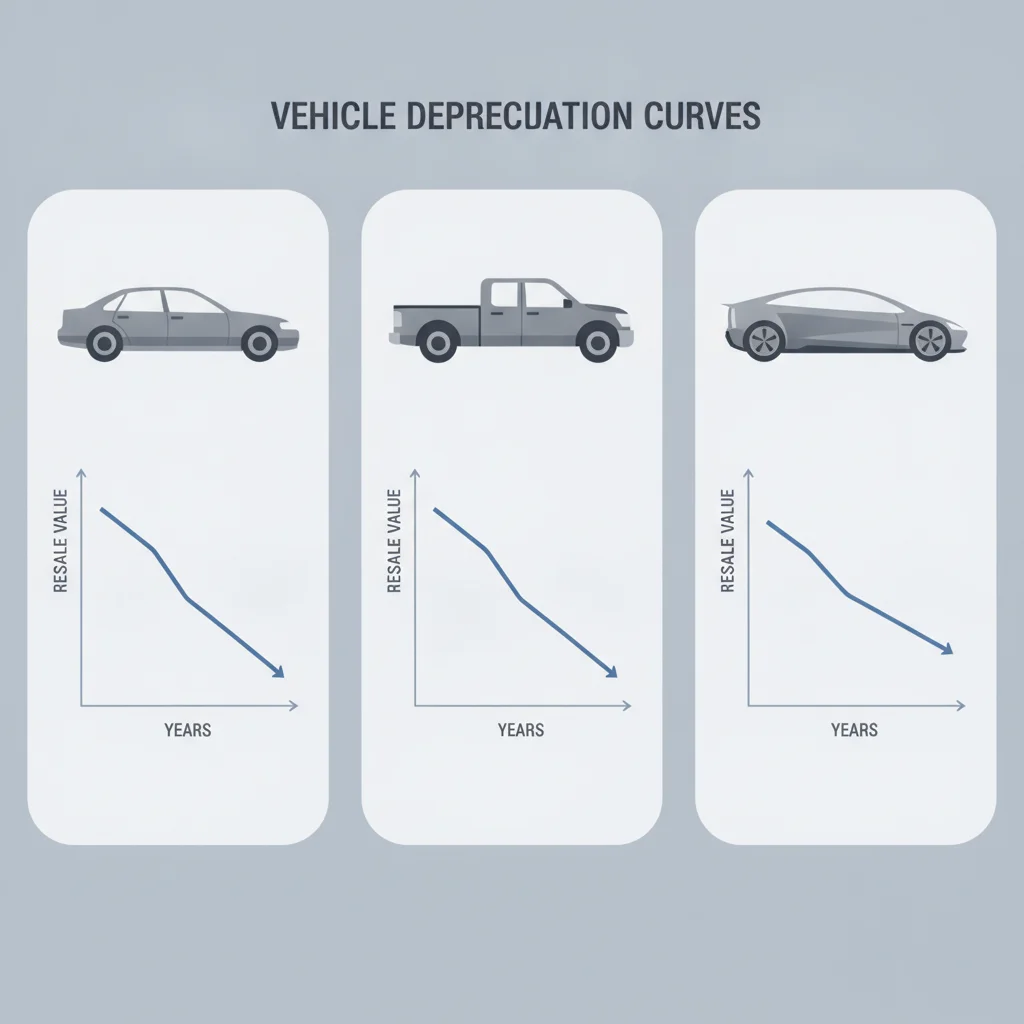
Depreciation isn't a straight line. It's a curve, and it differs dramatically between a mid-size sedan, a half-ton pickup, a luxury SUV, and an electric vehicle. A truck and a compact car bought the same year for the same price can be worth thousands of dollars apart just three years later — sometimes with the gap going in a direction that surprises sellers.
This article maps out those curves by vehicle type, explains what drives them, and gives you a concrete framework for deciding when to sell based on where your vehicle sits on its depreciation arc. For a broader look at how each segment stacks up over time, see our segment-by-segment depreciation comparison.
| Average First-Year Depreciation | 15–25% of MSRP (Edmunds and KBB historical data) |
| 3-Year Depreciation: Full-Size Trucks | 20–30% (iSeeCars 2023 Depreciation Study) |
| 3-Year Depreciation: Mid-Size Sedans | 35–45% (iSeeCars 2023 Depreciation Study) |
| 3-Year Depreciation: Non-Tesla EVs | 45–65% (iSeeCars / Recurrent EV data, 2023) |
| Best Private-Party Price Advantage Over Trade-In | 10–20% more (KBB private party vs. trade-in comparison, 2024) |
| Seasonal Price Swing (Trucks, Spring vs. Winter) | $1,000–$2,500 (CarGurus seasonal pricing analysis) |
| Average Vehicle Depreciation at Year 5 | ~50% of original MSRP lost (Edmunds True Cost to Own data) |
Depreciation Curve Basics: What the Shape Tells You
Every vehicle loses value in three identifiable phases. Understanding which phase your car is in helps you decide whether to sell now or hold.
Depreciation
The reduction in a vehicle's monetary value over time due to age, mileage, wear, and market conditions. It is typically expressed as a percentage of the original purchase price lost over a given period.
Depreciation Curve
A graphical representation of how a vehicle's value declines over time. The curve is typically steep in the first few years and flattens out as the vehicle ages.
Private Party Value
The estimated price a seller can expect to receive when selling a vehicle directly to another consumer, as opposed to trading it in to a dealer. Private party values are typically higher than trade-in values.
Trade-In Value
The amount a dealer will credit toward a new purchase in exchange for your current vehicle. Trade-in values are lower than private party values because the dealer needs margin to resell.
Kelley Blue Book (KBB)
A widely used vehicle valuation tool that provides estimated values for buying, selling, and trading in vehicles. KBB offers separate values for private party sales, trade-ins, and dealer retail pricing.
Manheim Market Report (MMR)
A wholesale vehicle auction pricing tool used primarily by dealers. MMR reflects what dealers pay for vehicles at auction and represents the practical floor value for most used vehicles.
Off-Lease Inventory
Vehicles returned at the end of lease agreements and sold into the used car market. High volumes of off-lease vehicles in a given segment can suppress used car prices by increasing supply.
Residual Value
The estimated worth of a vehicle at the end of a defined period, often a lease term. Residual values are set by lenders based on anticipated depreciation and market demand.
Phase 1: The Steep Drop (Years 1–3)
New vehicles lose the most value in the first three years — typically 30–40% of their original MSRP. The single biggest hit comes in the first 12 months, often 15–25% alone, simply because the car is no longer "new." Luxury sedans and entry-level EVs are especially brutal in this phase. If you bought new and you're inside year two, selling now usually means absorbing the worst of the loss.
Phase 2: The Flattening (Years 3–6)
After the initial freefall, the curve levels off. Annual depreciation slows to roughly 10–15% per year for most mainstream vehicles. This is the zone where selling often makes sense if you don't need the vehicle for the long haul — you've already absorbed the steepest drop, and you haven't yet crossed into the mechanical uncertainty zone that scares buyers.
Phase 3: The Tail (Years 7+)
Depreciation slows significantly, but so does the pool of buyers willing to pay a premium. Vehicles in this range have usually lost 60–70% of their original value. Selling here isn't necessarily bad — it just requires a realistic price and a buyer who's comfortable with the age of the vehicle.
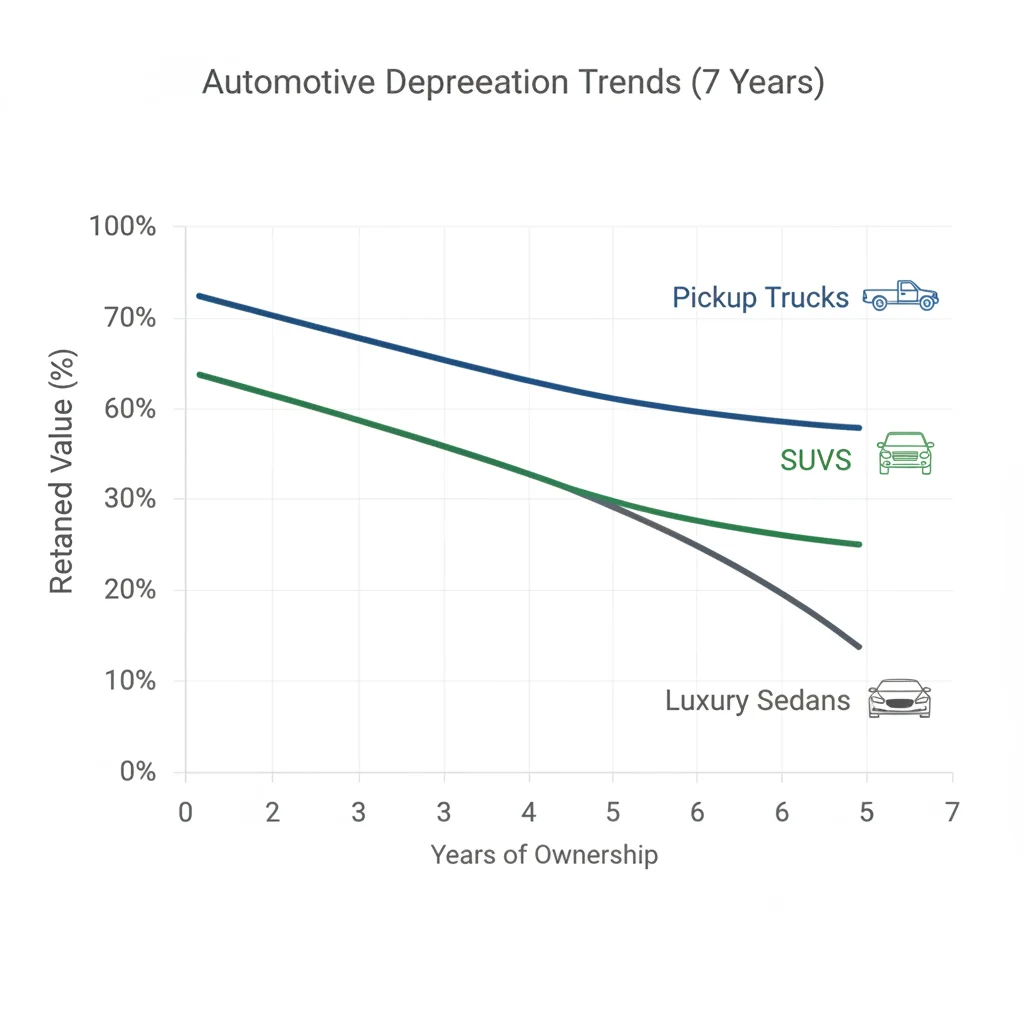
The shape of these phases shifts significantly depending on vehicle type, which is where sellers need to pay close attention. For category-specific benchmarks, our depreciation rate benchmarks by vehicle category gives you the actual percentages to anchor your pricing.
Sedans, Trucks, SUVs, and EVs: How Each Curve Differs
Sedans: Fast Drop, Limited Recovery
Mid-size and compact sedans depreciate aggressively in years one through three. A mainstream sedan priced at $28,000 new can realistically be worth $17,000–$19,000 by year three and drop below $13,000 by year six. Luxury sedans fare even worse — Mercedes E-Class and BMW 5-Series cars routinely lose 50–60% of their value in five years. The market for used sedans has softened as buyers migrated to SUVs and crossovers, compressing resale values further.
Best selling window: Years 2–4, before mileage stacks up and while demand for lower-maintenance options is still reasonable. Holding past year six produces diminishing returns for most sedan owners.
Pickup Trucks: The Flattest Curve in the Market
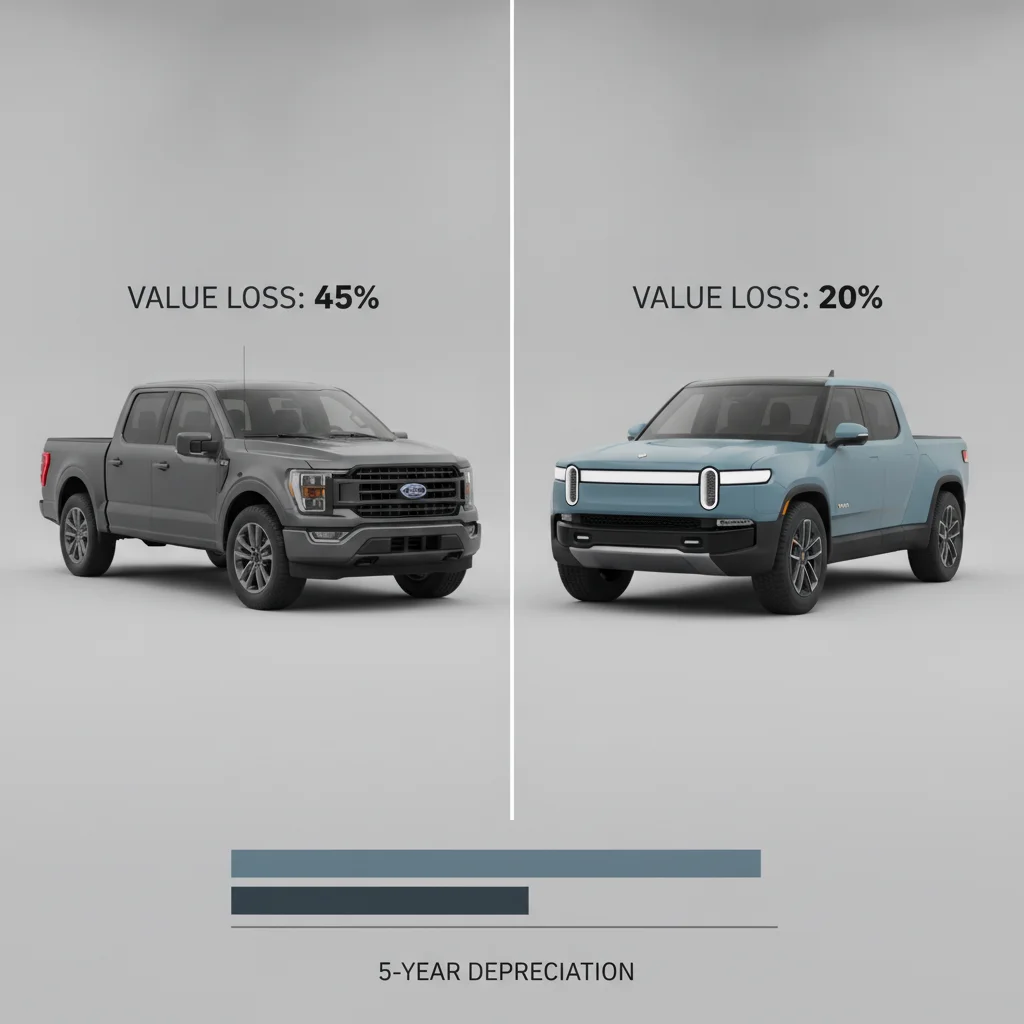
Full-size trucks — Ford F-150, Chevy Silverado, Ram 1500 — hold value better than any other mainstream vehicle category. The three-year depreciation on a well-specced F-150 typically runs 20–30%, compared to 35–45% for a comparable sedan. Work trucks and four-wheel-drive configurations hold even better because their utility commands a consistent secondary market.
Best selling window: Year 3–5 hits the sweet spot. You've let the initial drop stabilize, the truck still has plenty of life, and demand is strong. Selling before a major model redesign (which typically happens every 5–7 years) protects you from the "old gen" discount buyers will try to apply.
20–30%
Full-size truck 3-year depreciation rate
According to iSeeCars' 2023 depreciation study, full-size pickups consistently outperform all other mainstream segments in retained value.
65%
Max 3-year depreciation: some non-Tesla EVs
Certain non-Tesla electric vehicles have depreciated by up to 65% in three years, driven by rapid battery technology advancement and federal incentive changes.
10–20%
Private party price premium over dealer trade-in
Sellers who take the time to list privately typically net 10–20% more than dealer trade-in offers for the same vehicle, per KBB comparison data.
$2,500
Potential seasonal price swing for trucks
Listing a full-size pickup truck in spring versus winter can result in up to $2,500 difference in realized sale price due to seasonal demand from contractors and buyers.
15–25%
Value lost in a vehicle's first 12 months
Edmunds and KBB both document that the sharpest single depreciation hit occurs the moment a new car is registered and driven off the lot.
SUVs and Crossovers: Middle Ground With Exceptions
Three-row SUVs and midsize crossovers sit between trucks and sedans on the depreciation spectrum. Models like the Toyota Highlander and Honda Pilot hold value reasonably well because of high demand. Entry-level crossovers — think compact CUVs with less brand equity — depreciate closer to sedans. Luxury SUVs lose value fast once off-lease inventory floods the market, often making three-year-old luxury SUVs a much better buy than new ones.
Best selling window: Years 2–5 for mainstream SUVs. Luxury SUV owners should prioritize selling before year four, when lease returns drive down the value of comparable models.
Electric Vehicles: A More Volatile Curve
EVs are their own category and deserve separate treatment. The depreciation picture varies dramatically by brand and battery range. Non-Tesla EVs have historically depreciated faster than nearly any other vehicle type — 50–60% in three years is not uncommon for some models — largely because battery technology improvements and changing federal incentives make older models less competitive. Tesla models have historically held value better than other EV brands, though that advantage has compressed as competition increased and Tesla itself cut prices on new models.
For a detailed breakdown of what drives EV value loss, see our EV depreciation guide and our comparison of EV vs. gas-powered depreciation.
Best selling window: For most non-Tesla EVs, sell in years 2–3 before the next battery generation or major competitor model makes yours feel dated. Watch for federal EV incentive changes — a new or expanded credit for new EVs can immediately suppress used EV values by making new EVs more affordable by comparison. Our article on EV resale timing goes deeper on how news cycles and incentive windows affect your sell window.
Which Valuation Sources to Trust — and When to Use Each
Knowing your vehicle's depreciation curve is only useful if you're anchored to accurate current market data. There are four main valuation sources sellers use, and each has a different methodology and best use case.
Valuation Tools Lag Real-Time Markets
KBB and Edmunds update their estimates periodically, but they can lag actual market conditions by several weeks — particularly during rapid shifts like used car price spikes (as seen in 2021–2022) or downturns. Always cross-check your estimate against active listings on platforms like CarGurus or Autotrader to see what comparable vehicles are actually selling for in your market today. Asking price is not the same as realized sale price, so look for sold listings where available.
EV Federal Incentives Can Move Fast
Changes to federal EV purchase incentives — such as the Inflation Reduction Act's used EV credit or income eligibility rules — can shift used EV demand within weeks of a policy announcement. If you own an EV and are considering selling, monitor legislative news and new model announcements alongside standard depreciation data. A competitor's new model launch or a subsidy change can compress your vehicle's value faster than the standard depreciation curve would predict.
Kelley Blue Book (KBB)
KBB is the most recognized consumer-facing tool and is widely accepted as a reference point in private party transactions. It provides separate estimates for private party sale, trade-in, and dealer retail. For private sellers, use the Private Party Value — the Trade-In number will undercut you significantly. KBB tends to lag real-time market moves by a few weeks and can be slightly optimistic in slow markets.
Edmunds True Market Value (TMV)
Edmunds TMV pulls from actual transaction data and is often more accurate than KBB for recent market conditions. It's particularly useful for understanding what dealers are actually paying, which anchors trade-in negotiations. Sellers using Edmunds as a cross-check alongside KBB get a more reliable range than using either alone.
NADA Guides
NADA values skew higher than Edmunds or KBB because they were originally built for lenders and dealers. If a buyer tries to use NADA as a ceiling on what they'll pay, that's a reasonable reference. But for setting your own ask price in a private sale, NADA will often leave you overpriced. Use it as an upper-bound sanity check.
Manheim Market Report (MMR)
MMR is a wholesale auction data tool — it reflects what dealers pay for vehicles at auction, not what consumers pay in private transactions. It's not publicly accessible in full, but it's worth knowing about because it establishes the true floor of a vehicle's value. Dealers buying your trade-in are using numbers derived from MMR. If your KBB private party value is $14,000 and MMR pegs the same vehicle at $10,500, expect a dealer to offer somewhere in between.
The right approach: Cross-reference KBB and Edmunds for your private-party ask. Use NADA as an upper bound and understand that MMR defines your floor. Set your asking price at the top of the KBB–Edmunds range and leave negotiating room of 5–8%.
Using Seasonal and Timing Factors to Protect Your Price
Even within the same vehicle category, when you sell in a given year can move your realized price by 5–10%. This isn't abstract — it's supply and demand playing out seasonally and cyclically.
- Trucks: Demand peaks in spring (construction season, tax refund season). Listing a work truck in March or April versus December can add $1,000–$2,500 to your realized price.
- Convertibles and sports cars: Demand predictably spikes in late spring and early summer. Selling a Mustang convertible in May will get you more than selling it in November.
- 4WD SUVs and winter-capable vehicles: Counter-seasonal listings work in your favor — list before the first cold snap, when buyers are suddenly aware they need winter capability.
- Fuel-efficient sedans and hybrids: These jump in demand when gas prices spike. If you see a run-up at the pump, that's a window to list.
- EVs: Federal tax credit changes, new model announcements, and charging infrastructure news all create demand swings that have nothing to do with the calendar. Staying alert to EV policy news can give you a meaningful timing edge.
For a deeper look at how seasonality maps to specific vehicle types, see our articles on timing your sale by vehicle type and seasonal depreciation patterns.

The takeaway: combine your vehicle's position on its depreciation curve with seasonal demand data and you have a legitimate edge over sellers who just list whenever they feel like it.
Valuation Tools Lag Real-Time Markets
KBB and Edmunds update their estimates periodically, but they can lag actual market conditions by several weeks — particularly during rapid shifts like used car price spikes (as seen in 2021–2022) or downturns. Always cross-check your estimate against active listings on platforms like CarGurus or Autotrader to see what comparable vehicles are actually selling for in your market today. Asking price is not the same as realized sale price, so look for sold listings where available.
EV Federal Incentives Can Move Fast
Changes to federal EV purchase incentives — such as the Inflation Reduction Act's used EV credit or income eligibility rules — can shift used EV demand within weeks of a policy announcement. If you own an EV and are considering selling, monitor legislative news and new model announcements alongside standard depreciation data. A competitor's new model launch or a subsidy change can compress your vehicle's value faster than the standard depreciation curve would predict.
Finally, if you're weighing this as a buyer rather than a seller — or doing research on a used vehicle purchase — our guide to used car depreciation curves covers the same ground from the buyer's perspective.
Quick Reference: Selling Windows by Vehicle Type
Use this table as a fast reference when deciding whether to sell now or hold. These windows represent when most sellers capture the best balance of retained value and market demand.
| Vehicle Type | Typical 3-Year Depreciation | Best Selling Window | Key Risk to Avoid |
|---|---|---|---|
| Compact / Mid-Size Sedan | 35–45% | Years 2–4 | Holding past year 6 in a weak sedan market |
| Luxury Sedan | 45–60% | Years 2–3 | Off-lease competition flooding the market |
| Full-Size Pickup Truck | 20–30% | Years 3–5 | Selling just after a new model generation launches |
| Mainstream SUV / Crossover | 28–38% | Years 2–5 | Waiting too long as fuel economy preferences shift |
| Luxury SUV | 40–55% | Years 2–4 | Off-lease glut suppressing your private-party value |
| Non-Tesla EV | 45–65% | Years 2–3 | New incentive legislation making newer EVs cheaper |
| Tesla / Top EV Brands | 25–45% | Years 2–4 | Tesla price cuts on new models pulling down used values |
| Sports Car / Convertible | 25–45% (varies widely) | Spring/Summer, Years 2–5 | Out-of-season listing suppressing demand |
These ranges are generalizations — individual model reputation, trim level, mileage, condition, and regional demand all shift the numbers. But the directional guidance holds across most real-world transactions. Anchor to actual KBB and Edmunds data for your specific vehicle, use this table to confirm whether your timing is reasonable, and you'll be in a much stronger position than the average seller who lists without a strategy.
Kelley Blue Book (KBB) Private Party Value Tool
Enter your vehicle details to get KBB's private party value estimate — the most widely recognized reference point for consumer-to-consumer transactions. Use it alongside Edmunds TMV for a reliable asking price range.
Edmunds True Market Value (TMV)
Edmunds TMV draws from actual transaction data to estimate real-world selling prices. It's particularly accurate for understanding where the market is right now, often faster than KBB to reflect market shifts.
iSeeCars Depreciation Research Reports
iSeeCars publishes annual data-driven depreciation reports broken down by make, model, and segment. Their methodology is transparent and useful for validating which vehicles hold value in your target category.
CarGurus Active Listing Comparator
Search active and recently sold listings on CarGurus to see what buyers are actually paying — not just what sellers are asking — for vehicles comparable to yours in your local market.
Recurrent EV Resale Value Reports
Recurrent specializes in EV battery health and resale data. Their reports give EV sellers a uniquely detailed picture of how battery degradation and model updates affect specific EV resale values.

All claims are backed by peer-reviewed research. Sources on request.