Key Takeaways
Vehicle Valuation Variables
Vehicle valuation variables are the specific attributes of a car — such as its odometer reading, trim level, and exterior color — that pricing tools and appraisers use to calculate a dollar estimate. Each variable adjusts the baseline value up or down depending on how it compares to market norms. Understanding which variables carry the most weight lets sellers price strategically rather than guessing.
Valuation algorithms typically source real transaction data from auctions, dealer sales, and private party listings, then apply regression models that assign a dollar coefficient to each input variable — meaning mileage, trim, and color each have a measurable, quantifiable impact on the output estimate.
Why These Three Variables Dominate Your Estimate
Plug any car into Kelley Blue Book, Edmunds, or NADA and you'll be asked the same core questions: How many miles? What trim? What color? That's not coincidence. Those three inputs are the easiest for a seller to verify and the most reliably correlated with actual transaction prices in the underlying datasets.
The problem is that most sellers treat these fields like a formality. They punch in their numbers, get a range, and either feel relieved or confused — without understanding how much each variable is actually moving the needle. That gap in understanding is expensive. A seller who doesn't know that dropping from 45,000 miles to 30,000 miles on their model year would add $1,800 to the estimate can't make an informed decision about pricing or timing.
This article breaks down how mileage, trim level, and color each function inside valuation models, what realistic dollar impacts look like, and where the major tools diverge in how they weight them. If you want the full picture of what else goes into an estimate beyond these three factors, see everything that goes into a car's estimated value.
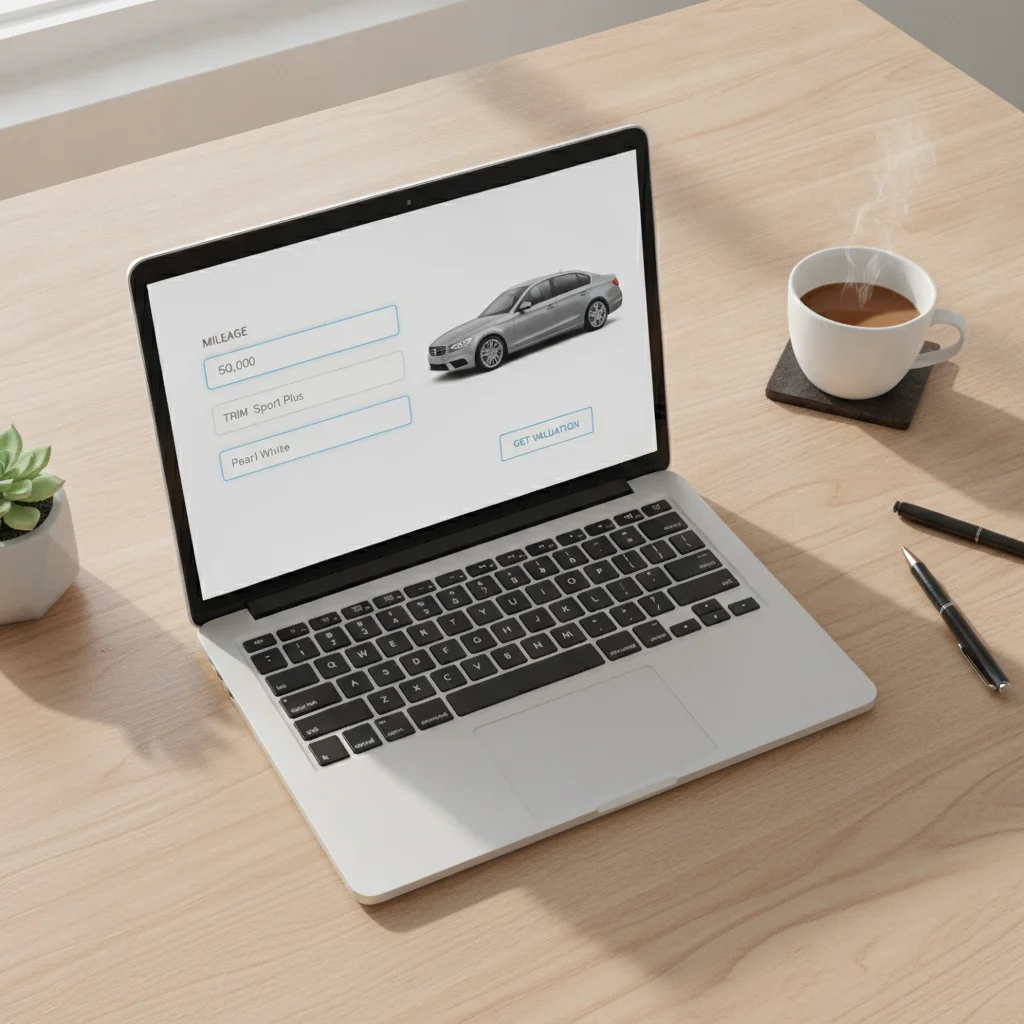
Mileage: The Variable With the Most Dollar Weight
Mileage is the most powerful single variable in almost every valuation model. The logic is straightforward: miles proxy for wear, remaining mechanical life, and future maintenance cost — all things buyers price in before making an offer.
The Average Mileage Baseline
Most valuation algorithms are calibrated around a national average of roughly 12,000–13,500 miles per year. That means a 5-year-old car at 60,000–67,500 miles sits in a neutral zone — no bonus, no penalty. Deviate from that baseline and the algorithm adjusts.
Here's a realistic range of what those adjustments look like for a mainstream midsize sedan or popular SUV:
| Miles vs. Expected Average | Approximate Value Impact |
|---|---|
| 20,000 miles below average | +$1,200–$2,500 |
| 10,000 miles below average | +$500–$1,200 |
| At average | Baseline |
| 10,000 miles above average | –$500–$1,100 |
| 20,000 miles above average | –$900–$2,000 |
| 30,000+ miles above average | –$1,500–$3,500+ |
These are illustrative ranges, not fixed formulas. A luxury vehicle, a truck with a towing history, or a sports car will see different coefficients. But the directional logic holds across categories.
~$1,100
Average value drop per 10,000 excess miles
Based on Edmunds transaction data analysis for mainstream midsize vehicles operating above the annual mileage average.
$3,000–$8,000
Typical trim-level spread on popular SUVs
Reflects the private party valuation difference between base and top-tier trims for models like the Toyota RAV4 and Honda CR-V in recent model years.
1.6M+
Vehicles analyzed in iSeeCars 2024 color study
iSeeCars examined over 1.6 million used vehicle transactions to quantify the resale impact of exterior color choice.
~$250
Median algorithmic color adjustment in KBB
Major valuation tools typically apply color adjustments of $100–$400, far smaller than mileage or trim impacts on the same vehicle.
3 tools
Minimum sources to check before pricing
KBB, Edmunds, and NADA each use different datasets and methodologies, producing a range that defines your real negotiating corridor.
Where Mileage Penalties Start to Flatten
One important nuance: the mileage penalty isn't linear forever. On an older, heavily depreciated vehicle — say, a 10-year-old car already at $8,000 — an extra 20,000 miles might only knock off $600–$800, because there's less total value left to lose. The sharpest per-mile penalties hit vehicles in the $15,000–$35,000 range where depreciation is still active and buyers have higher expectations.
Low Mileage Is Worth Advertising Explicitly
If your car is more than 15,000 miles below the expected average for its age, don't bury that in the specs — lead with it in your listing headline and opening description. Buyers actively filter on mileage, and a well-below-average odometer reading is one of the fastest ways to attract more serious inquiries and reduce time on market.
Run All Three Tools, Then Weight by Channel
KBB private party is your asking price anchor for a direct sale. Edmunds TMV is your reality check on what buyers will actually pay. NADA is the dealer's floor — know it before you walk into a trade-in negotiation. Using just one tool leaves you flying blind on a third of the transaction landscape.
How Tools Differ on Mileage
Edmunds tends to apply tighter mileage adjustments that track closely with auction transaction data. KBB's private party estimates can be slightly more generous on low-mileage vehicles. NADA's guide (favored by banks and credit unions) typically reflects a more conservative wholesale-adjacent view. If you're selling privately, KBB's private party tool often gives the most relevant starting point — but cross-check with Edmunds' suggested retail to understand your ceiling.
For a deeper look at why the same car produces different numbers across tools, see why your car's valuation differs across every tool you check.
Trim Level: The Variable Sellers Most Often Get Wrong
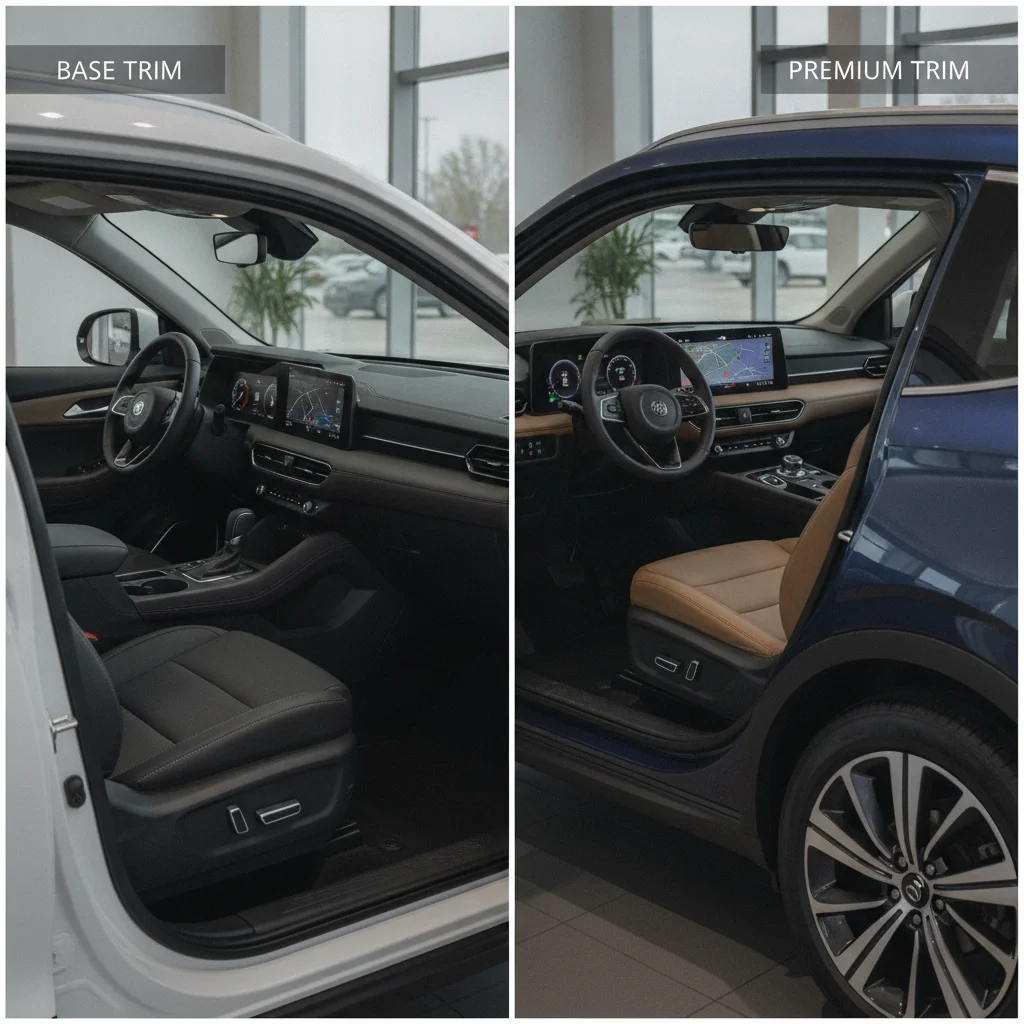
Trim level is where sellers leave the most money on the table — not because they lie, but because they genuinely don't know which trim they have, or they underestimate how much it matters to the algorithm.
How Valuation Tools Identify Trim
Every major tool decodes your VIN to pull the factory-configured trim and standard equipment list. When you type in your trim manually, you're confirming what the VIN already suggests — or creating a mismatch that could work against you if a buyer or dealer re-runs the numbers.
The dollar spread between trims on the same model year can be substantial:
- Base vs. mid-tier trim: $1,500–$4,000 difference in private party value
- Mid-tier vs. top-tier trim: $2,000–$6,000 difference
- Base vs. top trim on a full-size truck or luxury SUV: $5,000–$12,000+ difference
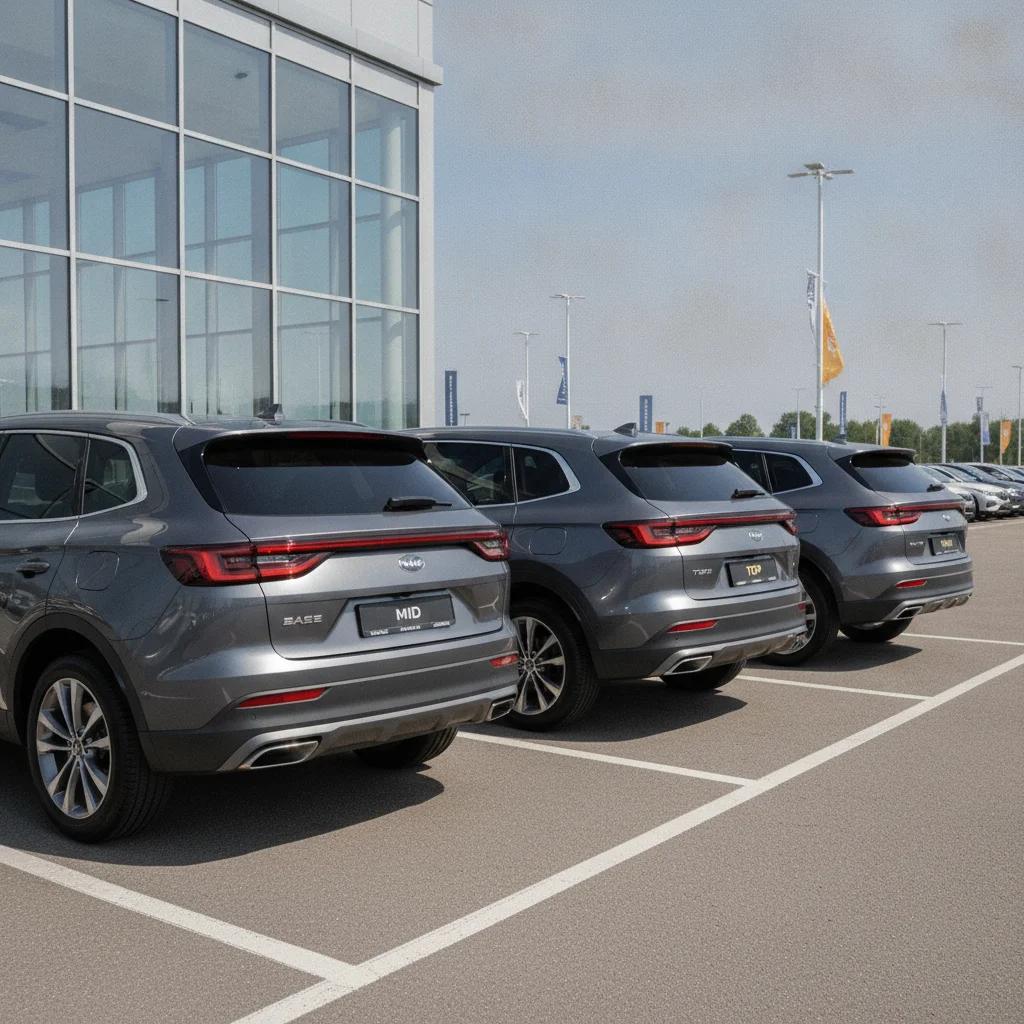
Why Trim Premiums Don't Always Match MSRP Premiums
Here's the counterintuitive part: a trim that cost $5,000 more when new doesn't necessarily retain $5,000 more in value years later. Some features — upgraded audio systems, rear-seat entertainment screens — depreciate faster than the market for the vehicle overall. Others, like all-wheel drive, leather seating, and advanced driver assistance packages, retain value more stubbornly because buyers actively seek them out.
For a detailed breakdown of which factory options actually slow depreciation versus which ones don't, see trim level and package effects on long-term resale value.
Trim Verification Matters More for Older Vehicles
On a vehicle more than 8–10 years old, some trim-level distinctions begin to compress in value — buyers at lower price points are less willing to pay a premium for leather or a sunroof that's now aging. However, powertrain-related trim differences (V6 vs. four-cylinder, AWD vs. FWD) tend to hold their value differential much longer. Always verify trim, but calibrate your expectations on feature-based premiums for older cars.
Instant Offer Platforms Weight Variables Differently
Platforms like CarMax, Carvana, and Vroom apply proprietary adjustments on top of standard mileage and trim inputs. They also factor in local inventory levels — if they have 14 of your model in stock already, your offer will reflect that regardless of what KBB says. Treat instant offers as a data point, not a ceiling.
Service Records Can Partially Offset High Mileage
A car with 95,000 miles and a complete documented service history — oil changes, fluid flushes, timing belt replacement — is genuinely less risky than an 80,000-mile car with no records. Valuation tools can't capture this distinction, but buyers and appraisers can. Presenting a maintenance binder or digital records printout is one of the few ways sellers can push back against a mileage-based discount.
Practical Step: Verify Your Trim Before You Enter Anything
Pull your original window sticker (available on most manufacturer websites using your VIN), or look up your VIN on a free decoder. Confirm your trim name, then cross-reference the standard equipment list with what's actually in your car. If you have options that appear on a higher trim's spec sheet — sunroof, heated seats, premium audio — note them explicitly in your listing. Valuation tools may not give you credit automatically, but buyers will pay for them if you call them out.
If you want the buyer's perspective on how trim levels are evaluated, trim levels explained walks through how that same spread looks from the purchasing side.
Color: Real Impact, But Smaller Than You Think
Color is the most overrated valuation variable in casual seller conversation and the most underrated in terms of actual market-time impact. Here's the honest breakdown.
What the Tools Actually Do With Color
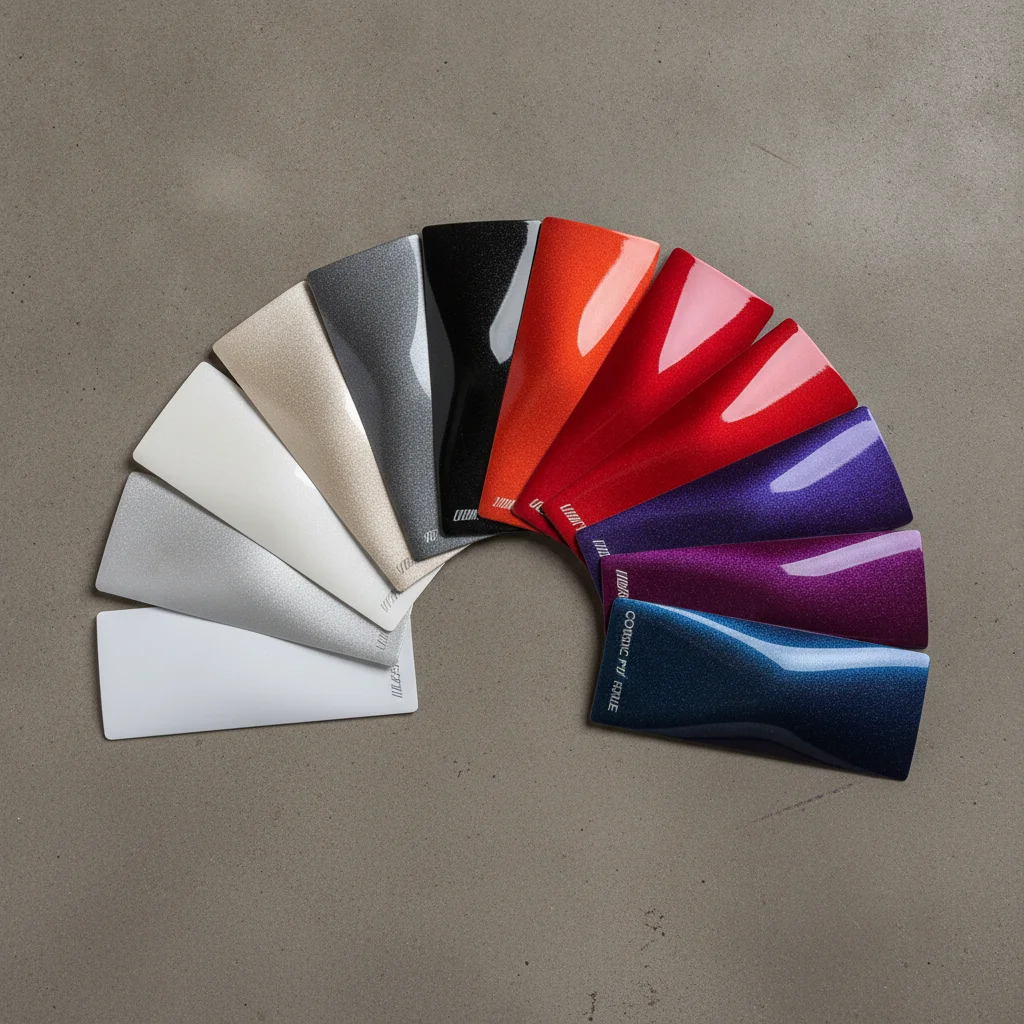
KBB, Edmunds, and NADA all collect color as an input, but most apply adjustments of only $100–$400 in either direction for mainstream vehicles. The algorithm effect is real but modest compared to mileage or trim. The more significant color effect plays out in days-to-sell and buyer negotiation leverage — not necessarily in the tool's output number.
Colors That Hold Value Best
A 2024 analysis by iSeeCars examining over 1.6 million vehicle sales found that:
- White is the most popular new car color and faces the highest resale volume, keeping values competitive
- Silver and gray are strong neutral performers with broad buyer appeal
- Black holds well in luxury segments but shows wear more visibly, which can affect condition assessments
- Yellow, orange, and green vehicles sometimes sell at a slight premium in segments where enthusiast demand is concentrated (sports cars, off-road trucks), but take significantly longer to sell in mainstream categories
- Brown, gold, and purple consistently underperform in both speed and price across most segments
“Color is one of the most emotionally driven purchase factors for new cars, but in the used market it becomes a liquidity factor. An unpopular color doesn't mean your car is worth less — it means fewer buyers will compete for it, and that shifts pricing power to the buyer.”
— Ivan Drury, Director of Insights, Edmunds
The Real Color Risk: Days on Market
An uncommon color doesn't just affect the tool's output — it affects how long your car sits. A car that sits for 60 days gives buyers negotiating power. A private seller stuck with an unusual color may find their actual transaction price $500–$1,500 below the tool's estimate, not because the algorithm penalized the color heavily, but because limited buyer competition forced a discount at close.
This dynamic shows up differently in trade-in appraisals. Dealers factor in reconditioning time and days-on-lot projections, so an unusual color can earn a lower trade-in offer than a tool suggests — even when the tool barely adjusts for it. See how color affects dealer trade-in offers for more on that gap.
How the Major Valuation Tools Weight These Variables Differently
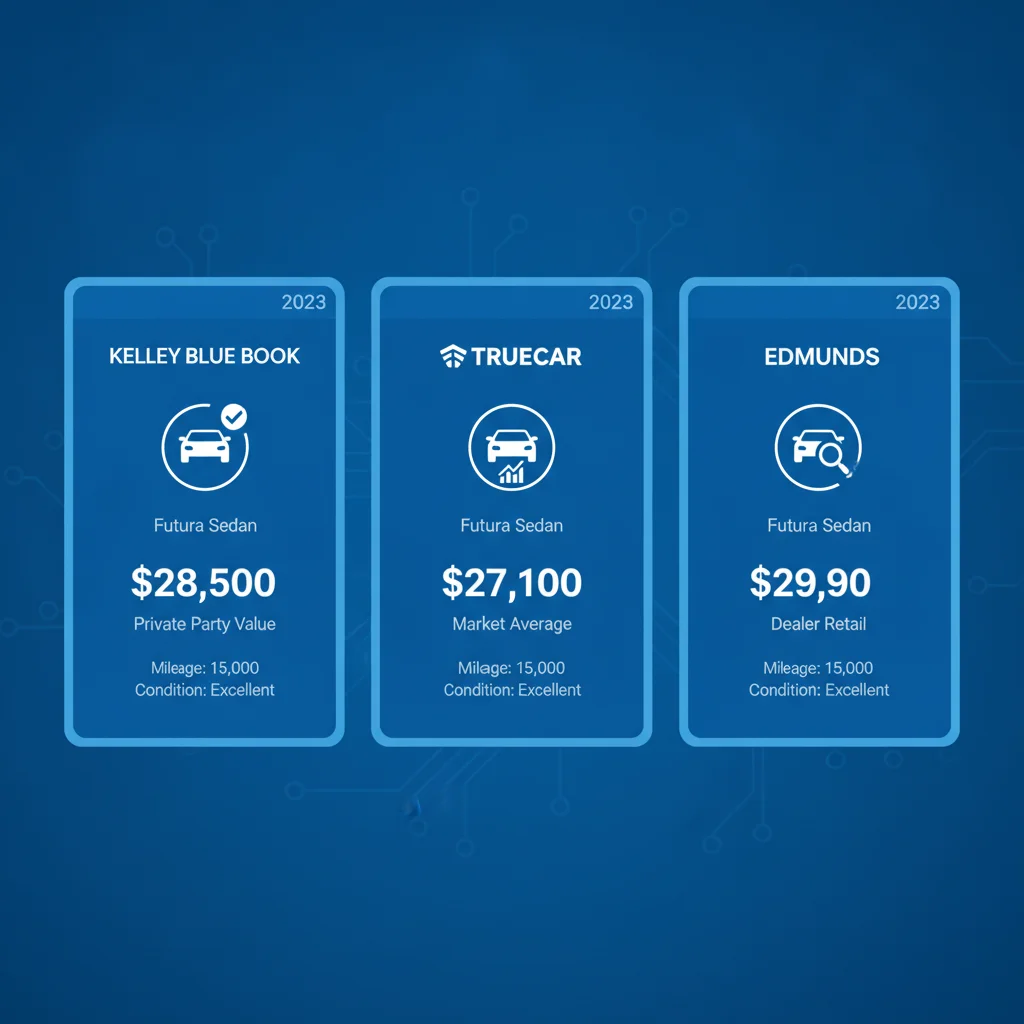
Running the same car through KBB, Edmunds, and NADA often produces three meaningfully different numbers. Understanding why helps you choose which estimate to anchor on depending on your selling channel.
| Tool | Primary Data Source | Mileage Sensitivity | Trim Handling | Color Adjustment | Best For |
|---|---|---|---|---|---|
| KBB (Private Party) | Dealer sales, private listings | Moderate-high | VIN + manual confirm | Minor ($100–$300) | Private party asking price ceiling |
| Edmunds (TMV) | Transaction data, dealer inventory | High | VIN-decoded, detailed | Minor ($50–$250) | Realistic transaction benchmark |
| NADA | Auction wholesale, lending data | Moderate | Equipment-based adjustment | Minimal | Loan value, dealer trade-in floor |
The practical takeaway: for a private party sale, use KBB's private party value as your ceiling and Edmunds' True Market Value as your sanity check. If you're heading into a dealer negotiation, pull the NADA trade-in figure first so you know the floor they're working from. Never walk in knowing only one number.
Low Mileage Is Worth Advertising Explicitly
If your car is more than 15,000 miles below the expected average for its age, don't bury that in the specs — lead with it in your listing headline and opening description. Buyers actively filter on mileage, and a well-below-average odometer reading is one of the fastest ways to attract more serious inquiries and reduce time on market.
Run All Three Tools, Then Weight by Channel
KBB private party is your asking price anchor for a direct sale. Edmunds TMV is your reality check on what buyers will actually pay. NADA is the dealer's floor — know it before you walk into a trade-in negotiation. Using just one tool leaves you flying blind on a third of the transaction landscape.
Keep in mind that all three tools have blind spots — regional supply imbalances, fleet/rental history, and mechanical condition details fall outside their models. Factors valuation algorithms can't see covers what these tools systematically miss and how to account for it when you price your car.
Putting It All Together: How to Price Strategically
Armed with an understanding of how each variable moves your estimate, here's a practical pricing workflow that works whether you're selling privately, trading in, or using an instant offer platform.
- Pull your exact trim and options list — Use your VIN on the manufacturer's website or a free decoder. Confirm every factory option. Misidentifying your trim is the fastest way to leave money behind.
- Run all three tools at the correct mileage — Enter your actual odometer reading. Note where you land relative to the annual average baseline. If you're 15,000 miles below average, KBB and Edmunds will credit you — make sure your listing highlights that too.
- Note your color category — If you have a neutral color (white, silver, gray, black), expect no material drag from color. If you have an unusual color, budget for slightly longer selling time or a modest negotiation concession, and price accordingly.
- Compare the range across tools — The spread between your lowest and highest estimate is your negotiating corridor. Price at the upper end for private party; expect dealer offers near the lower end.
- Adjust for what the tools can't see — Full service records, recent major maintenance (new tires, brakes, timing belt), and a clean vehicle history report all justify pricing at the top of the range. Deferred maintenance, accident history, or a branded title push you toward the bottom.
Trim Verification Matters More for Older Vehicles
On a vehicle more than 8–10 years old, some trim-level distinctions begin to compress in value — buyers at lower price points are less willing to pay a premium for leather or a sunroof that's now aging. However, powertrain-related trim differences (V6 vs. four-cylinder, AWD vs. FWD) tend to hold their value differential much longer. Always verify trim, but calibrate your expectations on feature-based premiums for older cars.
Instant Offer Platforms Weight Variables Differently
Platforms like CarMax, Carvana, and Vroom apply proprietary adjustments on top of standard mileage and trim inputs. They also factor in local inventory levels — if they have 14 of your model in stock already, your offer will reflect that regardless of what KBB says. Treat instant offers as a data point, not a ceiling.
Service Records Can Partially Offset High Mileage
A car with 95,000 miles and a complete documented service history — oil changes, fluid flushes, timing belt replacement — is genuinely less risky than an 80,000-mile car with no records. Valuation tools can't capture this distinction, but buyers and appraisers can. Presenting a maintenance binder or digital records printout is one of the few ways sellers can push back against a mileage-based discount.
If you're specifically evaluating instant offer platforms like CarMax, Carvana, or Vroom, note that their algorithms weight mileage and trim similarly to the tools above but apply additional proprietary adjustments based on local inventory levels. See how mileage, condition, and trim level affect instant offer payouts for specifics on how those platforms differ.
Finally, don't overlook the less-obvious factors that drag value down. High mileage takes the blame, but prior rental use, mismatched paint panels, or even a non-neutral color can hurt your offer just as meaningfully. Factors that quietly tank your trade-in value covers the full list of what appraisers flag that sellers typically miss.

All claims are backed by peer-reviewed research. Sources on request.