Key Takeaways
Valuation Algorithm Blind Spots
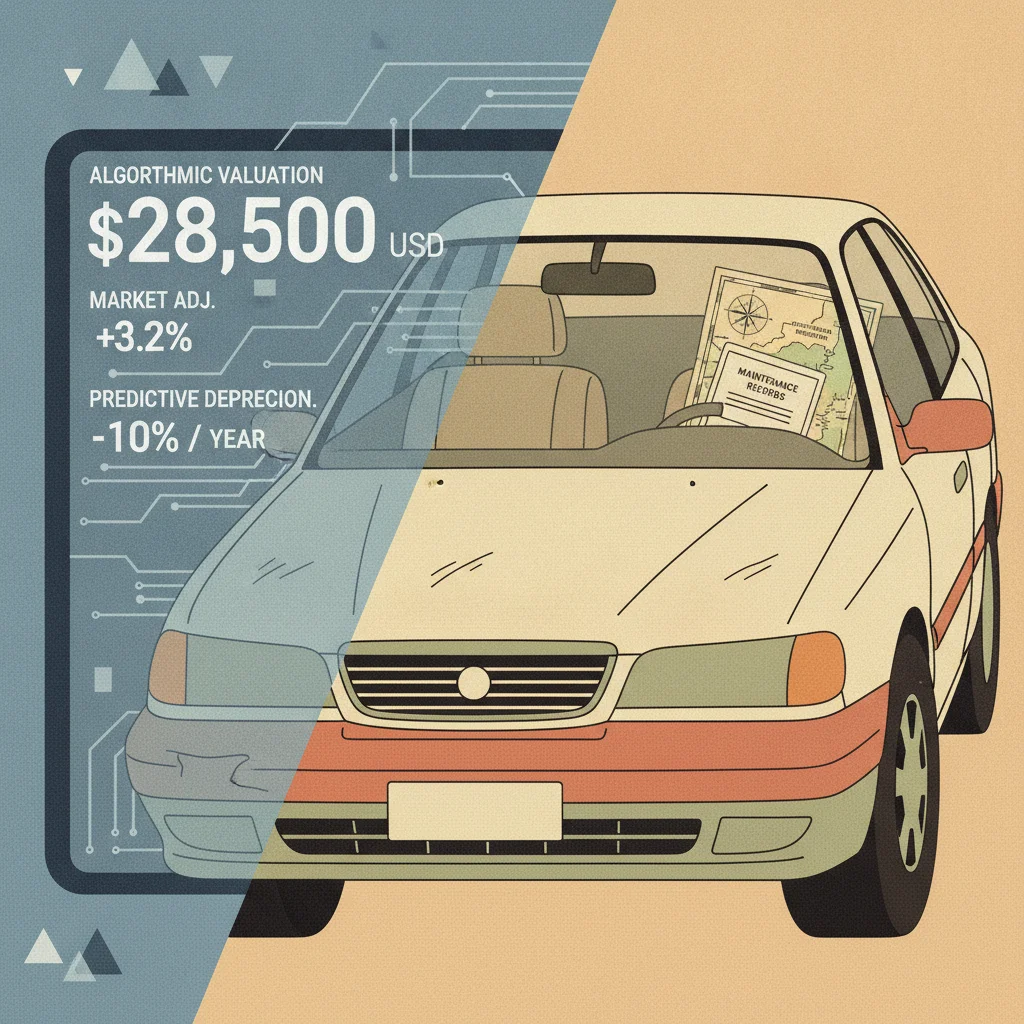
Valuation algorithm blind spots are the real-world factors that affect a car's market price but can't be captured by automated pricing tools like KBB, Edmunds, or CarGurus. These tools calculate estimates based on structured data inputs — year, make, model, mileage, trim, and zip code — but they can't evaluate things like a documented service history, a recent engine rebuild, regional supply shortages, or subtle cosmetic wear that photographs hide. The gap between what an algorithm estimates and what a buyer will actually pay can range from a few hundred to several thousand dollars depending on the vehicle.
Most valuation models use regression analysis on recent transaction data, which means they reflect average outcomes for average vehicles — not outliers with exceptional or problematic histories.
What Valuation Algorithms Actually Measure
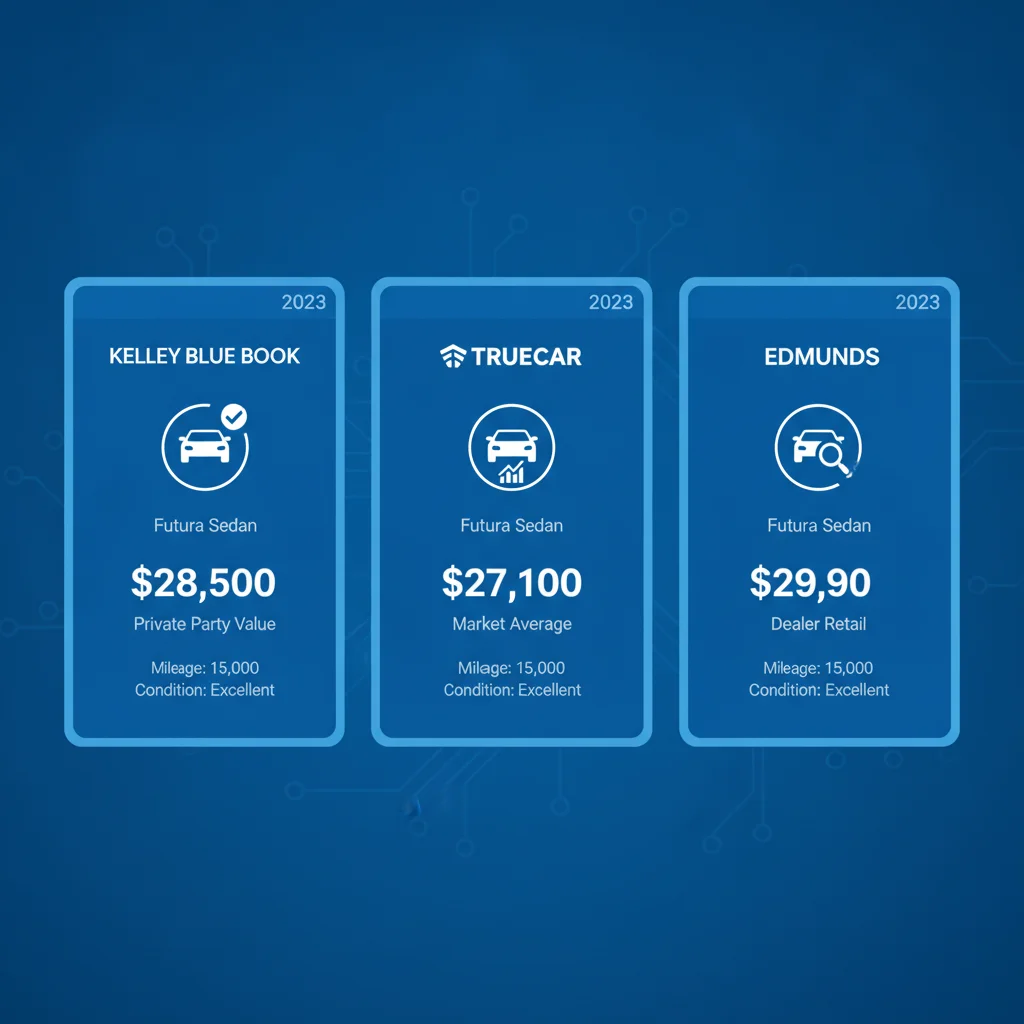
Before you can understand what these tools miss, you need to understand what they actually do. Valuation tools — KBB, Edmunds, CarGurus, NADA, Black Book — are built on regression models trained on millions of vehicle transactions. You plug in a year, make, model, trim, mileage, and zip code, select a condition category, and the algorithm returns an estimate anchored to what similar vehicles sold for in recent history.
That's genuinely useful. It keeps sellers from pricing a 2017 Civic at $28,000 because it has new floor mats. But the model has a hard ceiling: it can only process the structured inputs it receives. Everything outside those fields — the oil-change receipts in the glove box, the crack in the rear bumper that doesn't photograph, the fact that every truck on your block is going under contract in three days — is invisible to it.
Understanding why each tool returns a different number is the first step. But the deeper problem is that even if every tool agreed, they'd all be missing the same categories of information. That's what this article addresses.

Condition Is a Category, Not a Measurement
The single biggest blind spot in every valuation tool is the condition field. You're asked to select from categories like Excellent, Very Good, Good, Fair, or Poor. The algorithm maps that selection to a dollar range. But two cars both labeled "Good" can be worlds apart in actual buyer appeal — and therefore in real sale price.
Consider two identical 2019 Honda CR-Vs with 55,000 miles, both selected as "Good" condition:
- Car A: Minor door ding on the passenger side, faded headliner, slightly worn driver's seat bolster, all four tires at 4/32" tread depth.
- Car B: Zero exterior damage, interior looks almost new, fresh tires installed six months ago, rear brakes replaced last year.
Same algorithm output. Completely different buyer experience. Car B will sell faster, often at or above asking, while Car A will face lowball offers and negotiation pressure. The gap can easily run $1,000–$2,500 depending on the market.
The Condition Category Problem Is Systemic
Studies and internal data from valuation platforms consistently show that sellers cluster in the top two condition tiers — "Excellent" and "Very Good" — at rates that don't match real-world vehicle populations. The result is that algorithm outputs for those tiers are calibrated against a smaller, genuinely superior sample than most sellers' vehicles represent. If you're picking "Very Good" and your car has a door ding, a worn seat, or tires below 6/32", you're inflating your own estimate and setting yourself up for buyer pushback.
Algorithms Reflect History, Not the Present
Every valuation model is backward-looking by design — it's trained on completed transactions, not current buyer intent. During periods of rapid market change (like the post-pandemic inventory shortage or a sudden fuel price spike that shifts demand from SUVs to compacts), algorithmic estimates can lag real market conditions by weeks or even months. In volatile markets, live listing data is more reliable than tool output.
This is why honest, specific condition disclosure in your listing actually works in your favor. Buyers who discover undisclosed issues in person feel misled — and they negotiate harder. Buyers who read an accurate description and then see it confirmed in person feel reassured — and they negotiate less.
For sellers who want to close that gap before listing, the detailing and repairs hub breaks down which prep steps deliver real return on investment versus which ones are money pits.
Service History: The Invisible Value Multiplier
No valuation algorithm has ever asked you to upload your maintenance records. That's a fundamental limitation. A car with a complete dealer-stamped service history is a materially different asset than an identical car sold with zero documentation — but both return the same estimate from KBB.
$500–$2,000
Premium for documented service history
Industry estimates from used car dealers and private party transaction analyses suggest complete maintenance records support meaningfully higher offers, particularly on vehicles over 75,000 miles.
10–20%
Regional price variance above/below national estimate
Analysis of regional listing data by automotive research firms shows prices for identical vehicles can swing 10–20% depending on local supply-demand imbalances not captured in national models.
72%
Sellers who select 'Very Good' or higher condition
According to internal data cited by valuation platforms, the majority of sellers self-select into the top two condition tiers, while independent inspections more often place vehicles in the 'Good' category.
30 min
Time needed for meaningful local market research
Reviewing active local listings on two platforms (Facebook Marketplace and Craigslist) for your exact trim and mileage range provides real-time pricing signal no algorithm can match.
3–5x
More listings on major platforms vs. 5 years ago
The growth in private party listing volume means local competitive data is now richer and more accessible than ever, making it a practical cross-check against algorithmic estimates.
In the private party market, documented service history does real work. It functions as a risk-reduction tool for the buyer. When a seller can show oil changes every 5,000 miles, timing belt replacement at the manufacturer's recommended interval, and recent brake service — all on shop receipts — they've answered the buyer's biggest unspoken question: has this car been neglected?
High-mileage vehicles benefit most from this. Once a car crosses 80,000–100,000 miles, buyers shift from evaluating it as a commodity to evaluating it as a specific mechanical object with a specific history. Algorithms can't make that distinction — they just apply a mileage penalty. A well-documented high-mileage car often performs significantly better in a private sale than the tool estimate suggests. Pricing a high-mileage car accurately requires supplementing tool data with exactly this kind of market-level context.
Organize Your Records Before You List
Pull together every service receipt, dealer inspection report, and warranty document before you write your listing. Scan or photograph them and make them available to serious buyers on request. If you have a CarFax or AutoCheck report that aligns with your records, include a link to it in the listing. Buyers who can verify your claims before the test drive show up ready to buy, not ready to negotiate you down.
Price Recent Work Conservatively
A $1,200 brake and rotor job doesn't add $1,200 to your asking price — it removes the buyer's reason to negotiate you down $1,500. Price your service investments as risk-reduction tools, not as direct additions. Buyers will pay a modest premium for a car they don't have to fix; they won't pay dollar-for-dollar for maintenance that was your obligation as an owner.
Regional Demand: When Geography Overrides the Algorithm
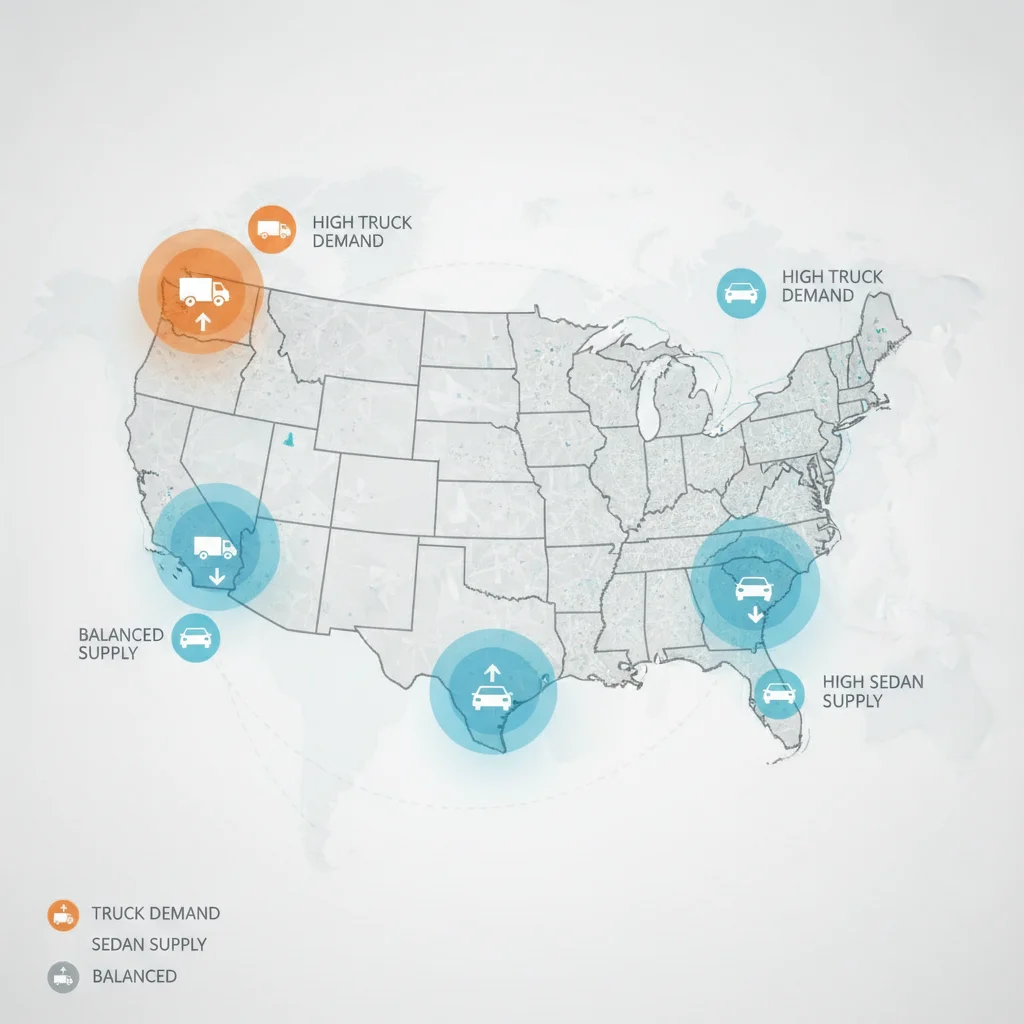
Most valuation tools accept a zip code and apply a regional adjustment. That's better than nothing. But zip-code weighting is based on historical transaction data, which lags real-time market conditions by weeks or months. It also can't detect hyperlocal dynamics that shift supply and demand in ways no national dataset would capture.
A few real scenarios where geography overrides algorithmic estimates:
The practical implication: before you set your asking price, spend 30 minutes on Facebook Marketplace and Craigslist searching your exact make, model, trim, and mileage range within a 50-mile radius. Count the active listings. Note how long they've been up. Compare asking prices to what the tools returned. That 30 minutes of market research is worth more than any algorithm's regional adjustment factor.
Market timing also plays into this — seasonal demand shifts for trucks, convertibles, and AWD vehicles are real and measurable, but most algorithms smooth them out over time rather than reflecting the current moment.
Recent Work and Upgrades: Invisible Until Proven
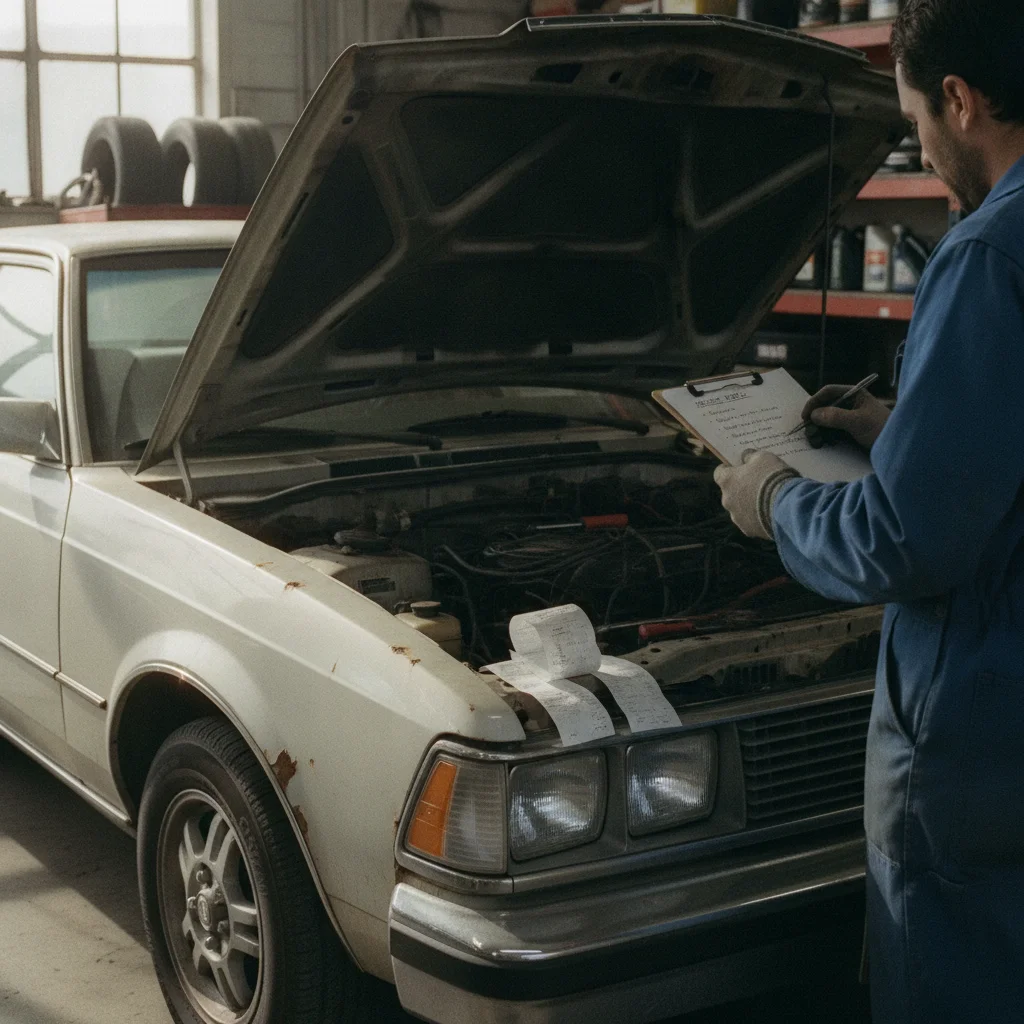
You replaced the timing chain last year. You put on a new set of Michelin all-seasons in October. You had the transmission fluid and differential serviced at 90,000 miles like the manual says. None of that registers in any valuation tool — because no tool asks for it.
This creates a frustrating situation for sellers who've invested in proper maintenance. You've reduced the buyer's risk, but the algorithm doesn't know that, and it won't give you credit for it. The only way to capture that value is to prove it with receipts and communicate it clearly in your listing.
“The best thing a seller can do is think like a buyer walking into the car cold. That buyer isn't seeing the money you spent on maintenance — they're seeing everything they might have to spend after the purchase. Your job is to close that uncertainty gap with documentation, not with a higher asking price and a verbal assurance.”
— Scotty Kilmer, Automotive mechanic and consumer advice commentator with decades of hands-on vehicle inspection experience
The same logic applies in reverse to upgrades. Aftermarket wheels, a remote start system, a premium stereo — these typically add zero algorithmic value and often minimal real-world value, because buyers don't necessarily want your specific choices. The exception is factory or certified dealer add-ons that appear on the original window sticker, which some tools do factor in when you add packages during configuration.
What definitely matters to algorithms — and what you should verify you've entered correctly — are factory options like heated seats, a panoramic sunroof, a towing package, or a premium audio system. These are the structured inputs the model can actually use. How trim level and factory options shift your estimate explains exactly how much those fields move the number.
Organize Your Records Before You List
Pull together every service receipt, dealer inspection report, and warranty document before you write your listing. Scan or photograph them and make them available to serious buyers on request. If you have a CarFax or AutoCheck report that aligns with your records, include a link to it in the listing. Buyers who can verify your claims before the test drive show up ready to buy, not ready to negotiate you down.
Price Recent Work Conservatively
A $1,200 brake and rotor job doesn't add $1,200 to your asking price — it removes the buyer's reason to negotiate you down $1,500. Price your service investments as risk-reduction tools, not as direct additions. Buyers will pay a modest premium for a car they don't have to fix; they won't pay dollar-for-dollar for maintenance that was your obligation as an owner.
Using Algorithms as a Floor, Not a Ceiling
The right mental model for valuation tools is this: they tell you where the market starts, not where it ends. The algorithm gives you the baseline for an average car in your category. Everything specific about your car — its actual condition, its documented history, its regional supply context, its recent mechanical work — adjusts from there.
For most private sellers, the process should look like this:
- Run your car through two or three tools and note the range. Understanding why each tool returns a different number helps you interpret which estimates to weight most heavily.
- Search active listings in your area for your specific trim and mileage range. Note how many are listed and what they're asking.
- Assess your car's condition honestly — not optimistically. Identify specific deficiencies that will drive buyer negotiation and factor them in as downward adjustments.
- Identify documented advantages — complete service history, recent major work, factory packages — and price them in as upward adjustments from the tool baseline.
- Set your asking price 5–8% above your actual target to leave room for negotiation without pricing yourself out of the market.
Sellers who skip steps 2 through 4 and go straight from tool output to listing price are the ones who end up with cars sitting for 60 days and eventually accepting offers below what they would have gotten with better pricing discipline from the start. Why sellers overprice their cars is a pattern worth understanding before you list.
The algorithm is a starting point — a useful one. But the final price your car commands in the real market is determined by factors it was never built to see.

All claims are backed by peer-reviewed research. Sources on request.