| Fastest-depreciating segment | Luxury sedans (German brands) (Industry residual value averages, 2023) |
| Slowest-depreciating segment | Full-size pickup trucks (NADA Used Car Guide, 2023) |
| Average 5-year value retained — sedans | 38–45% of MSRP (Segment average, mainstream brands) |
| Average 5-year value retained — SUVs | 47–56% of MSRP (Segment average, compact to midsize) |
| Average 5-year value retained — trucks | 55–65% of MSRP (Full-size half-ton segment average) |
| Average 5-year value retained — EVs | 38–55% of MSRP (Highly variable by brand and model year) |
| First-year depreciation (all segments) | 17–27% of MSRP lost (Average new-car depreciation, year 1) |
| Mileage assumption for benchmarks | 12,000–15,000 miles/year |
Why Depreciation Benchmarks Matter When You're Selling
When you list your car for sale, you're not just competing with other individual sellers — you're competing with dealers, auctions, and the entire used-car market's sense of what a vehicle is worth. Set your price too high and the listing sits. Set it too low and you leave real money on the table.
The missing ingredient for most sellers is a reliable benchmark: a data-backed starting point that reflects how their type of vehicle typically depreciates. A three-year-old midsize sedan and a three-year-old full-size pickup truck have followed dramatically different value curves from the moment they left the lot. Treating them as interchangeable is a pricing mistake.
This reference article gives you category-level depreciation benchmarks — typical percentage-of-original-MSRP values retained at 1, 3, and 5 years — across the five major vehicle segments: sedans, SUVs and crossovers, pickup trucks, sports and performance cars, and electric vehicles. Use these numbers to anchor your expectations before you check valuation tools like KBB and Edmunds for a vehicle-specific figure.
| Fastest-depreciating segment | Luxury sedans (German brands) (Industry residual value averages, 2023) |
| Slowest-depreciating segment | Full-size pickup trucks (NADA Used Car Guide, 2023) |
| Average 5-year value retained — sedans | 38–45% of MSRP (Segment average, mainstream brands) |
| Average 5-year value retained — SUVs | 47–56% of MSRP (Segment average, compact to midsize) |
| Average 5-year value retained — trucks | 55–65% of MSRP (Full-size half-ton segment average) |
| Average 5-year value retained — EVs | 38–55% of MSRP (Highly variable by brand and model year) |
| First-year depreciation (all segments) | 17–27% of MSRP lost (Average new-car depreciation, year 1) |
| Mileage assumption for benchmarks | 12,000–15,000 miles/year |
For a deeper look at how all of these concepts fit together, see the complete owner's reference on vehicle depreciation, which covers key terms, formulas, and influencing factors in one place.
How to Read the Benchmarks
Each benchmark below is expressed as percentage of original MSRP retained at a given point in the vehicle's life. So if a segment shows "55% retained at year 3," a vehicle that originally sold for $40,000 would be worth roughly $22,000 three years later under average conditions.
Residual value
The estimated worth of a vehicle at a specific future point in time, often expressed as a percentage of its original MSRP. Lenders use residual values to set lease payments; sellers use them to anchor pricing.
MSRP
Manufacturer's Suggested Retail Price — the sticker price on a new vehicle before any dealer markups, discounts, or incentives. Depreciation benchmarks use MSRP as the starting point.
Depreciation curve
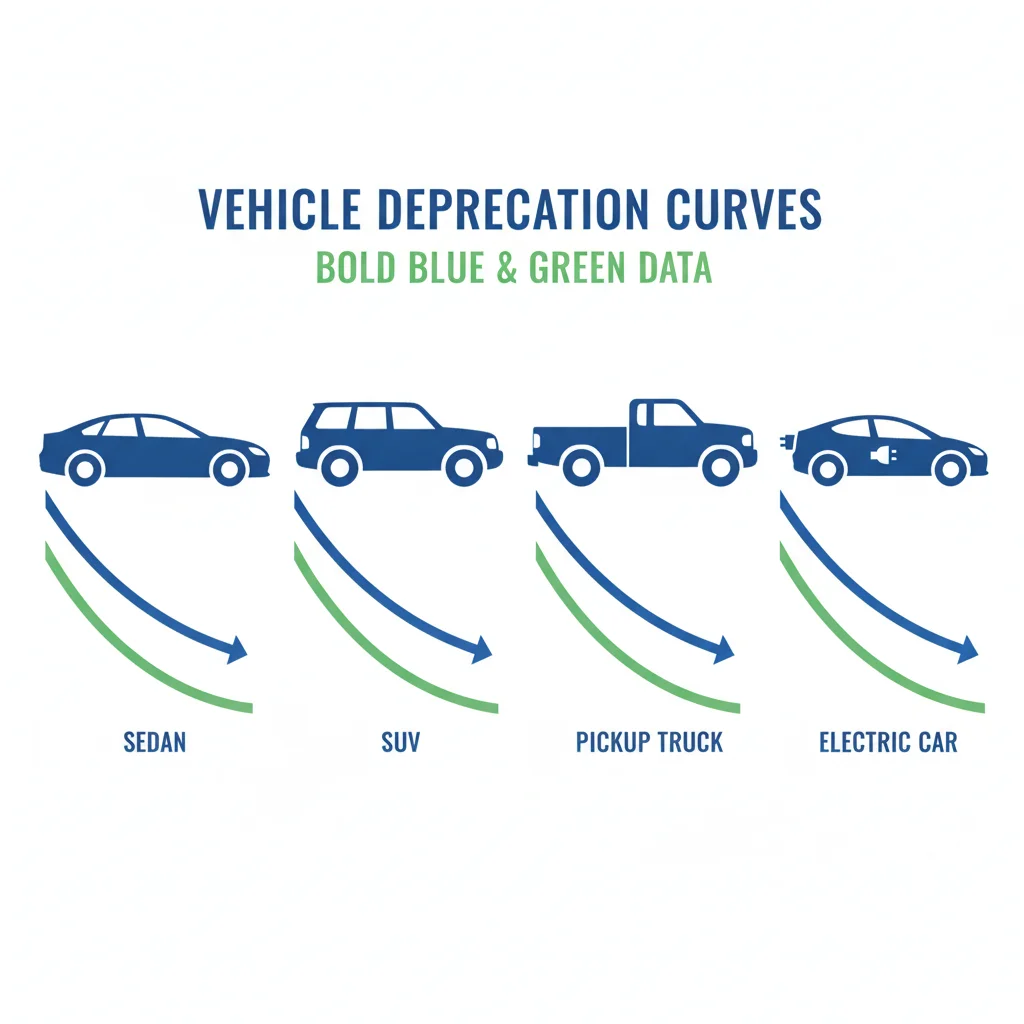
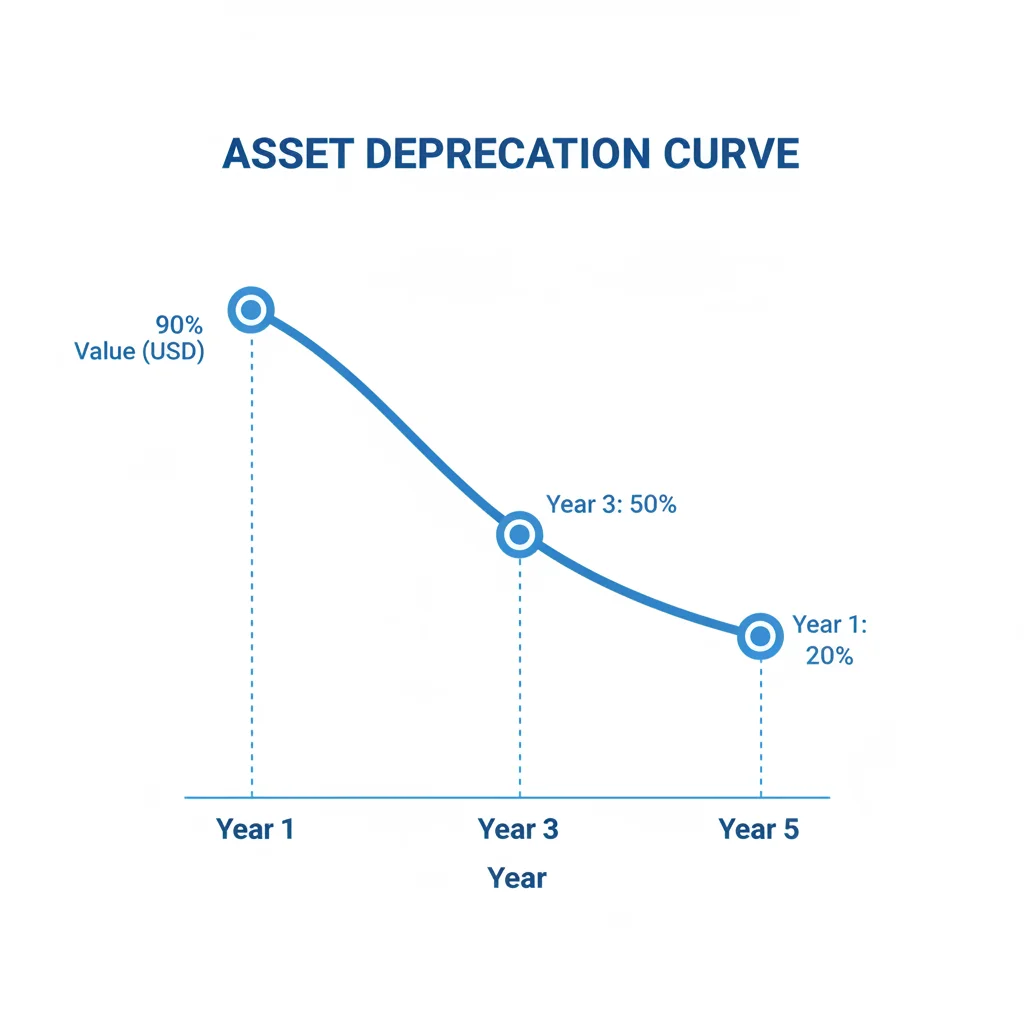
The trajectory of value loss over a vehicle's life. Most vehicles lose value fastest in years one through three, then the rate of loss slows. The shape and steepness of this curve differ by segment.
Segment benchmark
A statistically derived average retention rate for a category of vehicles (e.g., midsize SUVs) at a given age. Used as a reference point when no model-specific data is available.
Private-party value
The estimated price a vehicle would sell for in a direct transaction between two private individuals, as opposed to a dealer trade-in offer. This is the relevant figure when you're selling your car yourself.
Trade-in value
The amount a dealer offers to subtract from the price of a new purchase in exchange for your current vehicle. Trade-in values are typically 10–20% lower than private-party values.
These are averages across a segment, not guarantees for any specific make or model. Variables like trim level, mileage, condition, color, regional demand, and option packages all shift a car's individual depreciation curve. A well-maintained, low-mileage example can outperform the benchmark by 5–10 percentage points; a high-mileage, accident-history vehicle may fall 10–15 points below it.
These Are Starting Points, Not Appraisals
Category benchmarks represent statistical averages across thousands of transactions. They are not appraisals of your specific vehicle. Always cross-reference with at least two valuation tools (KBB, Edmunds, or NADA) and check active local listings for vehicles that closely match yours in trim, mileage, and condition. The benchmark gets you in the right neighborhood; local market data gets you to the right street.
EV Benchmarks Are Evolving Rapidly
The electric vehicle depreciation numbers in this article reflect recent transaction trends but are more subject to change than other segments. Federal tax credit eligibility changes, new model introductions, battery technology updates, and manufacturer price cuts can all shift EV residual values significantly within a single model year. If you're pricing an EV, check valuation tools and EV-specific forums for the most current comps.
Luxury Vehicles Often Fall Below Segment Average
Within each category, luxury and near-luxury variants typically depreciate faster than mainstream versions due to higher ownership costs, more complex electronics, and smaller pools of qualified used-car buyers. A luxury SUV from a German brand may perform 8–12 percentage points below the general SUV benchmark shown here. Budget for this when setting expectations.
The benchmarks assume average annual mileage of 12,000–15,000 miles and a clean Carfax history. If your vehicle falls outside those parameters, adjust your pricing expectations accordingly before comparing to these figures.
Benchmark by Category: The Numbers
Sedans (Compact and Midsize)
Sedans have faced a tough market over the past decade as buyers migrated toward SUVs and crossovers. That demand shift has pushed sedan depreciation deeper and faster than most other categories.
- Year 1: 73–78% of MSRP retained
- Year 3: 52–58% of MSRP retained
- Year 5: 38–45% of MSRP retained
In practical terms, a $28,000 compact sedan purchased new is likely worth around $10,900–$12,600 five years later — a loss of roughly $15,400–$17,100. Luxury sedans from German brands often depreciate even faster, dropping to 35–42% of MSRP at year 5. Japanese nameplate sedans (Toyota Camry, Honda Accord) tend to hold value better than the segment average, often landing at the top of the 45% range.
See how sedans compare against the other segments in detail at Depreciation by Vehicle Segment.
SUVs and Crossovers
This is the largest and most internally diverse segment. Compact crossovers and full-size body-on-frame SUVs behave quite differently, but overall the category holds value better than sedans.
- Year 1: 78–83% of MSRP retained
- Year 3: 60–67% of MSRP retained
- Year 5: 47–56% of MSRP retained
A $38,000 midsize SUV is worth roughly $17,900–$21,300 at the five-year mark. Three-row family SUVs and body-on-frame models like the Toyota 4Runner consistently outperform this benchmark. Compact crossovers from mass-market brands track near the middle of the range.
Pickup Trucks
Full-size pickup trucks are the strongest-holding segment in the American market, driven by sustained commercial and consumer demand and limited supply discounting at dealers.
- Year 1: 82–88% of MSRP retained
- Year 3: 67–74% of MSRP retained
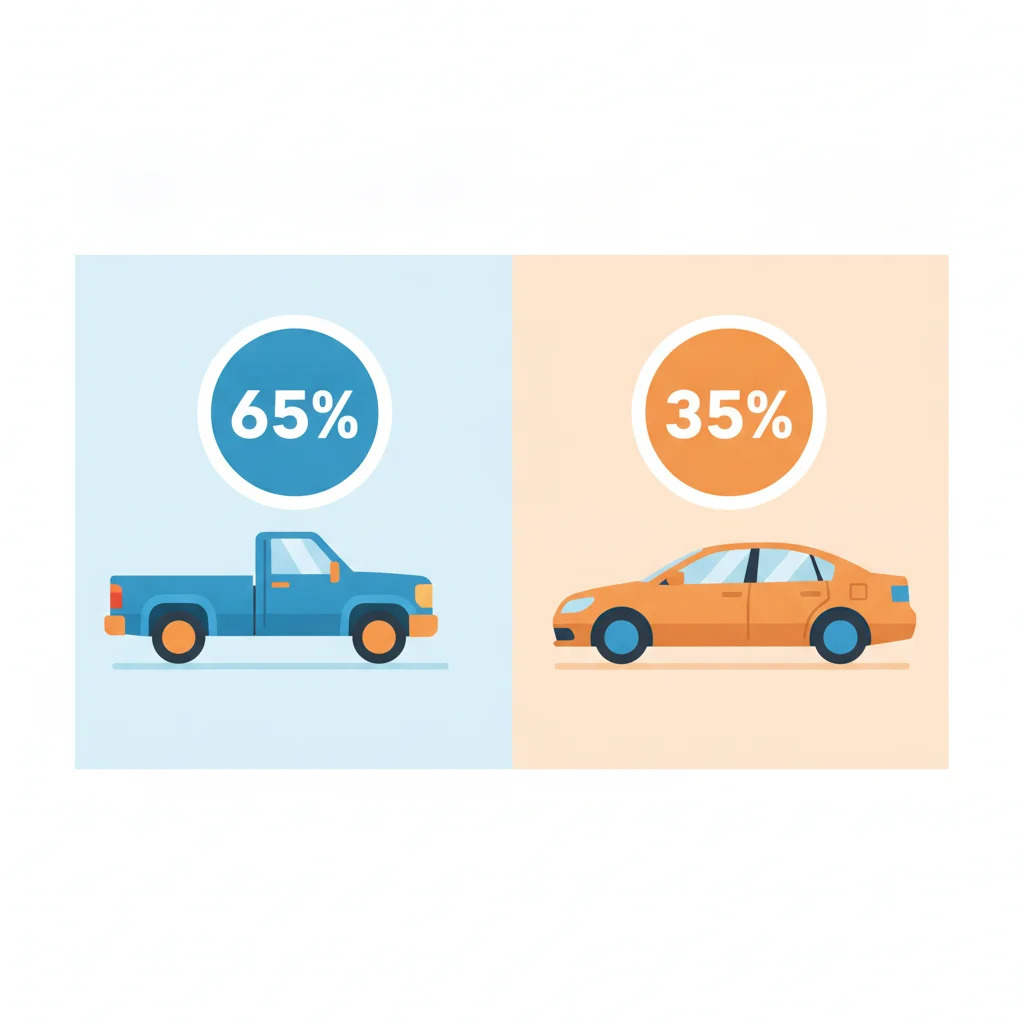
- Year 5: 55–65% of MSRP retained
A $55,000 half-ton truck could still be worth $30,250–$35,750 after five years. Diesel-equipped trucks, 4WD configurations, and crew-cab formats all push toward the top of this range. Midsize trucks (Tacoma, Ridgeline, Ranger) vary more widely — the Toyota Tacoma is a standout at the high end, while others trend closer to the SUV benchmark.
See which used-car segments hold value and which don't if you're also thinking about this from a buyer's perspective.
Sports and Performance Cars
Sports cars are the most bimodal segment — mainstream sports coupes depreciate quickly while iconic or low-production performance vehicles can actually appreciate. The benchmarks below cover mainstream production sports cars.
- Year 1: 68–76% of MSRP retained
- Year 3: 50–60% of MSRP retained
- Year 5: 38–50% of MSRP retained
A $45,000 sports coupe might be worth $17,100–$22,500 after five years. Niche or halo models (Porsche 911, certain Corvette configurations) can behave entirely differently and frequently hold above 70% even at year five. High insurance and maintenance costs also suppress demand for high-depreciation sports cars, which compounds value loss in the secondary market.
Electric Vehicles
EV depreciation is the most volatile and rapidly evolving segment. Early non-Tesla EVs depreciated aggressively — sometimes losing 50% in the first two years — but newer models from established brands are stabilizing closer to SUV benchmark territory as range improves and buyer confidence grows.
- Year 1: 68–80% of MSRP retained (wide range reflects brand/model variance)
- Year 3: 52–65% of MSRP retained
- Year 5: 38–55% of MSRP retained
Tesla models have historically held value far better than legacy OEM EVs, often performing more like pickup trucks in retention. However, Tesla's own price cuts have introduced new complexity — a used Tesla faces competition from cheaper new Teslas, which can push used values down sharply after an MSRP reduction. For a full breakdown of how EV-specific factors affect value, read Electric Vehicles and Depreciation: A Different Set of Rules.
You can also explore how EV depreciation differs from gas-powered cars for a side-by-side comparison of the mechanics involved.
49%
Average value retained by SUVs at year 5
Midpoint of the 47–56% benchmark range for compact and midsize SUVs under average mileage conditions.
60%
Value retained by full-size trucks at year 3
Full-size pickup trucks outperform all other segments at the three-year mark, averaging 67–74% retained.
~$17,000
Typical 5-year value loss on a $28,000 sedan
Based on a 38–45% retention benchmark for mainstream compact and midsize sedans.
15–25%
Accident history price discount
Vehicles with a single accident on record typically sell for 10–25% less than clean-history equivalents, depending on segment.
~$33K
Typical retained value on a $55K truck after 5 years
Using the 55–65% benchmark for full-size half-ton trucks with average mileage and clean history.
What Shifts a Vehicle Above or Below Its Category Benchmark
The category benchmarks above give you a starting point, but four key variables will move your specific vehicle's value up or down relative to those averages.
Mileage vs. Age
Depreciation has two independent tracks: time-based and mileage-based. The benchmarks above assume 12,000–15,000 miles per year. A five-year-old truck with 45,000 miles will fetch noticeably more than one with 90,000 miles — often 8–14% more in absolute value. Conversely, a low-age but high-mileage vehicle (think: a two-year-old car used for rideshare) may already be priced like a four-year-old example.
Ownership Cost Profile
Segments with high ongoing ownership costs — luxury German sedans, exotic sports cars, some early EVs — depreciate faster partly because the used-car buyer is pricing in those future costs. A buyer purchasing a three-year-old luxury sedan knows they'll face expensive scheduled maintenance; they discount the purchase price accordingly. Trucks and reliable Japanese models carry lower assumed ownership cost risk, which supports residual values.
Regional Demand
A pickup truck is worth more in Texas than in New York City. A convertible holds value better in California or Florida than in Minnesota. Regional supply-demand imbalances can shift a vehicle's effective value by 5–12% relative to national averages. If you're using a national valuation tool, look for regional adjustments or check local listings to calibrate.
Condition and History
Clean title, no accidents, dealer-maintained service records, and original paint all carry measurable premiums. A vehicle with a single accident on its Carfax typically sells for 10–25% less than a clean-history equivalent, depending on the severity and segment. For pricing guidance on how down payments and purchase price interact with depreciation, see down payment benchmarks by vehicle price range.

Using These Benchmarks to Set Your Asking Price
Here's a practical four-step workflow for turning category benchmarks into a defensible listing price:
- Find your category benchmark. Identify which segment your vehicle falls into — sedan, SUV/crossover, truck, sports car, or EV — and note the retained-value percentage for your vehicle's current age.
- Apply the benchmark to your original MSRP. If you don't remember the sticker price, look it up on your original purchase contract or search the model year's base MSRP online. Multiply that by the benchmark retention percentage to get a rough market midpoint.
- Adjust for your vehicle's specifics. Add 3–8% for low mileage (under 10,000/year), clean title, and complete service records. Subtract 5–15% for high mileage, accident history, or high-demand missing options (like 4WD on a truck).
- Cross-reference with valuation tools. Run your adjusted figure against at least two valuation sources — KBB private-party value and Edmunds True Market Value are the most widely used. If your adjusted benchmark and the tool outputs are within 5–8% of each other, you have a solid anchor. If they diverge by more, dig into why before listing.
Remember that valuation tools themselves use recent transaction data that lags the market by 4–8 weeks. In rapidly moving markets (post-pandemic used car spikes, or sudden fuel price shifts that boost truck or EV demand), the benchmark math may actually be more current than a tool's published output.
For a comprehensive look at depreciation factors beyond category, visit the Depreciation Basics hub which covers the full lifecycle of vehicle value loss.
Kelley Blue Book (KBB) Private-Party Value Tool
Enter your vehicle's year, make, model, trim, mileage, and condition to get a private-party value estimate. Use alongside the category benchmarks in this article to validate your asking price.
Edmunds True Market Value (TMV)
Edmunds TMV uses recent local transaction data to estimate what vehicles are actually selling for in your area — not just what sellers are asking. Useful for detecting regional price premiums or discounts.
Vehicle Depreciation: The Complete Owner's Reference
A comprehensive guide covering depreciation formulas, segment-by-segment comparisons, and all the factors that influence how fast your vehicle loses value. Essential reading for any seller wanting to go deeper.
NADA Guides
The National Automobile Dealers Association publishes used-car values widely used by dealers and lenders. NADA values tend to skew slightly higher than KBB and can be useful as an upper-bound reference.
Depreciation Basics Hub
A structured resource hub covering how vehicles lose value over time, what factors accelerate or slow depreciation, and how to apply this knowledge as both a buyer and a seller.

All claims are backed by peer-reviewed research. Sources on request.