| What SoC measures | Current charge level as a % of current max capacity |
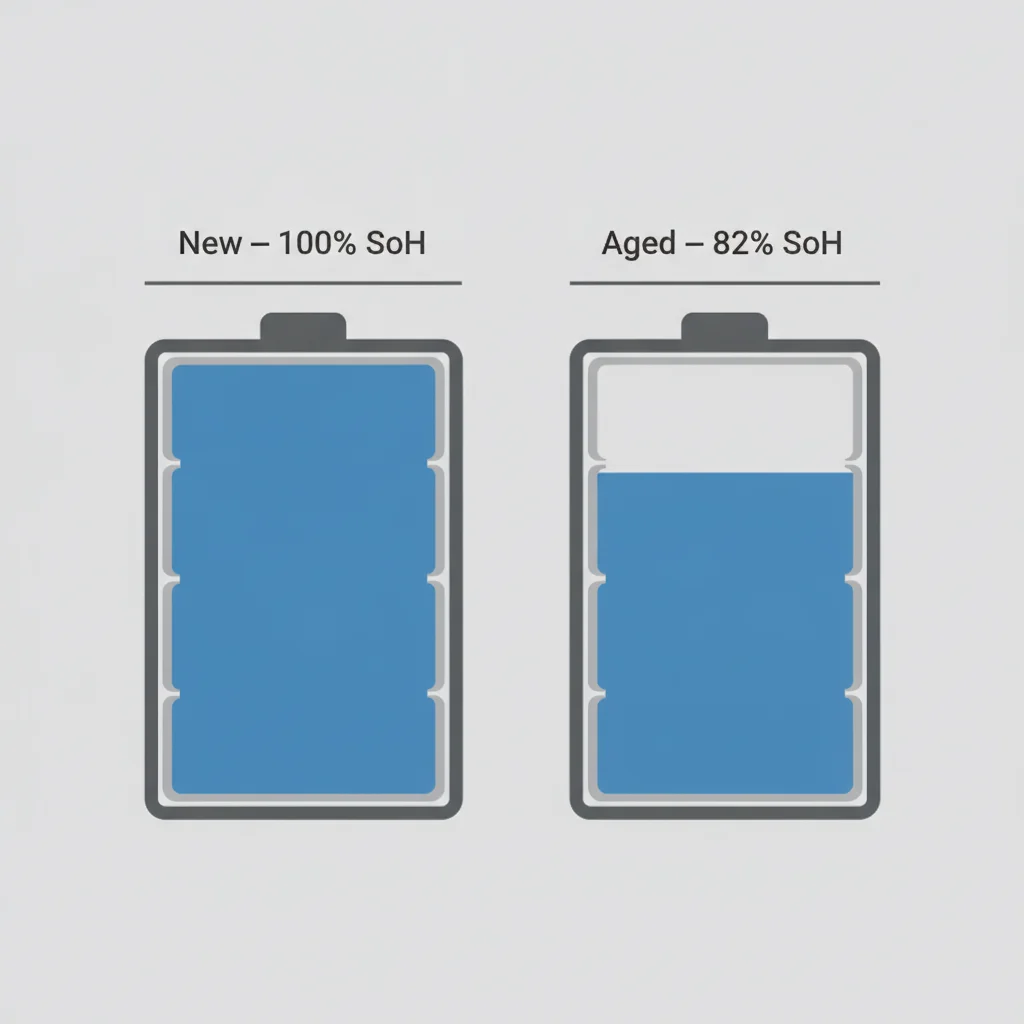
| What SoH measures | Remaining original capacity as a % (starts at 100%) |
| Recommended daily SoC range | 20% – 80% (Standard guidance from most EV manufacturers) |
| Typical SoH after 100,000 miles | 85–90% for most modern packs (Aggregated fleet data, various EV research groups) |
| Common warranty SoH floor | 70% over 8 years / 100,000 miles (Varies by manufacturer; check your specific warranty) |
| SoH access cost (third-party) | $20–$40 OBD2 dongle + free/low-cost app |
| Independent battery inspection cost | $100–$200 at EV-specialist shops (Typical U.S. market range, 2024) |
| Primary SoH degradation drivers | Heat, high SoC storage, rapid charging, deep discharges |
Why These Two Numbers Matter
If you own or are shopping for an electric vehicle, you'll encounter two battery metrics more than any other: State of Charge (SoC) and State of Health (SoH). They sound similar, but they answer completely different questions — and confusing them is one of the most common mistakes both new EV owners and used-car buyers make.
SoC tells you how full your battery is right now, the way a fuel gauge works in a gas car. SoH tells you how much of the battery's original capacity still remains after weeks, months, or years of use. One is a daily operational number; the other is a long-term measure of degradation.
Understanding both — and knowing where to find them on your specific vehicle — helps you charge smarter, maintain range over time, and evaluate used EVs without getting burned. This reference breaks both metrics down in plain language, explains how each is measured, and tells you what ranges to expect over a realistic ownership period.
| What SoC measures | Current charge level as a % of current max capacity |
| What SoH measures | Remaining original capacity as a % (starts at 100%) |
| Recommended daily SoC range | 20% – 80% (Standard guidance from most EV manufacturers) |
| Typical SoH after 100,000 miles | 85–90% for most modern packs (Aggregated fleet data, various EV research groups) |
| Common warranty SoH floor | 70% over 8 years / 100,000 miles (Varies by manufacturer; check your specific warranty) |
| SoH access cost (third-party) | $20–$40 OBD2 dongle + free/low-cost app |
| Independent battery inspection cost | $100–$200 at EV-specialist shops (Typical U.S. market range, 2024) |
| Primary SoH degradation drivers | Heat, high SoC storage, rapid charging, deep discharges |
State of Charge (SoC): Your Real-Time Fuel Gauge
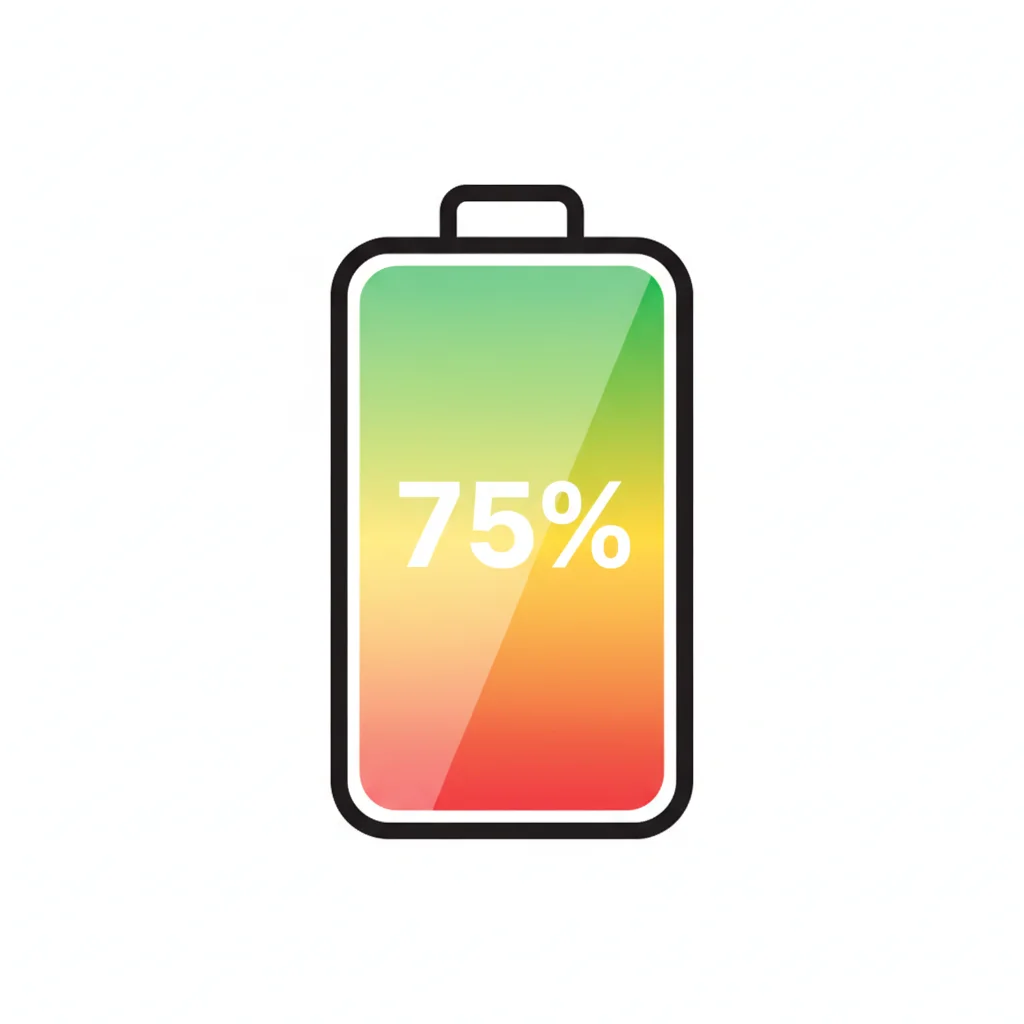
State of Charge is expressed as a percentage from 0% to 100% and represents how much energy is currently stored in your battery pack relative to its current maximum capacity. The key phrase is current maximum — because as a battery degrades over time, the absolute energy stored at "100%" SoC is gradually less than it was when the vehicle was new.
How SoC Is Calculated
Your battery management system (BMS) estimates SoC using a combination of:
- Voltage monitoring: Cell voltage correlates with charge level, though the relationship is non-linear and varies with temperature.
- Coulomb counting: The BMS tracks current flowing in and out of the pack over time to estimate energy consumed or added.
- Temperature compensation: Cold batteries temporarily report lower SoC because lithium-ion cells perform less efficiently at low temperatures.
This is why your displayed range can jump up or down based on ambient temperature, recent driving style, or even elevation — the BMS is continuously recalculating based on real-world conditions, not just a static percentage.
Practical SoC Targets
Most automakers and charging experts recommend keeping daily SoC between 20% and 80% for routine use. Staying in that middle zone reduces electrochemical stress on the cells. Full charges to 100% are fine occasionally — for long trips, for instance — but habitual overnight charging to 100% accelerates degradation faster than most drivers realize. See why 100% isn't always the right target for a deeper look at daily charge strategy.
SoC also directly controls how fast a DC fast charger can push energy into your pack. Charging is fastest from around 20% to 80%; above 80%, the BMS deliberately tapers the charge rate to protect the cells. If you're planning a road trip, understanding how SoC affects fast charging speed can save significant time at public stations.
Temperature Affects Your SoC Reading
In cold weather, your displayed range and apparent SoC can drop significantly even if you haven't driven anywhere. This is a temporary effect — lithium-ion cells deliver less power when cold, causing the BMS to report conservatively. Once the pack warms up through driving or preconditioning, range typically recovers. This is not battery degradation; it's normal electrochemistry.
SoH Isn't Always Displayed Directly
Many EVs don't show SoH as a percentage on the dashboard — instead, they may show remaining pack capacity in kWh, or nothing at all without a third-party tool. Don't assume a clean-looking dash means a healthy battery. On a used EV, always request a diagnostic report or have the pack independently evaluated before finalizing a purchase.
State of Health (SoH): The Long-Term Capacity Score
State of Health measures how much of your battery's original total capacity is still usable today. It's also expressed as a percentage — a brand-new pack starts at 100% SoH — but unlike SoC, it only changes over weeks and months as the battery ages.
What Degrades a Battery Pack
Lithium-ion degradation is driven by several overlapping mechanisms:
- Cycle aging: Every charge-discharge cycle causes microscopic physical changes in the electrodes. More cycles equal more degradation, though modern packs are engineered to last hundreds of cycles before meaningful capacity loss.
- Calendar aging: Batteries degrade simply from existing, even when not in use. High SoC combined with high temperatures accelerates calendar aging significantly.
- Thermal stress: Repeated DC fast charging generates heat. Packs without active liquid cooling (rare on modern EVs but present on some older models) degrade faster under heavy fast-charge use.
- Deep discharges: Frequently running the battery to near 0% strains cell chemistry more than partial discharges.
Realistic SoH Expectations
Real-world data from high-volume EV fleets suggests that most modern lithium-ion packs retain 85–90% SoH after 100,000 miles of typical driving. Some vehicles, particularly those with well-engineered thermal management systems, do better than that. Degradation is not linear — it's typically steeper in the first year or two, then levels off.
Many automakers now provide battery capacity warranties that guarantee a minimum SoH threshold — commonly 70% over 8 years or 100,000 miles, though the specific floor varies by manufacturer. If your battery drops below that threshold within the warranty period, the manufacturer is obligated to repair or replace the affected modules.
85–90%
Average SoH retained at 100,000 miles
Based on aggregated real-world fleet data from multiple EV research groups and owner communities tracking degradation across major brands.
70%
Minimum SoH covered by most battery warranties
Many major automakers guarantee battery capacity won't fall below 70% within the warranty period, typically 8 years or 100,000 miles.
~2–3%
Average annual SoH degradation, modern EVs
Degradation is front-loaded; most packs lose slightly more in year one, then stabilize. Actual rate depends heavily on charging habits and climate.
20%–80%
Optimal daily SoC range for cell longevity
Keeping charge in this window reduces electrochemical stress and is the single most impactful habit for preserving long-term battery capacity.
When evaluating a used EV, SoH is the single most important battery number to request. A vehicle showing 78% SoH at 60,000 miles is aging faster than average and should prompt either a price negotiation or a decision to walk away. Check out what to look for in an EV's battery specs before you buy for the complete pre-purchase evaluation checklist.
State of Charge (SoC)
The current energy level in a battery pack expressed as a percentage of its present maximum capacity. It functions like a fuel gauge, showing how much charge is available right now.
State of Health (SoH)
A measure of how much of a battery's original total capacity remains usable, expressed as a percentage starting at 100% when new. It declines gradually over time as the pack ages.
Battery Management System (BMS)
The onboard electronic system that monitors, protects, and controls the battery pack. It manages cell balancing, temperature, charge rates, and calculates SoC and SoH estimates.
Cycle Aging
Degradation that occurs as a result of charge and discharge cycles. Each cycle causes microscopic physical and chemical changes in the battery electrodes that cumulatively reduce capacity.
Calendar Aging
Battery degradation that occurs over time regardless of use. It is accelerated when the battery is stored at a high state of charge in high ambient temperatures.
Coulomb Counting
A method the BMS uses to estimate SoC by tracking the electrical current flowing into and out of the battery over time, essentially accounting for every unit of charge added or removed.
Usable Capacity
The portion of a battery's total energy storage that the vehicle is designed to actually use. Automakers typically reserve a buffer at both ends of the pack to protect cell longevity.
OBD2 Port
A standardized diagnostic connector found in most vehicles, including EVs, that allows external devices to read vehicle data including battery metrics when paired with compatible software.
How to Find SoC and SoH on Your Vehicle
SoC is easy — every EV displays it prominently on the instrument cluster and in the companion app. SoH is harder to access and varies significantly by brand.
Built-In Tools by Brand
| Brand | SoH Access Method | Notes |
|---|---|---|
| Tesla | In-app battery report (select models/regions) | Third-party apps like Tessie provide more detailed history |
| Chevrolet (Bolt) | Energy app on infotainment screen | Shows remaining pack capacity in kWh |
| Hyundai/Kia | Available via OBD2 diagnostic port + apps | Some models show pack health in dealer diagnostics |
| Nissan (Leaf) | Leaf Spy app via OBD2 dongle | Also shows individual bar capacity indicators on dash |
| BMW | My BMW app + High Voltage Battery Report | Accessible after requesting from app or service center |
| Ford (Mustang Mach-E / F-150 Lightning) | FordPass app | Battery health estimate shown in vehicle status |
Third-Party OBD2 Apps
For vehicles that don't surface SoH natively, an OBD2 Bluetooth dongle (typically $20–$40) paired with an app like Car Scanner, Leaf Spy, or brand-specific equivalents can pull raw battery data directly from the BMS. This gives you actual pack capacity in kWh alongside the estimated SoH percentage. Keep in mind that reading accuracy depends on the app's support for your specific vehicle protocol.
For a pre-purchase inspection on a used EV, many independent EV-specialist shops can run a full battery diagnostic for $100–$200 — money well spent on a vehicle where the battery pack is the single most expensive replaceable component.
Using SoC and SoH Together to Make Better Decisions
The real power of understanding both metrics is in how they interact. SoC operates within the envelope defined by SoH. If your pack has degraded to 85% SoH, then even at 100% SoC, you only have 85% of the original energy available. That's why a used EV with a degraded battery won't give you the EPA-rated range no matter how carefully you charge it — the ceiling has dropped.
For Daily Owners
- Use SoC as your daily operational guide. Keep it between 20–80% for routine trips; charge to 100% only when you need full range.
- Monitor SoH annually to catch unusual degradation early. A significant drop in SoH between annual checks — say, more than 3–4% in a single year — can indicate a problem worth investigating under warranty.
- Avoid letting SoC sit at high levels in hot environments for extended periods. Parking a fully charged EV in a 100°F lot all day is one of the fastest ways to accelerate calendar aging.
For Used EV Buyers
- Always ask for a SoH reading before agreeing on a price. Request dealer diagnostic data or pay for an independent inspection.
- Factor remaining warranty coverage into any SoH-based negotiation. A 75% SoH vehicle still within the manufacturer's 70% warranty floor is materially different from one that's post-warranty.
- Cross-reference SoH with mileage and charging history when available. High mileage with high SoH suggests good battery management habits by the previous owner.
Building good habits early pays dividends over the full ownership period. The habits that preserve long-term EV battery capacity are well-documented and most of them cost nothing — they're just changes to how and when you charge. For the broader picture of what routine EV ownership requires, the EV Maintenance Basics hub is a solid starting point.
Looking further ahead, battery chemistry itself is evolving. Solid-state batteries vs. today's lithium-ion packs explores how next-generation technology could change degradation patterns and what it means for the EVs you'll be buying in the next decade.

Recurrent Auto Battery Reports
Recurrent tracks real-world battery degradation data across thousands of EVs in the U.S. fleet. Their free battery reports for specific used EV listings are one of the most useful pre-purchase tools available to buyers.
Leaf Spy (Nissan Leaf)
A widely used OBD2-based app that reads detailed battery data from Nissan Leaf vehicles, including SoH percentage and individual cell readings. Requires an inexpensive OBD2 Bluetooth adapter.
Car Scanner ELM OBD2
A cross-platform OBD2 diagnostic app that supports a broad range of EVs and can pull battery capacity and health data from vehicles that don't surface it natively in the infotainment system.
EV Battery Health: Habits That Preserve Long-Term Capacity
A practical guide covering the specific charging and driving behaviors that slow battery degradation, based on what the data actually shows about long-term pack performance.
EV Maintenance Basics Hub
A comprehensive overview of what routine EV ownership requires, how maintenance differs from gas vehicles, and what costs to expect over a typical ownership period.

All claims are backed by peer-reviewed research. Sources on request.