Key Takeaways
Charge Curve
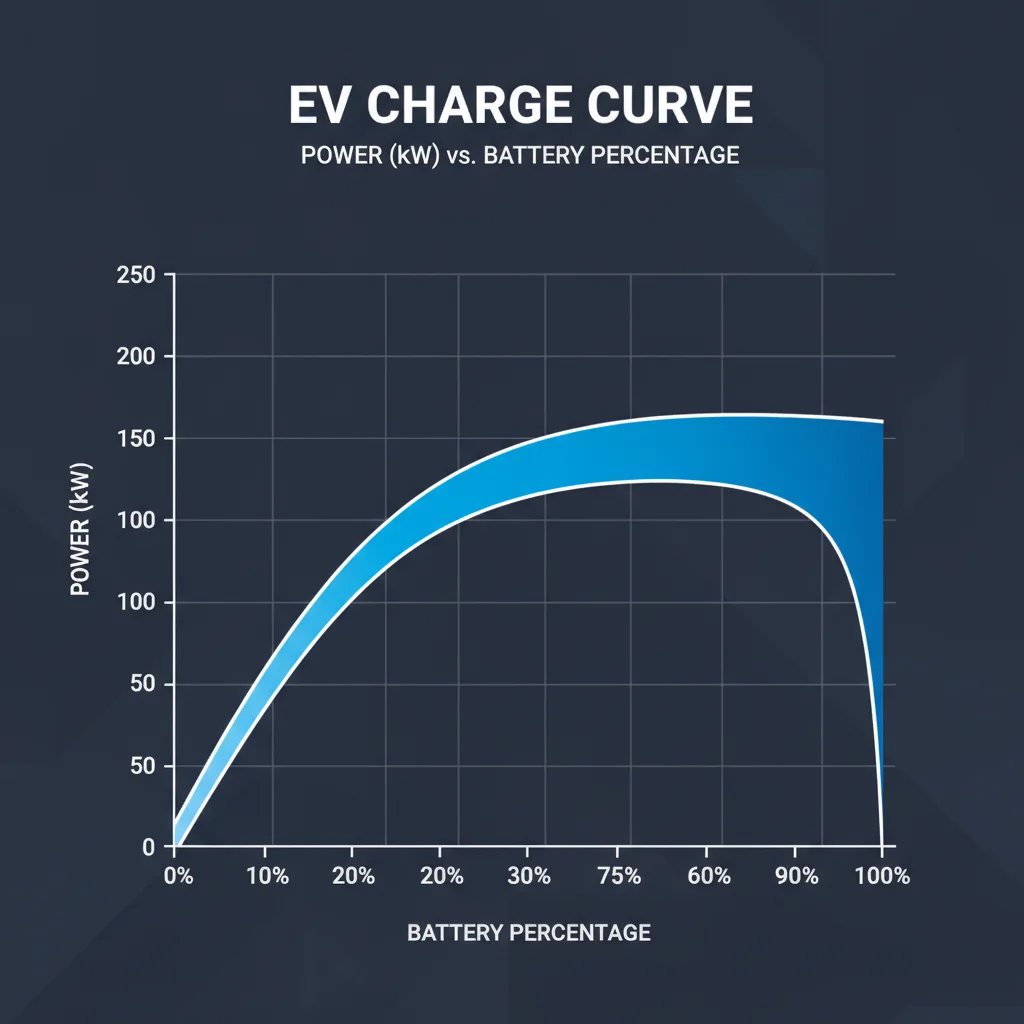
A charge curve is the graph of how fast your EV accepts electricity at a DC fast charger as the battery fills up. Charging speed — measured in kilowatts — typically starts high, holds steady for a while, then tapers off sharply as the battery approaches full. This behavior is built into every lithium-ion battery pack and is managed by the car's battery management system.
The taper occurs because lithium-ion cells require lower current density at high states of charge to prevent lithium plating and thermal stress, which would accelerate long-term degradation.
The Charging Speed Illusion: Why the Number on the Stall Doesn't Tell the Full Story
Walk up to a DC fast charger at a highway rest stop and you'll see a rating — 150 kW, 250 kW, 350 kW. Those numbers reflect the charger's ceiling, not what your car will actually use. The real determinant of how quickly electrons flow into your battery pack is something far more dynamic: your battery's current state of charge, commonly abbreviated as SoC.
Understanding this relationship is one of the most practical pieces of knowledge an EV driver can have. It explains why your first 10 minutes at a fast charger feel blazingly quick, why the last 20% seems to crawl, and why the driver next to you — with a lower-rated car — might be unplugging and leaving before you despite arriving at the same time.
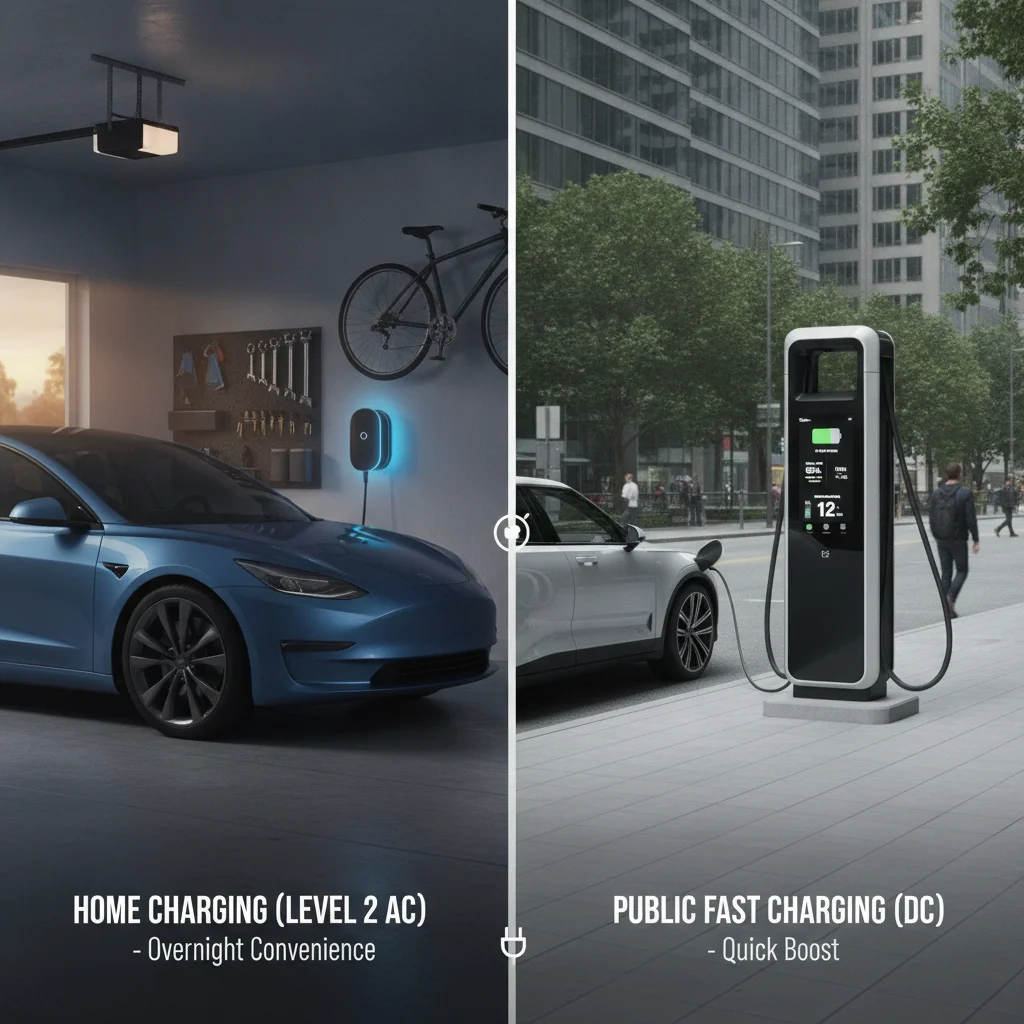
For a solid grounding in the different types of charging hardware and why DC fast charging works differently from home charging, see AC vs. DC Charging explained. This article builds on that foundation to explain what happens inside the charge session itself, from plug-in to departure.
What the Charge Curve Actually Looks Like
Plot charging power (in kW) on the vertical axis and battery state of charge (0–100%) on the horizontal, and you get a characteristic shape that EV engineers call the charge curve. While every vehicle's curve is unique, virtually all lithium-ion battery packs follow the same three-phase pattern:
- Ramp-up phase (0–10% SoC): At a very low state of charge, the battery management system (BMS) brings power up gradually to avoid shocking cold or deeply discharged cells. This phase is brief — usually just a couple of minutes.
- Constant power phase (roughly 10–80% SoC): This is where most of the useful energy transfer happens. The BMS allows full or near-full rated power, and charging is at its fastest. Some vehicles hold this plateau for the entire 10–80% window; others show a gentle decline beginning around 50–60%.
- Taper phase (80–100% SoC): Power drops steeply. By 90%, many EVs are accepting only 30–50% of their peak rated power. By 95%, the rate is often barely faster than a Level 2 charger. This taper is intentional and irreversible at the chemical level — it is how lithium-ion cells must be treated to remain healthy.
“The charge curve is the single most important specification EV buyers aren't comparing. Peak kilowatts sell cars; the shape of the curve determines how long you actually stand at the charger.”
— Britta Gross, Director of Transportation Electrification, Rocky Mountain Institute
The practical takeaway is stark: the first 80% of your charge is delivered far faster than the last 20%. On many popular EVs, adding the final 20 percentage points takes as long as adding the first 60.
~50%
Typical power drop above 80% SoC
Real-world charge session data from multiple EV models shows charging rates frequently fall to 40–60% of peak power once the battery passes 80% state of charge.
18 min
IONIQ 6 time from 10% to 80% SoC
Hyundai's 800-volt architecture in the IONIQ 6 enables industry-leading 10–80% charge times of approximately 18 minutes at a 350 kW-capable charger.
30–50%
Peak charge rate reduction in cold weather
Testing by EV consumer organizations shows DC fast charge rates can drop 30–50% when battery pack temperature is below approximately 50°F without preconditioning.
~20 min
Time wasted charging from 80% to 100%
For many midrange EVs, delivering the final 15 kWh from 80–100% SoC takes 18–25 minutes due to taper — the same time needed to add 40–50 kWh in the efficient window.
800V
Voltage architecture that sustains peak rates longest
800-volt platform vehicles (Hyundai IONIQ 5/6, Kia EV6, Porsche Taycan) maintain near-peak DC fast charge rates to higher states of charge compared to 400V alternatives.
The Chemistry Behind the Taper
To understand why the BMS throttles power above 80%, you need a basic picture of what's happening at the cell level. Lithium-ion cells work by shuttling lithium ions between a graphite anode and a cathode material (typically NMC, LFP, or NCA chemistry, depending on the manufacturer). During charging, ions migrate from the cathode to the anode.
When the anode is mostly empty — low SoC — there are abundant vacant sites for lithium ions to settle into. High current can be pushed safely because ions are absorbed quickly and evenly. As the anode fills, available intercalation sites become scarce. If current remains high, ions arrive faster than they can be absorbed. They begin to deposit as metallic lithium on the anode surface, a process called lithium plating. Plated lithium doesn't participate in future charge cycles, permanently reducing usable capacity. In severe cases, it forms dendrites — needle-like structures that can pierce the separator and cause a short circuit.
High cell temperature compounds the risk. Heat itself accelerates chemical degradation, which is why the BMS also monitors pack temperature and will throttle power if the battery gets too warm during a fast charge session — independent of state of charge.
LFP Batteries Behave Somewhat Differently
Lithium iron phosphate (LFP) batteries — used in the standard-range Tesla Model 3 and some other base-trim EVs — have a flatter charge curve that extends closer to 90–95% before tapering significantly. LFP chemistry is also more tolerant of regular 100% charging than NMC cells. If your car uses an LFP pack, check the manufacturer's specific guidance, as the 80% ceiling advice applies primarily to NMC and NCA chemistry packs.
Shared Charging Stalls Can Reduce Available Power
Many DC fast charging stations share a power cabinet between two adjacent stalls. If both are occupied simultaneously, total available power is split between the two vehicles — sometimes unevenly, based on each car's current demand. Arriving at a busy charger during the taper phase of your session while a neighbor plugs in at low SoC can reduce your already-low charge rate further. Choosing an unoccupied paired stall when possible avoids this.
Software Updates Can Change Your Charge Curve
Automakers push over-the-air updates that occasionally modify charge curve behavior — sometimes improving peak rates, sometimes adding new throttling to protect aging packs. Tesla, Hyundai, and others have used OTA updates to meaningfully alter charging performance after purchase. Keeping your vehicle's software current ensures you're benefiting from the latest charge curve optimization for your specific battery configuration.
This is also why tracking both state of charge and state of health matters for long-term ownership. Repeated high-SoC DC fast charging doesn't just slow down your session today — it incrementally reduces the capacity available for every future session.
Real-World Charge Curves: How Different EVs Compare
Charge curves vary significantly between vehicles, and knowing your car's specific profile is genuinely useful trip-planning information. A few illustrative patterns from well-known models:
| Vehicle | Peak DC Fast Charge Rate | Where Taper Begins | Time 10–80% (est.) |
|---|---|---|---|
| Tesla Model 3 Long Range (V3 Supercharger) | ~250 kW | ~50–55% SoC | ~25 min |
| Hyundai IONIQ 6 (800V) | ~233 kW | ~75–80% SoC | ~18 min |
| Ford Mustang Mach-E (400V) | ~150 kW | ~55% SoC | ~38 min |
| Chevy Equinox EV | ~150 kW | ~60% SoC | ~35 min |
| Nissan LEAF (50 kW CHAdeMO) | ~50 kW | ~80% SoC | ~40 min |
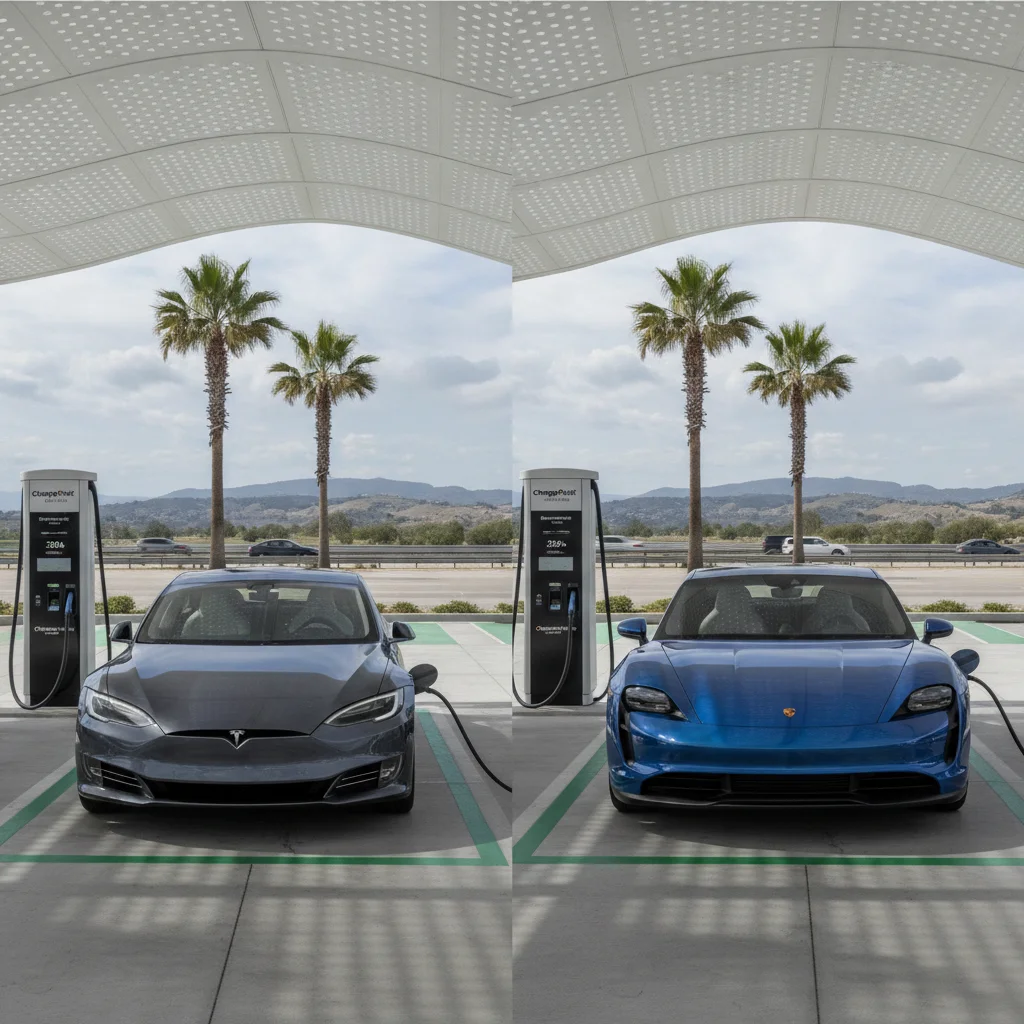
Two things stand out in this comparison. First, 800-volt architecture vehicles like the IONIQ 6 maintain high power deeper into the charge cycle — partly a chemistry advantage, partly a thermal one, since 800V systems pass lower current for the same power, generating less heat. Second, peak kilowatt ratings can be misleading: a car that holds 150 kW all the way to 75% SoC may complete a practical road trip charge faster than a car rated for 250 kW that tapers steeply at 50%.
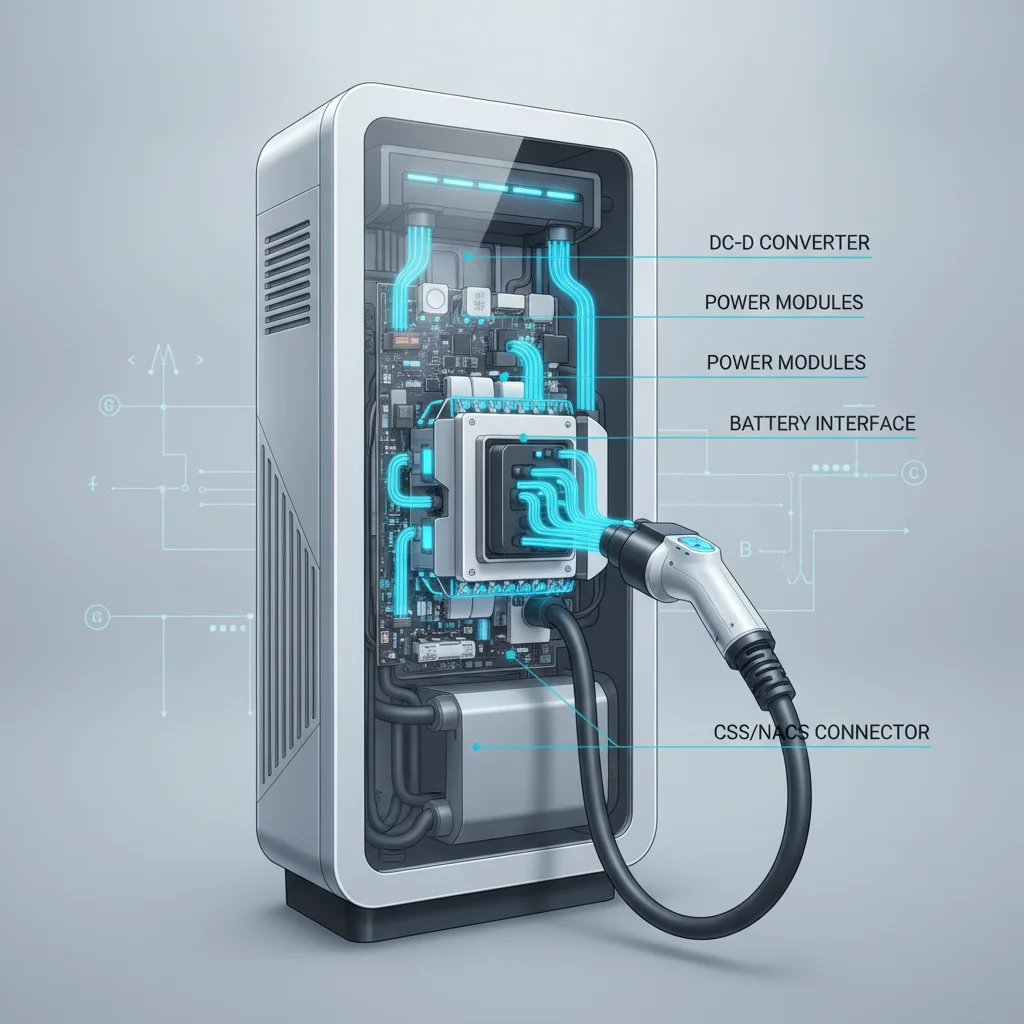
For a detailed look at how the hardware inside the charger itself enables these speeds, DC fast charging explained covers the inverter, rectifier, and power electronics involved.
Look Up Your Car's Charge Curve Before Your Next Trip
Sites like Fastned's charging database, Bjorn Nyland's YouTube charge tests, and Plug In America's model-specific data publish real-world charge curves for dozens of EVs. Knowing exactly where your model's taper begins lets you set a precise departure SoC target rather than relying on the generic 80% rule of thumb, which may leave time on the table or underestimate how long your stop will take.
Always Route Through Your Car's Native Navigation
Third-party map apps don't trigger battery preconditioning. Routing to a DC fast charger through your vehicle's built-in navigation — or Tesla's app for Supercharger trips — activates thermal management that warms the battery before arrival. On a cold day, this single habit can shave 10–15 minutes from a charging stop without changing any other behavior.
Target 10–20% Arrival, 70–80% Departure on Road Trips
This window keeps you squarely in the high-power flat portion of the charge curve on virtually every EV. If you're uncertain whether you'll make the next stop at 20%, add a few percentage points of buffer — but resist the temptation to charge to 90% or beyond unless route range genuinely demands it. The math almost always favors more frequent, shorter stops over fewer, longer ones.
Road Trip Planning Around the Charge Curve
Once you internalize the charge curve, road trip planning shifts from a question of "how long will charging take?" to "what SoC window should I target?" That reframe changes everything about how you space stops and estimate drive time.
The optimal window for most EVs is arriving at roughly 10–20% and departing at 70–80%. This keeps you entirely within the high-power portion of the charge curve, minimizes time spent waiting for the taper to deliver diminishing kilowatts, and still provides plenty of range to reach the next stop. Charging from 20% to 80% on a 75 kWh pack delivers about 45 kWh — often 150–200 miles of additional range, depending on conditions.
Compare that to sitting at the charger from 80% to 100%. On many vehicles, those final 20 percentage points add only 15 kWh of energy but take as long as 20–30 minutes because charging power has collapsed. Unless your route genuinely requires a full charge to reach the next stop, that time is almost always wasted.
Modern EV navigation systems — from Tesla's routing to built-in systems in vehicles like the Hyundai IONIQ 5 and Ford Mustang Mach-E — now incorporate charge curve data and route you to stops that keep you in the efficient window. When your car calculates a 25-minute charging stop, it's almost certainly not planning to take you to 100%.
For a cost-focused lens on these decisions, Level 1, Level 2, and DC fast charging costs compared breaks down price-per-kWh across all three charging levels, which matters when you're deciding whether to add that last 20% at a fast charger or wait for a hotel Level 2 outlet.
Battery Temperature: The Hidden Variable in Your Charge Speed
State of charge is the primary variable controlling fast charge speed, but temperature is the secondary one — and it can be just as impactful, especially in winter. A lithium-ion battery pack operating below 50°F sees significantly reduced ion mobility inside the cells, which limits how fast current can safely flow. Drive to a fast charger on a cold morning without first warming the battery, and you may find your car accepting only 30–50% of its rated peak — even at a low SoC that would normally yield maximum power.
The solution is battery preconditioning: the vehicle actively heats the pack using electrical energy before arriving at the charger. Most EVs with built-in navigation will trigger this automatically when you route to a DC fast charging stop. The energy cost of preconditioning is real — it draws from the battery — but the faster charge rate more than compensates in time savings.
Heat is the opposite problem in summer. After a long highway drive, the battery may arrive at the charger already warm. Most modern packs handle this well up to a point, but some older systems (notably certain Nissan LEAF configurations without active thermal management) will throttle power significantly after repeated fast charge sessions in hot weather to prevent thermal damage.
LFP Batteries Behave Somewhat Differently
Lithium iron phosphate (LFP) batteries — used in the standard-range Tesla Model 3 and some other base-trim EVs — have a flatter charge curve that extends closer to 90–95% before tapering significantly. LFP chemistry is also more tolerant of regular 100% charging than NMC cells. If your car uses an LFP pack, check the manufacturer's specific guidance, as the 80% ceiling advice applies primarily to NMC and NCA chemistry packs.
Shared Charging Stalls Can Reduce Available Power
Many DC fast charging stations share a power cabinet between two adjacent stalls. If both are occupied simultaneously, total available power is split between the two vehicles — sometimes unevenly, based on each car's current demand. Arriving at a busy charger during the taper phase of your session while a neighbor plugs in at low SoC can reduce your already-low charge rate further. Choosing an unoccupied paired stall when possible avoids this.
Software Updates Can Change Your Charge Curve
Automakers push over-the-air updates that occasionally modify charge curve behavior — sometimes improving peak rates, sometimes adding new throttling to protect aging packs. Tesla, Hyundai, and others have used OTA updates to meaningfully alter charging performance after purchase. Keeping your vehicle's software current ensures you're benefiting from the latest charge curve optimization for your specific battery configuration.
The lesson: on cold days, always route to a charger via your car's native navigation rather than a third-party app, so preconditioning activates. On hot days after extended highway driving, a brief pause before plugging in — or simply accepting that your first few minutes may be slower — is sometimes the pragmatic choice.
Long-Term Battery Health: What Charging Habits Actually Cost You
The charge curve isn't just about how long you wait at a rest stop. It's also a map of the stress you're placing on your battery pack. Every session spent pushing cells to 100% at high DC fast charge rates imposes incremental degradation. The combination of elevated cell voltage and elevated temperature during the taper phase creates conditions that accelerate electrolyte decomposition and cathode breakdown.
This doesn't mean you should never charge to 100% at a fast charger — sometimes range demands it. But keeping it as an exception rather than a habit makes a measurable difference over the life of a battery pack. Most automakers recommend that daily charging for commuting happen via Level 2 at home, targeted to 80%, with DC fast charging reserved for travel. That recommendation exists precisely because of charge curve dynamics and their long-term consequences.
For a deeper look at how charging habits intersect with long-term capacity, why 100% isn't always the right charging target explores the tradeoff between maximum daily range and long-term battery preservation. And if you're evaluating a used EV, understanding state of charge vs. state of health explains how to interpret the numbers you'll actually find on the vehicle's display.
The broader context for building smart charging habits — including home charging setup and cost comparison — is covered across the Charging Costs & Savings hub. If you're still setting up home charging, the Home Charging Setup hub walks through equipment selection and installation so your daily charging is handled before you ever pull into a public fast charger.
Look Up Your Car's Charge Curve Before Your Next Trip
Sites like Fastned's charging database, Bjorn Nyland's YouTube charge tests, and Plug In America's model-specific data publish real-world charge curves for dozens of EVs. Knowing exactly where your model's taper begins lets you set a precise departure SoC target rather than relying on the generic 80% rule of thumb, which may leave time on the table or underestimate how long your stop will take.
Always Route Through Your Car's Native Navigation
Third-party map apps don't trigger battery preconditioning. Routing to a DC fast charger through your vehicle's built-in navigation — or Tesla's app for Supercharger trips — activates thermal management that warms the battery before arrival. On a cold day, this single habit can shave 10–15 minutes from a charging stop without changing any other behavior.
Target 10–20% Arrival, 70–80% Departure on Road Trips
This window keeps you squarely in the high-power flat portion of the charge curve on virtually every EV. If you're uncertain whether you'll make the next stop at 20%, add a few percentage points of buffer — but resist the temptation to charge to 90% or beyond unless route range genuinely demands it. The math almost always favors more frequent, shorter stops over fewer, longer ones.
All claims are backed by peer-reviewed research. Sources on request.