Key Takeaways
Option A
NADA Guides
The industry-facing, lender-trusted benchmark.
Best for: Dealers, banks, and credit unions valuing trade-ins and setting loan collateral values.
Option B
Kelley Blue Book (KBB)
The consumer-recognized, retail-oriented pricing guide.
Best for: Private sellers and buyers researching market prices and comparing transaction values.
If you're selling to a dealer or negotiating a trade-in
NADA Guides
Dealers often anchor their appraisals to NADA wholesale figures. Knowing the NADA number before you walk in helps you anticipate their starting point and push back intelligently.
If you're pricing a car for private sale
Kelley Blue Book (KBB)
KBB's private-party value closely reflects what real buyers expect to pay in peer-to-peer transactions, making it the stronger anchor for listing prices.
If you're financing a used car and worried about the loan amount
NADA Guides
Most banks and credit unions cap loan amounts against NADA's retail or loan value — knowing that ceiling before you shop prevents surprises at the finance desk.
If you're a buyer comparing a dealer's asking price to market value
Kelley Blue Book (KBB)
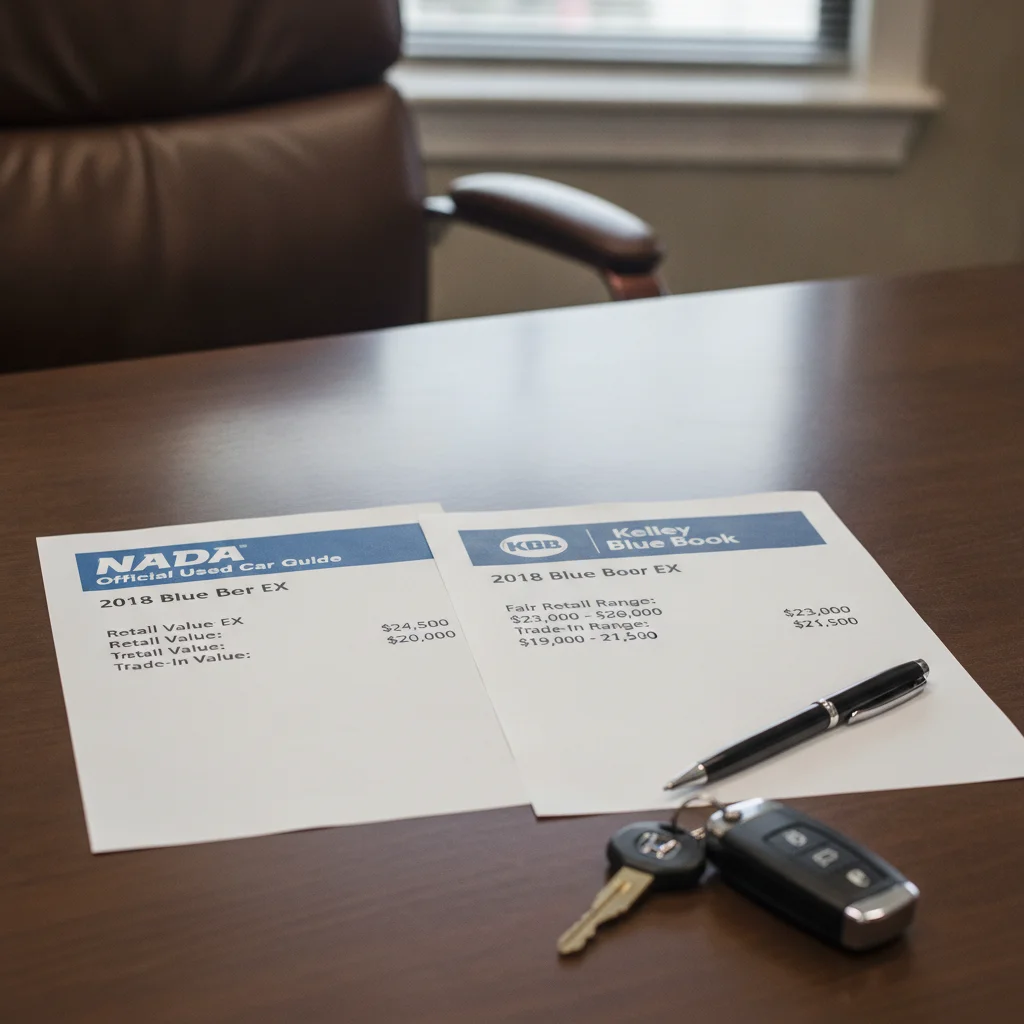
KBB's Fair Purchase Price gives a solid retail benchmark you can print and bring to the table when pushing back on an inflated sticker.
If you want the most complete picture before any negotiation
NADA Guides
Pull NADA to understand the floor the dealer is working from, then layer in KBB and live listings to triangulate where real market value sits.
Why the Tool Your Dealer Uses Matters More Than the Tool You Use
Walk into a dealership armed with a KBB printout and the F&I manager may nod politely — then quote you a completely different number from a different source. That source is almost always NADA Guides, and the gap between what you're holding and what they're citing can easily run $2,000 to $5,000 on a mid-range used vehicle.
This isn't a coincidence or a tactic invented to confuse you. NADA (National Automobile Dealers Association) Guides were built from the ground up to serve the dealer and lending community. KBB was built to serve consumers. Both are legitimate valuation tools, but they answer slightly different questions — and when those questions diverge at a negotiating table, the person who understands whose question is being answered has the upper hand.
For a broader look at how all the major tools stack up, see the major car valuation tools compared side by side. But for the specific NADA vs. KBB question — the one that matters most when you're at a dealer — let's go deeper.

What NADA and KBB Are Actually Measuring
Both tools produce a number called "value," but they're pulling from different data streams and optimizing for different end users.
NADA Guides aggregates wholesale auction data, dealer transaction records, fleet sales, and regional market conditions. Its figures are updated weekly using inputs from tens of thousands of actual dealer-to-dealer transactions. The platform's primary audience has always been dealers, finance companies, banks, and credit unions — institutions that need a defensible, conservative figure for collateral lending. NADA publishes several distinct value types: clean trade-in, average trade-in, clean retail, and rough trade-in. The one lenders most commonly reference is the NADA loan value, which is typically the most conservative figure in the set.
KBB draws on dealer transaction data, private-party listings, and consumer behavior signals gathered through its parent company Cox Automotive's vast network (which also owns Autotrader, Manheim auctions, and vAuto). KBB publishes values in three primary buckets: trade-in value, private party value, and suggested retail value. Its methodology weights recent actual sales — but its consumer-facing interface is explicitly designed to give buyers and sellers a realistic market expectation, not a lender's conservative floor.
The practical consequence: for the same 2019 Ford F-150 XLT in good condition, NADA might return a clean trade-in of $27,400, while KBB puts the trade-in range at $29,200–$31,500. That spread is the dealer's working margin — and it's not arbitrary. See what each valuation tool is actually measuring for a full breakdown of the methodology differences.
| Criterion | NADA Guides | Kelley Blue Book (KBB) |
|---|---|---|
| Primary Audience | Dealers, banks, credit unions | Consumers, private sellers/buyers |
| Main Data Sources | Wholesale auctions, dealer transactions | Dealer sales, listings, Cox Automotive network |
| Update Frequency | Weekly | Weekly (with real-time listing signals) |
| Value Types Published | Clean/avg/rough trade-in, clean retail, loan value | Trade-in range, private party, suggested retail |
| Used by Lenders? | Yes — standard for loan-to-value calculations | Rarely — not the primary lender reference |
| Consumer Brand Recognition | Low — mostly industry-known | Very high — household name |
| Typical Trade-In Estimate vs. KBB | Generally lower (conservative floor) | Generally higher (market-oriented range) |
| Best Use Case | Anticipating dealer/lender offer benchmarks | Pricing private-party sales and retail comparisons |
| Free Public Access | Limited (full access requires subscription) | Yes — fully free at kbb.com |
85%+
U.S. auto lenders using NADA values
Industry surveys consistently show the large majority of banks and credit unions use NADA as their primary collateral valuation reference for auto loans.
$2,000–$5,000
Typical NADA-to-KBB trade-in spread
On mid-range vehicles in good condition, NADA clean trade-in figures frequently run $2,000–$5,000 below KBB's trade-in range midpoint.
38M+
Annual KBB site visitors
KBB consistently ranks as the most-visited automotive valuation site in the U.S., reflecting its dominance as a consumer-facing tool.
~7 days
Valuation update lag for both tools
Both NADA and KBB update weekly, meaning values in fast-moving markets can be several percentage points off from what cars are actually transacting for.
Who Actually Uses Which Tool — and Where
The institutional vs. consumer split is real, but the lines are blurrier than most people think.
Banks and Credit Unions
The majority of U.S. auto lenders — including regional credit unions and national banks — use NADA's loan value as the ceiling for loan-to-value calculations. If NADA says a car's loan value is $18,000, they'll typically lend up to 100%–125% of that figure, depending on creditworthiness. If you're financing a car priced above that NADA ceiling, expect to cover the gap in cash or face a loan denial — the bank doesn't care what KBB says.
Franchised Dealerships
New-car franchise dealers almost universally have NADA subscriptions. When they appraise your trade-in, their used car manager is pulling the NADA clean trade-in or average trade-in figure as a reference point before running the car through their own reconditioning cost estimate. Some dealers cross-reference KBB as a secondary check — particularly because they know consumers walk in with KBB printouts and they want to anticipate objections.
Independent Used Car Dealers
Independents are more varied. Smaller lots often rely on whatever tool is cheapest or most familiar. Many use KBB because it's free and publicly accessible. Others use Black Book or Manheim Market Report if they're actively buying at auction. NADA's full dealer subscription isn't free, so budget-conscious independents may skip it.
Private Sellers and Buyers
Consumers overwhelmingly gravitate to KBB — it's been the cultural default for "what's my car worth" since the 1990s. That brand recognition is so strong that many sellers never question whether a different tool might give them a more accurate or more useful number. For the honest tradeoffs of relying solely on KBB, check out the pros and cons of relying on KBB.

Where the Two Tools Diverge Most — and Why
The gap between NADA and KBB isn't uniform. It widens and narrows based on vehicle type, age, and regional demand. Knowing where the divergence is biggest helps you anticipate negotiation friction before it happens.
Trucks and SUVs
High-demand segments — full-size trucks especially — often show the widest NADA-to-KBB spread because auction data for these vehicles is extremely active and regionally volatile. A crew-cab diesel in Texas might fetch $4,000 more at a regional auction than NADA's national average suggests, and KBB may capture that premium faster than NADA's update cycle does.
Older, High-Mileage Vehicles
For cars over 10 years old with 120,000+ miles, both tools become less reliable — but NADA tends to show lower figures because lenders don't want to collateralize depreciating assets aggressively. KBB may show a higher private-party range because actual buyers of older vehicles in good condition are often willing to pay a premium for condition and maintenance history that neither algorithm fully accounts for.
Luxury and Exotic Vehicles
Both tools struggle with low-volume luxury and performance cars because there simply aren't enough comparable transactions to build statistically robust estimates. In these segments, treat both numbers as rough anchors and rely more heavily on recent sold listings from auction sites and specialty dealers.
Electric Vehicles
EV valuation is volatile enough that both NADA and KBB values can feel stale within weeks. Battery degradation, software updates, and rapidly changing new-car incentives create used-car pricing dynamics that neither tool was originally designed to handle. Live listings on marketplace platforms carry more weight here than any static guide value.
When valuations diverge dramatically, there's usually a specific reason. When valuation tools disagree by a lot walks through the most common causes — it's worth reading before you assume one tool is simply wrong.
NADA Is Now Hosted by J.D. Power
As of 2022, NADA Guides consumer-facing content is hosted at jdpower.com/cars/shopping-guides/nada-car-values. The tool still uses NADA methodology and data, but the URL has changed. Full dealer-subscription access remains a separate product. For consumers pulling a quick trade-in estimate, the J.D. Power hosted version is functionally identical to the old nadaguides.com experience.
How to Use Both Tools Strategically Before You Negotiate
The right move is not to pick a side — it's to triangulate. Here's a practical three-step approach:
- Pull NADA first. Go to nadaguides.com (now integrated into J.D. Power's consumer site) and get the clean trade-in and average trade-in figures for your vehicle. This is roughly what a dealer will use as their internal benchmark. If your car is in genuinely excellent condition, argue toward the clean figure. Average trade-in is their fallback if they find anything wrong during inspection.
- Pull KBB second. Get the trade-in range and private-party value. The trade-in range gives you a defensible counter if the dealer comes in below NADA's clean figure. The private-party value is your baseline if you decide a dealer trade-in isn't worth the discount and you'd rather sell outright.
- Check live listings last. Run your year/make/model/trim on CarGurus or Autotrader and filter for similar mileage and condition within 150 miles. Actual asking prices — especially listings that have been sitting for 30+ days with price drops — tell you more about real market demand than any algorithm.
When you walk into a dealer trade-in negotiation with all three data points, you can respond to whatever number the appraiser throws out. If they cite NADA average trade-in, you cite NADA clean trade-in and explain why your car qualifies. If they pivot to a lower number, you have KBB and live listings as independent corroboration that their offer is below market.
For tactical negotiating scripts and timing strategies, dealer negotiation has the playbook. The valuation homework you do before the visit is what makes those tactics land.
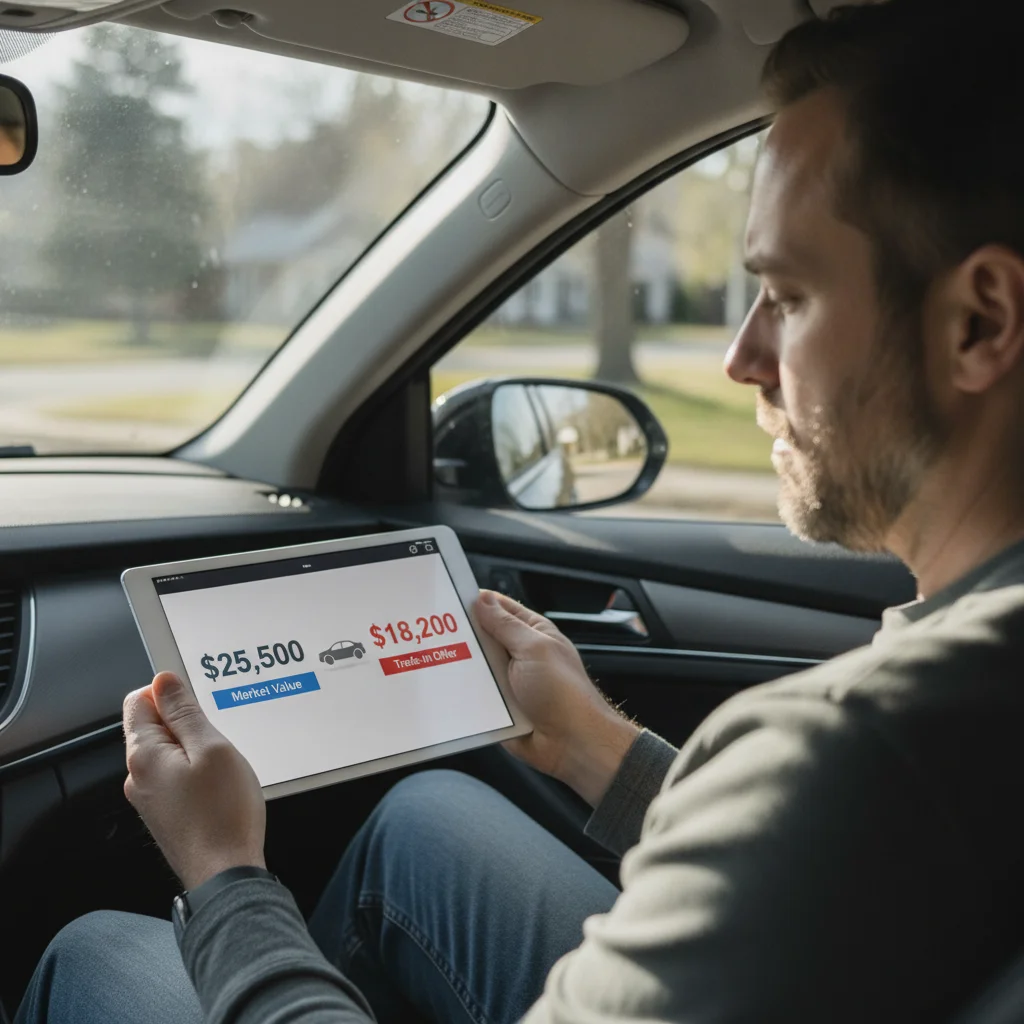
The Bottom Line: Neither Tool Is Right — Context Is Everything
NADA isn't more accurate than KBB. KBB isn't more trustworthy than NADA. They're optimized for different audiences with different needs, and both have real limitations when the market moves faster than their update cycles.
What matters is understanding which lens your counterpart is using. A dealer citing NADA average trade-in is not giving you a neutral market value — they're citing a figure designed to protect lender collateral, which is systematically conservative relative to what that car could actually sell for. A private buyer brandishing a KBB printout is citing a figure that may reflect retail expectations, not what the wholesale market would bear.
The seller who knows both numbers — and can articulate why their specific car should be valued at the higher end of the range — will consistently walk away with better outcomes than the one who memorized a single figure and hoped for the best.
For a side-by-side look at how KBB stacks up against Edmunds, which is increasingly the tool of choice for sophisticated private sellers, see Kelley Blue Book vs. Edmunds. And if you want the complete picture across all major valuation platforms, the major car valuation tools compared side by side is the reference to bookmark.

All claims are backed by peer-reviewed research. Sources on request.