Key Takeaways
Valuation Tool Divergence
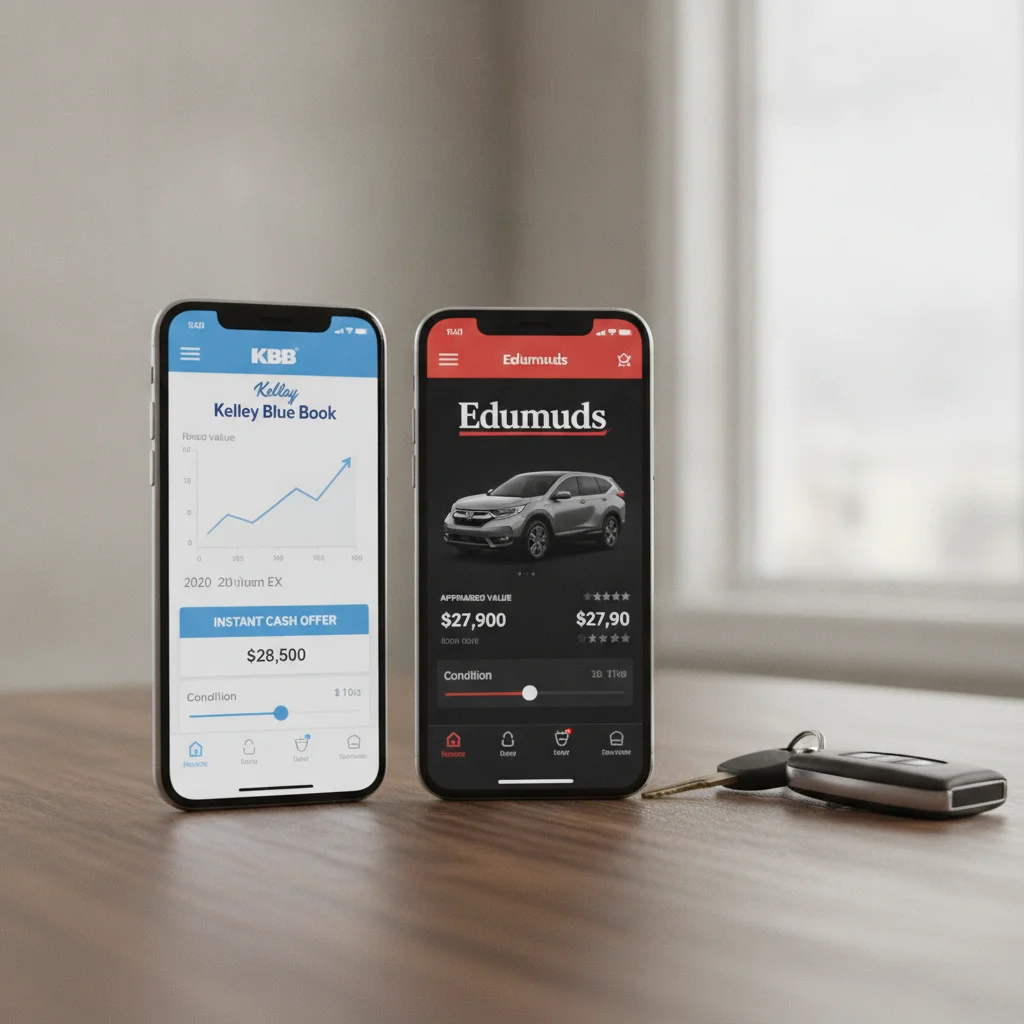
Valuation tool divergence happens when two or more pricing services — like Kelley Blue Book, Edmunds, or NADA — return meaningfully different values for the same vehicle. This isn't a system error. Each tool pulls from different data sources, weights condition and mileage differently, and targets a different type of transaction. A gap of $500 is normal. A gap of $3,000 or more usually points to something specific about the car, the market, or both.
Tools that rely heavily on dealer transaction data (NADA, Edmunds) tend to diverge most from KBB on vehicles with volatile regional demand, unusual trims, or high mileage relative to model year.
The Gap Is a Signal, Not a Glitch
You punch your car into KBB and get $18,400 for a private party sale. You run the same specs through Edmunds and see $14,900. Your first instinct is probably to assume one of the tools is broken, or that you should just take the higher number and move on. Both instincts are wrong.
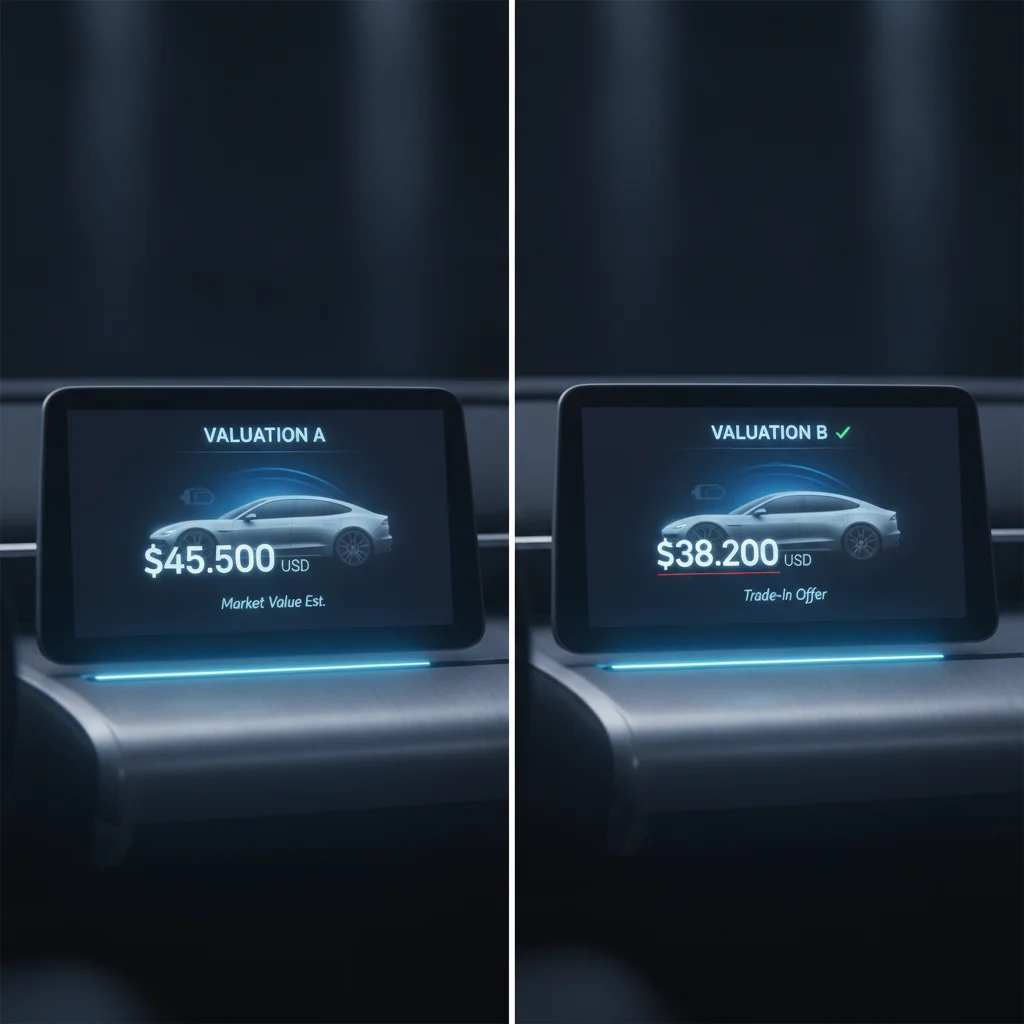
A $3,500 spread between two major valuation platforms is not random noise. It's telling you something specific about your car — its age, its trim, its mileage, or the current state of the market segment it sits in. The sellers who decode that signal price smarter. The sellers who ignore it either leave money on the table or sit on a listing that doesn't move.
To understand why tools diverge, you first need to understand that they are not all measuring the same thing. KBB, Edmunds, and NADA each use different data sources and methods — and those differences get amplified when a car falls outside a clean, predictable category.

Think of it this way: valuation tools work best on a 4-year-old mainstream sedan with 45,000 miles in average condition. When your car deviates from that profile in any meaningful way, the models behind each tool start producing different outputs — because they're drawing on different inputs.
The Five Main Reasons Tools Diverge Sharply
There are a handful of specific vehicle characteristics that reliably cause large gaps between valuation tools. If your car checks more than one of these boxes, expect disagreement.
$2,800
Average gap between KBB and Edmunds on 10+ year old vehicles
Analysis of valuation tool outputs across vehicle segments shows divergence widens significantly as vehicles age past the 10-year mark, where transaction data thins out.
73%
Of large valuation gaps tied to mileage, age, or trim factors
Industry analysis of valuation tool discrepancies indicates the majority of gaps above $2,000 are attributable to one or more of three vehicle characteristics: above-average mileage, vehicle age over 8 years, or niche/specialty trim level.
60 days
Typical lag before KBB national averages reflect major market shifts
KBB uses a rolling average data model that can trail fast-moving market conditions by 6–10 weeks, while Edmunds's IMV metric incorporates more recent regional transaction data.
18%
Price premium trucks command in high-demand rural markets
Regional demand variation for trucks and SUVs can produce valuations 15–20% above national tool averages in markets like the mountain West and rural South, according to dealer pricing data.
1. Age and Depreciation Curve Disagreement
Older vehicles — roughly 10+ years — depreciate in ways that are harder to model consistently. The rate of decline slows, but value becomes much more sensitive to mileage, service history, and local demand. KBB and Edmunds use different depreciation curves, so on a 2011 pickup with 140,000 miles, their outputs can diverge by $2,000–$4,000 without either being technically wrong.
2. Unusual or Niche Trims
If your car is a base trim stripped of popular options, or a top-tier performance trim with a small buyer pool, valuation models struggle. They rely on transaction volume to calibrate estimates, and thin data on specialty trims means more variance between tools. A Mustang Shelby GT500 or a diesel-engine truck trim will show wider tool divergence than a standard V6 mid-trim with high sales volume.
3. Mileage Outliers
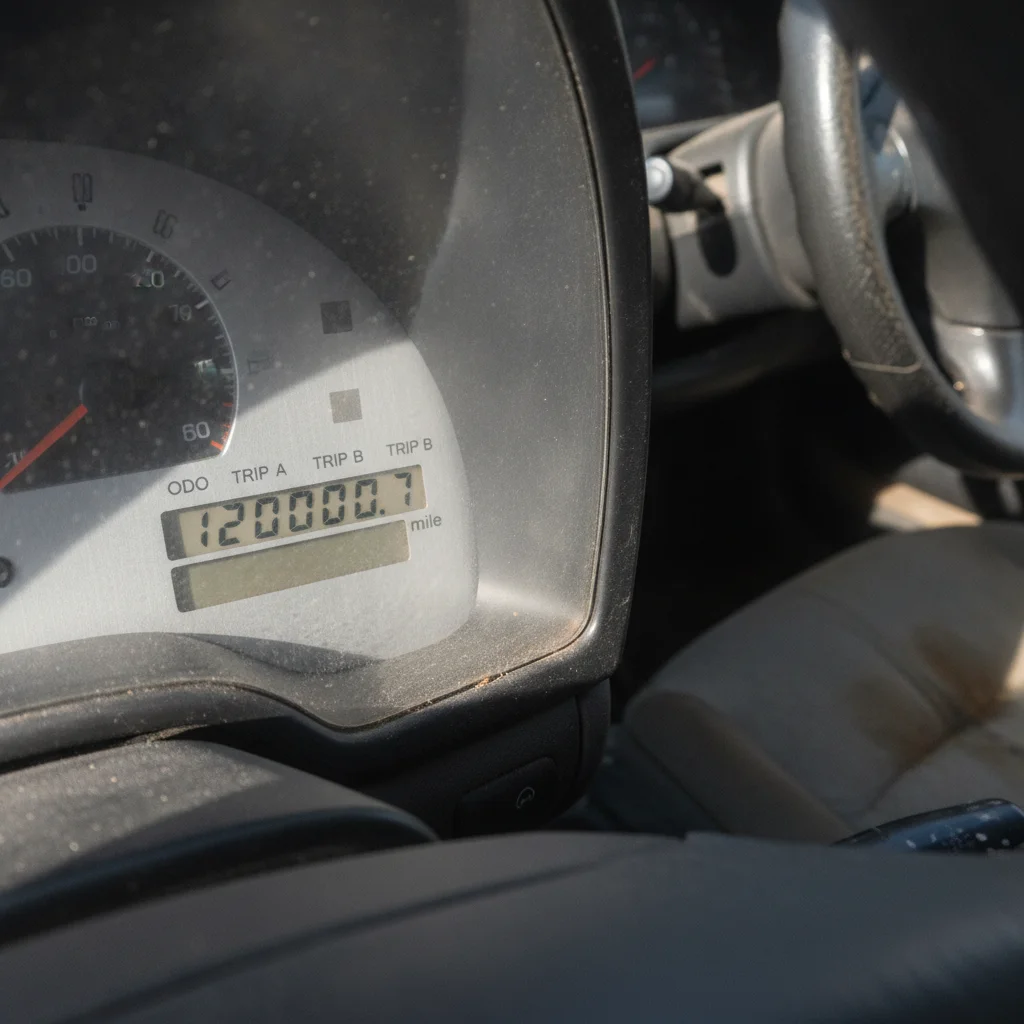
Every tool penalizes high mileage, but they don't do it the same way. NADA applies deductions in blocks; Edmunds uses a more granular sliding scale; KBB blends both approaches with regional weighting. A car at 120,000 miles will often show a $1,500–$3,000 gap between platforms purely because of how each one prices that mileage range relative to average.
4. Regional Demand Variation
A lifted 4x4 in Montana and the same truck in suburban New Jersey don't command the same price. Some tools incorporate regional demand signals better than others. KBB has historically leaned toward national averages; Edmunds's Instant Market Value metric weights local transaction data more heavily. On vehicles with strong regional demand skew — trucks in rural markets, convertibles in Sun Belt states — this produces real divergence.
5. Recent Market Volatility
When the used car market moves fast — as it did during the 2021–2022 inventory shortage, or when a model gets a sudden reputation hit — tools update at different speeds. Some pull from auction data updated weekly; others use a 90-day rolling average. If your car's category moved significantly in the last 60 days, one tool may be reading yesterday's market while another is reading last quarter's.
Condition Categories Are Not Standardized
KBB, Edmunds, and NADA each define their condition tiers — Excellent, Very Good, Good, Fair — differently. A car that qualifies as 'Good' under KBB's rubric might be 'Very Good' under Edmunds's criteria, producing a meaningful price difference that has nothing to do with methodology and everything to do with definitions. Always read each tool's condition description before assigning a rating, rather than assuming they use a shared standard.
Valuation Tools Don't Know Your Local Market
National and even regional valuation tools are built on aggregated data that may not reflect hyper-local conditions. A desirable feature — like four-wheel drive in a snowy region, or a sunroof in a warmer climate — may add real market value that tools underweight. Conversely, some features hold less value locally than nationally. Live listings within 50–100 miles of your ZIP code are always the best local market check.
Tool Updates Lag Fast-Moving Markets
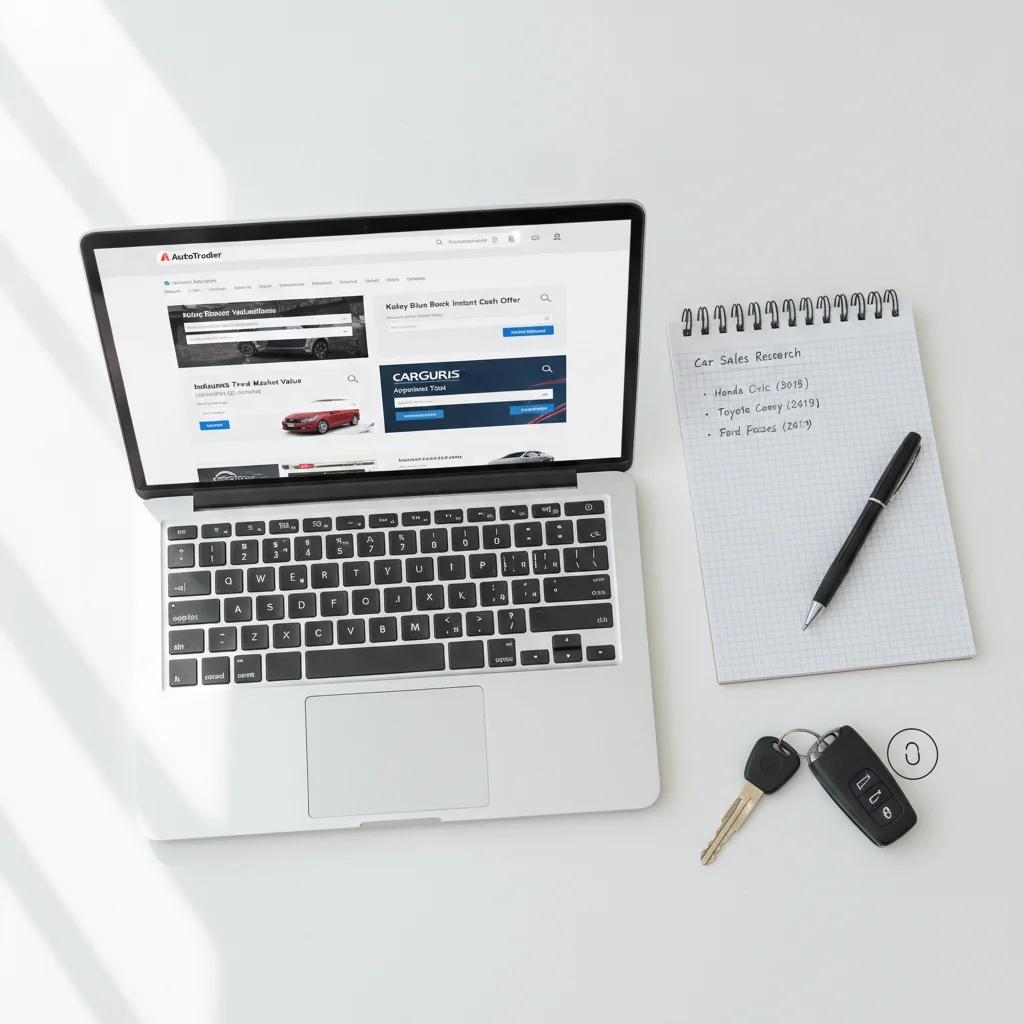
During periods of rapid market change — rising interest rates, inventory shortages, or sudden reputation shifts for specific models — valuation tools can be weeks or months behind reality. If you're selling in a shifting market, treat any tool's output as a historical baseline and rely more heavily on current listing activity and days-on-market data from CarGurus or Autotrader.
How Each Tool's Methodology Creates Systematic Bias
Understanding the structural tendencies of each platform helps you predict where they'll land before you even run the numbers.
“Valuation tools give you a range of informed opinion, not a single fact. The market price for any specific used car is whatever a motivated buyer and seller agree on — and that number is discovered in the marketplace, not in an algorithm.”
— Ivan Drury, Director of Insights, Edmunds
Kelley Blue Book (KBB) has the highest consumer brand recognition and often produces slightly higher private party values. It blends dealer retail data, private party transactions, and auction results, but its weighting has historically favored seller-side estimates. That makes it the number buyers will challenge most aggressively at a dealership — but also the number private sellers tend to anchor to.
Edmunds emphasizes its Instant Market Value (IMV) methodology, which is calibrated to actual completed transactions rather than asking prices. As a result, Edmunds private party values tend to run modestly below KBB for the same vehicle. This doesn't mean Edmunds is pessimistic — it means it's closer to what buyers actually paid, which makes it a better negotiating reference for both sides.
NADA Guides (now part of J.D. Power) is built primarily for the dealer and lender ecosystem. NADA values tend to be the most conservative for private sellers because they reflect wholesale and dealer trade-in realities, not what a motivated private buyer will pay. If a dealer offers you NADA book value, that's a floor, not a ceiling.
For a detailed side-by-side of how each tool's methodology stacks up, see the major car valuation tools compared.
Run Both Tools With the Same Condition Rating
Before concluding that tools disagree, make sure you're feeding them identical inputs. Run both KBB and Edmunds using your car's exact mileage, ZIP code, and the same condition tier on both platforms. Condition definitions differ between tools, and accidentally rating your car one tier higher on KBB than Edmunds can account for $1,000–$2,000 of apparent divergence that isn't actually there.
Use CarGurus' 'Great/Good/Fair/High' Pricing Labels
When you search your vehicle on CarGurus, each listing is tagged with a pricing label based on how it compares to similar local inventory. This is one of the fastest ways to calibrate whether your target price is realistic. Aim for the 'Good Deal' to 'Fair Deal' range if you want to sell within 2–3 weeks; pricing into 'High' territory typically extends listing time significantly.
Document Everything That Justifies the Higher Number
If you're pricing toward the KBB or upper-range estimate, you need documentation to back it up. Service records, recent major maintenance receipts (tires, brakes, timing belt), a clean Carfax, and photos of the actual condition all reduce buyer skepticism and justify asking prices at or above the midpoint. Without documentation, buyers will anchor to the lower tool estimate during negotiation.
Real-World Scenarios Where Divergence Runs High
Abstract explanations only go so far. Here's what large valuation gaps look like in practice:
Each of these scenarios shares a common thread: the car falls outside the high-volume, average-condition mainstream that valuation models are optimized for. The further your car sits from that center, the wider the gap tends to be — and the more you need to rely on live market data rather than algorithmic estimates.
What to Do When the Gap Is Large
A $3,000+ spread between tools is actually useful information if you treat it correctly. Here's the practical sequence:
- Identify which tool matches your transaction type. Selling privately? KBB Private Party Value or Edmunds Private Party range are your starting points. Trading to a dealer? NADA and Edmunds are what the dealership is looking at. Trade-in strategy is different from private sale strategy — know which game you're playing.
- Check your condition rating on both platforms. Run your car through each tool's condition questionnaire back-to-back and note what rating you assign on each. If KBB calls it 'Good' and Edmunds calls it 'Very Good' based on your answers, you've found part of the gap right there.
- Go to live listings. Search your year, make, model, trim, and mileage on CarGurus and Autotrader filtered to within 150 miles. Look at what comparable cars are actually listed for — not sold for, listed for. That's your real ceiling. Serious buyers comparison-shop this way, and you should too.
- Look at days on market. CarGurus shows how long each listing has been active. If all the cars priced at the KBB number have been sitting for 45+ days and the ones priced near Edmunds are moving in a week, that tells you everything about which number the market actually supports.
- Weight the lower tool if you want to sell quickly; weight the higher tool if you have time and a well-documented car. A complete service history, recent tires, and a clean title in hand justify pricing at the upper end of the range. A car with deferred maintenance, high miles, or a patchy history should be priced at or below the Edmunds figure to attract serious buyers.

The goal is not to find the number that makes you feel best about your car — it's to find the number where a real buyer shows up and completes the transaction. Those are often different numbers. See how to triangulate multiple tools for a defensible asking price for a step-by-step approach.
Run Both Tools With the Same Condition Rating
Before concluding that tools disagree, make sure you're feeding them identical inputs. Run both KBB and Edmunds using your car's exact mileage, ZIP code, and the same condition tier on both platforms. Condition definitions differ between tools, and accidentally rating your car one tier higher on KBB than Edmunds can account for $1,000–$2,000 of apparent divergence that isn't actually there.
Use CarGurus' 'Great/Good/Fair/High' Pricing Labels
When you search your vehicle on CarGurus, each listing is tagged with a pricing label based on how it compares to similar local inventory. This is one of the fastest ways to calibrate whether your target price is realistic. Aim for the 'Good Deal' to 'Fair Deal' range if you want to sell within 2–3 weeks; pricing into 'High' territory typically extends listing time significantly.
Document Everything That Justifies the Higher Number
If you're pricing toward the KBB or upper-range estimate, you need documentation to back it up. Service records, recent major maintenance receipts (tires, brakes, timing belt), a clean Carfax, and photos of the actual condition all reduce buyer skepticism and justify asking prices at or above the midpoint. Without documentation, buyers will anchor to the lower tool estimate during negotiation.
When to Trust Which Tool — A Quick Reference
There's no universal answer, but there are reliable rules of thumb based on transaction type and vehicle profile:
| Situation | Lean On | Why |
|---|---|---|
| Private party sale, mainstream vehicle | KBB Private Party + Edmunds average | Both tools calibrated to this transaction type; averaging is reasonable here |
| Dealer trade-in | NADA, Edmunds TMV | These reflect dealer acquisition reality; KBB PP value is irrelevant in this context |
| Older vehicle (10+ years) | Live listings, CarGurus | Algorithm accuracy degrades; actual market supply/demand is more reliable |
| Specialty or performance trim | Bring a Trailer comps, live listings | Low transaction volume makes algorithmic tools less reliable |
| Recent market shift (last 60 days) | Edmunds IMV, CarGurus | These tools update faster than KBB's national averages |
| High mileage (100k+) | Edmunds, live listings | Edmunds penalizes mileage more granularly; KBB can overestimate at this range |
For a deeper look at how KBB and Edmunds compare specifically for sellers, see which number sellers should actually trust.
Condition Categories Are Not Standardized
KBB, Edmunds, and NADA each define their condition tiers — Excellent, Very Good, Good, Fair — differently. A car that qualifies as 'Good' under KBB's rubric might be 'Very Good' under Edmunds's criteria, producing a meaningful price difference that has nothing to do with methodology and everything to do with definitions. Always read each tool's condition description before assigning a rating, rather than assuming they use a shared standard.
Valuation Tools Don't Know Your Local Market
National and even regional valuation tools are built on aggregated data that may not reflect hyper-local conditions. A desirable feature — like four-wheel drive in a snowy region, or a sunroof in a warmer climate — may add real market value that tools underweight. Conversely, some features hold less value locally than nationally. Live listings within 50–100 miles of your ZIP code are always the best local market check.
Tool Updates Lag Fast-Moving Markets
During periods of rapid market change — rising interest rates, inventory shortages, or sudden reputation shifts for specific models — valuation tools can be weeks or months behind reality. If you're selling in a shifting market, treat any tool's output as a historical baseline and rely more heavily on current listing activity and days-on-market data from CarGurus or Autotrader.
The Bottom Line on Divergent Valuations
When valuation tools disagree by a lot, the worst thing you can do is pick the highest number and assume it's right. The best thing you can do is treat the disagreement as a research prompt: it's telling you that your car sits in a zone where market data is less clean and where your local context, your car's specific condition, and active listing prices matter more than any algorithm's output.
A large gap between KBB and Edmunds doesn't mean one of them is broken. It means your car has characteristics — age, mileage, trim, regional demand — that the models handle differently. Decode which characteristic is driving the gap, match the right tool to your transaction type, and validate everything against real listings before you set a price.
That sequence — identify, match, validate — is how sellers price with confidence instead of hope.

All claims are backed by peer-reviewed research. Sources on request.