Key Takeaways
Option A
Luxury Car Depreciation
Steeper raw-dollar losses, faster first-year drops.
Best for: Sellers who bought premium brands and need accurate expectations before pricing or trading in.
Option B
Economy Car Depreciation
Slower percentage losses, steadier long-term value retention.
Best for: Sellers of mainstream budget vehicles who want to understand why their resale price may be surprisingly stable.
If you own a luxury car and are deciding when to sell
Luxury Car Depreciation
Luxury vehicles drop hardest in years one through three. Selling before the 36-month mark — or waiting until year five when the curve flattens — often recovers more value than selling mid-curve.
If you own an economy car and want to maximize resale value
Economy Car Depreciation
Economy cars hold value more steadily, so you have more flexibility in timing. Keep maintenance records clean and mileage reasonable; the percentage retained stays competitive well past 60,000 miles.
If you are buying used and want to avoid the steepest losses
Luxury Car Depreciation
A two- or three-year-old luxury vehicle has already absorbed its largest value drop, giving you near-new features at a significantly reduced price — though factor in higher insurance and maintenance costs.
If you prioritize predictable, low-risk ownership costs
Economy Car Depreciation
Economy cars combine moderate depreciation with lower insurance premiums and cheaper parts, making total cost of ownership easier to forecast and manage over a five-year period.
Why Depreciation Hits the Two Segments So Differently
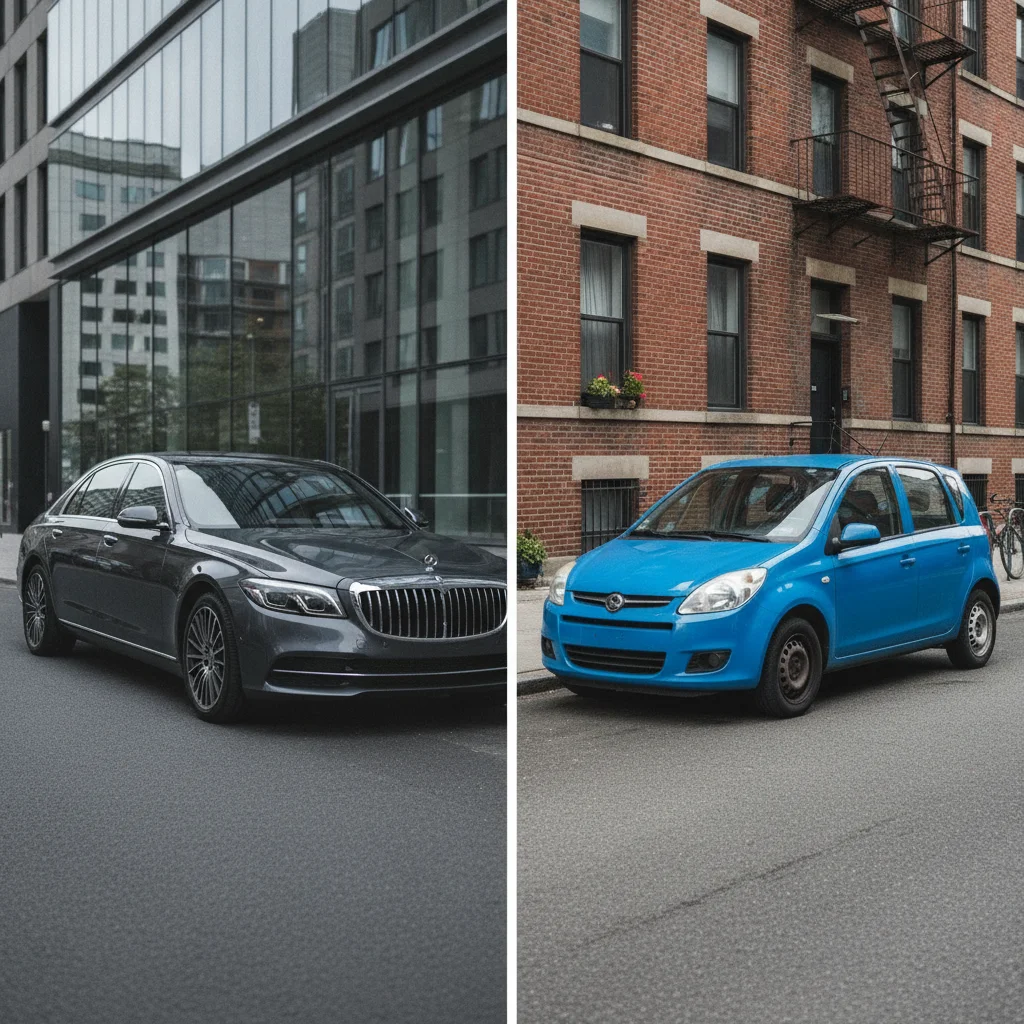
Depreciation is simply the gap between what you paid for a car and what someone else will pay for it later. That gap is shaped by purchase price, demand, reliability reputation, and cost of ownership — four variables that land very differently for a $65,000 luxury sedan than for a $22,000 economy compact.
Before diving into the numbers, it helps to understand what drives each curve. For a deeper foundation, see The Depreciation Curve: What the First Five Years Really Cost You, which walks through how value drops unfold year by year for a typical new vehicle.
At the luxury end, several forces accelerate value loss:
- High sticker prices create a larger absolute dollar amount to lose, even if the percentage decline is similar to economy cars.
- Technology obsolescence moves quickly. A three-year-old infotainment system or driver-assistance suite in a premium vehicle can feel dated fast, pushing buyers toward newer models.
- Higher cost of ownership — premium fuel, expensive parts, and specialist labor — shrinks the pool of buyers who can afford to run the car long-term, reducing resale demand.
At the economy end, the forces largely reverse:
- Lower purchase prices mean a smaller absolute dollar loss even when the percentage is comparable.
- Broad demand for affordable, fuel-efficient daily drivers keeps the resale market competitive.
- Lower running costs attract a wide buyer pool, supporting values.
Understanding these structural differences is step one. Step two is reading the actual numbers on each curve.
The Numbers: How Each Curve Actually Behaves
Let's anchor the comparison in concrete figures. Industry data from Carfax, iSeeCars, and Edmunds consistently show the following general patterns (individual models vary — these are segment averages):
| Criterion | Luxury Car | Economy Car |
|---|---|---|
| Typical new MSRP | $55,000–$90,000+ | $18,000–$28,000 |
| Year 1 depreciation (%) | 20–25% | 15–18% |
| Year 3 depreciation (%) | 40–50% | 30–40% |
| Year 3 dollar loss (avg.) | $26,000–$40,000+ | $6,000–$10,000 |
| Year 5 value retained (%) | 35–45% | 45–55% |
| Primary depreciation driver | Technology obsolescence, high ownership cost | General wear, mileage accumulation |
| Buyer pool size (used market) | Narrower, income-sensitive | Broad, highly competitive |
| Private vs. trade-in value gap | $3,000–$6,000 typical | $1,500–$3,000 typical |
A few things stand out immediately. The luxury vehicle loses roughly $26,000–$33,000 in raw dollars over three years. The economy car loses roughly $6,600–$8,800. Even if both segments shed about 40% of their value, that translates to a wildly different dollar hit at the closing table.
The percentage gap also widens in year one. A luxury vehicle commonly drops 20–25% the moment it leaves the lot — partly because the MSRP includes a larger margin, and partly because the next buyer won't pay new-car money for a used one. An economy car typically drops 15–18% in the same first year.
49%
Average luxury car value lost after 3 years
iSeeCars 2023 depreciation study found luxury sedans averaged a 49% value loss over 36 months, versus 37% for economy sedans.
$32,000
Avg. raw dollar loss on a luxury vehicle in 3 years
Based on a $65,000 average luxury sedan MSRP losing roughly 49% of value by month 36, per iSeeCars 2023 data.
20–25%
First-year drop for most new luxury cars
Edmunds and Carfax data consistently show premium vehicles losing between one-fifth and one-quarter of MSRP in year one alone.
55%
5-year value retained by top economy models
Models like the Toyota Tacoma and Honda CR-V regularly retain 55% or more of their original value at five years, per Kelley Blue Book.
For a broader look at how different vehicle types — not just luxury versus economy — track through their depreciation lifecycle, Used Car Depreciation Curves: Which Segments Hold Value and Which Don't lays out the full picture across sedans, SUVs, and trucks.
A Note on Model-Level Variation
Segment averages are useful benchmarks, but individual models deviate significantly. A BMW 7 Series depreciates faster than a Lexus ES even though both are luxury cars — Lexus consistently outperforms the segment on reliability and owner costs. Similarly, a Mitsubishi Mirage depreciates faster than a Honda Civic despite both being economy cars. Always check model-specific residual values using tools like Kelley Blue Book or ALG (Automotive Lease Guide) rather than relying solely on segment averages.
CPO Programs and Their Effect on Used Luxury Prices
Certified pre-owned programs are more prevalent — and more financially meaningful — in the luxury segment than in the economy segment. A manufacturer-certified luxury vehicle carries an extended warranty that directly addresses the buyer's fear of expensive out-of-warranty repairs. This certification can add $1,500–$3,500 to a luxury vehicle's private-party resale value. Economy CPO programs exist but command smaller premiums, typically $500–$1,000, because the repair risk is lower to begin with.
What Drives the Gap: Brand, Demand, and Cost of Ownership
Three factors explain most of the behavioral difference between the two curves.
Brand Reputation and Reliability Scores
Economy brands like Toyota, Honda, and Mazda consistently rank at the top of long-term reliability surveys. A high reliability score lowers the perceived risk for a used-car buyer, which keeps demand — and therefore resale prices — stronger. Luxury brands are not all unreliable, but premium German marques in particular carry reputations for expensive out-of-warranty repairs, which buyers price in when making offers.
Total Cost of Ownership for the Next Buyer
When someone shops for a three-year-old luxury sedan, they are not just evaluating the purchase price. They are mentally adding insurance premiums (typically 20–30% higher for luxury vehicles), fuel costs (many luxury cars require premium fuel), and the cost of routine services at a dealership or specialist shop. That total-cost calculation reduces the buyer pool, and a smaller buyer pool means softer resale prices.
Market Supply and New-Model Incentives
Luxury manufacturers frequently offer aggressive lease deals and incentives to push new inventory. When new luxury cars are heavily discounted or subsidized through manufacturer lease programs, two- and three-year-old used examples look less compelling by comparison. Economy manufacturers also run incentives, but the spread between new and used prices tends to stay narrower because the absolute numbers are smaller.
To see how brand and reliability reputation interact with depreciation across the full spectrum of vehicles, Slow Depreciators vs. Fast Depreciators: Why Not All Cars Age the Same breaks down exactly which factors matter most.
Reading the Curves: When Each Type Loses the Most Value
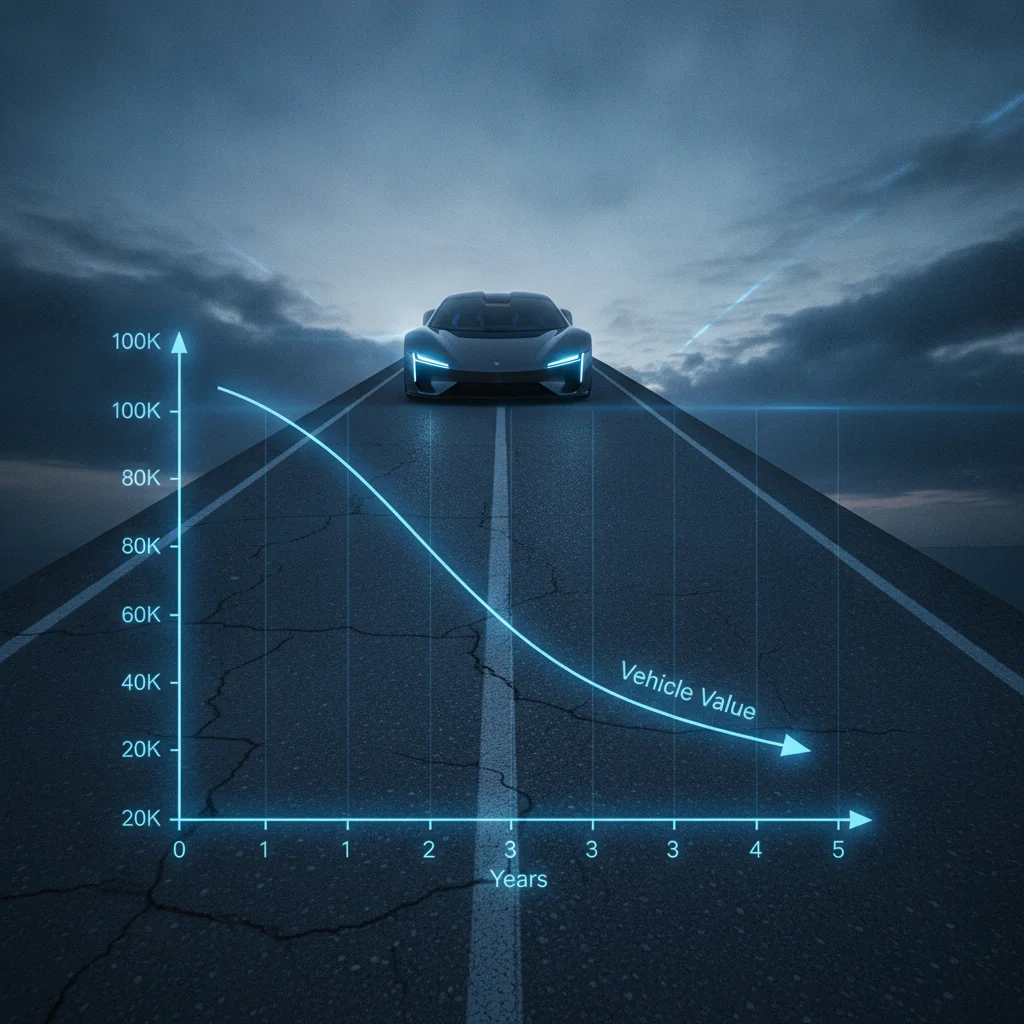
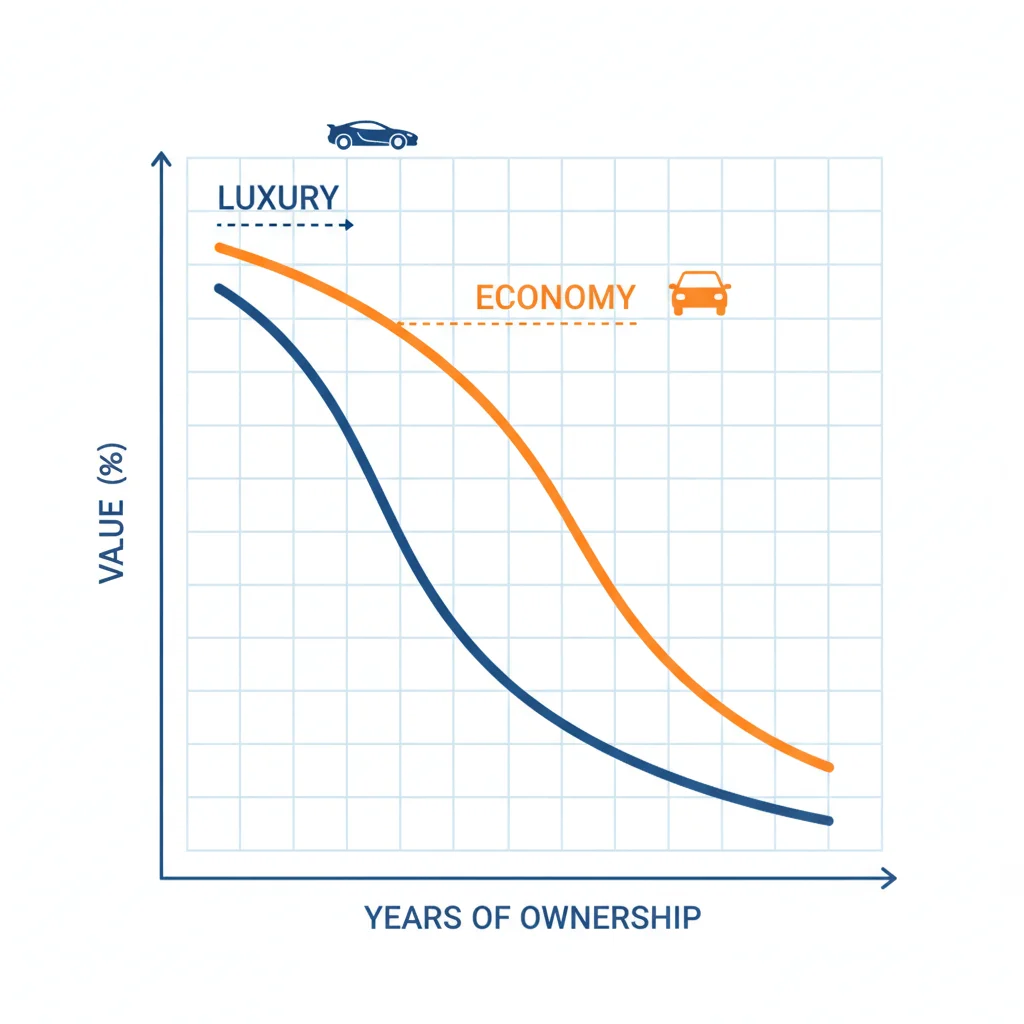
Depreciation is not linear — it front-loads. Both luxury and economy cars lose value fastest in the first 12–24 months, but the shape of the curve differs meaningfully after that.
Luxury Depreciation Curve Shape
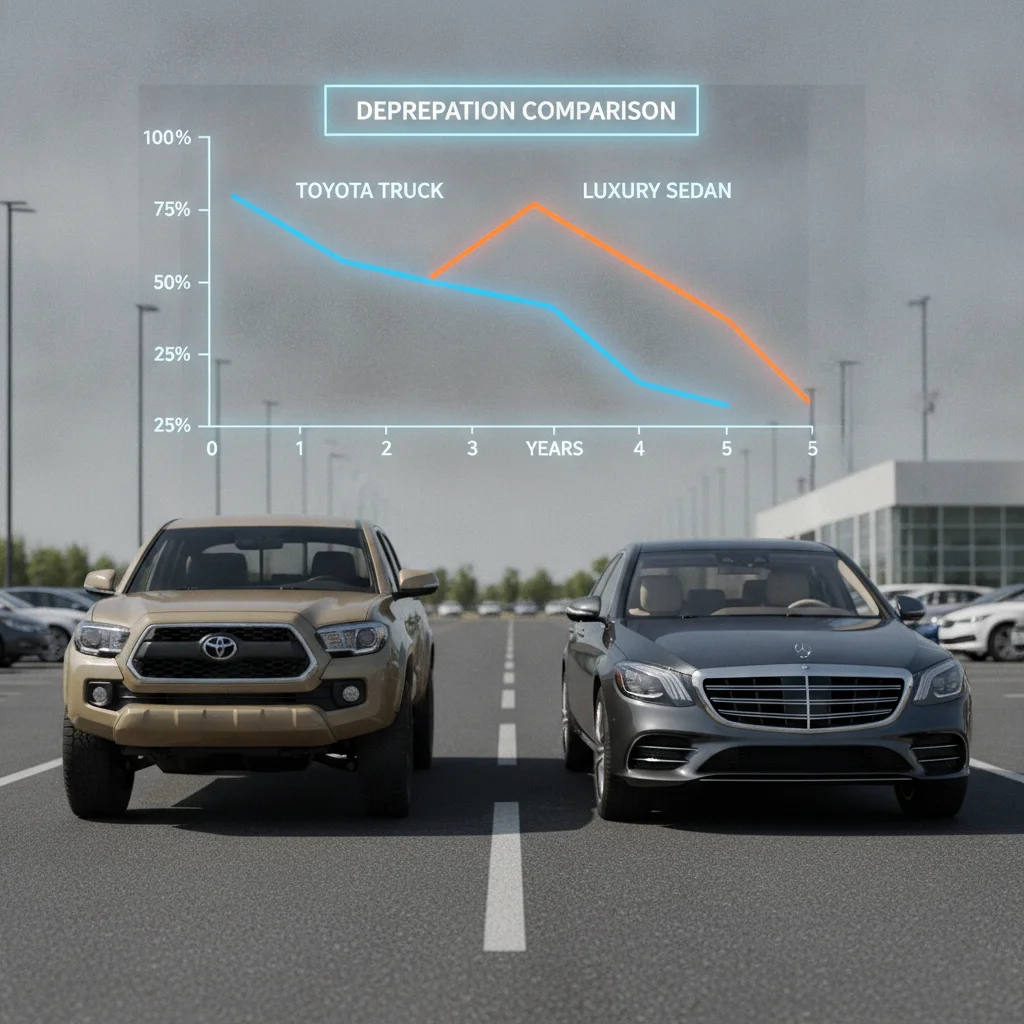
Years 1–3 represent the steepest part of the luxury drop. After year three, the curve tends to flatten somewhat — partly because the car has already shed its new-car premium, and partly because a used luxury vehicle begins competing on a value-per-feature basis rather than against new inventory. However, a secondary dip often appears around the 60,000–75,000 mile mark when expensive maintenance items (timing chains, suspension components, transmission services) become likely, spooking buyers again.
Economy Depreciation Curve Shape
Economy cars follow a smoother, more gradual curve. The year-one drop is smaller in percentage terms, and the vehicle continues losing value at a moderate pace through years two through five. Importantly, reliable economy cars often stabilize in a competitive price band around years four through six because demand from buyers seeking an affordable, dependable used vehicle stays consistently high.
Timing your sale to hit the flattest part of the curve — just before a secondary dip — is the core strategy for maximizing net proceeds. Why Luxury Cars Depreciate Faster Than Economy Models explores the structural reasons behind these steeper drops in the premium segment in more detail.
It's also worth noting that vehicle segment — not just price tier — plays a role. A luxury pickup truck depreciates very differently from a luxury sedan, just as an economy SUV holds value differently from an economy sedan. For that layer of analysis, see Depreciation by Vehicle Segment: Sedans, SUVs, Trucks, and Sports Cars Compared.
Setting a Realistic Asking Price Based on Your Car's Curve
Once you know which curve your vehicle is on, you can price it to sell without leaving money on the table. Here is a step-by-step approach:
- Find your baseline value. Use at least two valuation tools — Kelley Blue Book and Edmunds are the most widely referenced — and average their private-party figures. The Valuation Tools hub explains exactly how each tool calculates its estimates and where they tend to diverge.
- Adjust for mileage versus the segment average. Luxury vehicles are typically driven fewer miles annually (~10,000–11,000) than economy cars (~12,000–13,000). If your luxury car is above the segment average in mileage, expect to discount further — buyers apply a steeper penalty to high-mileage luxury vehicles because wear on premium components is more expensive to address.
- Account for condition and service history. A luxury vehicle with a full dealer-stamped service record can command a 5–8% premium over a comparable car with spotty documentation. For economy cars, the premium is smaller (2–4%) because maintenance is cheaper and buyers are less worried about catastrophic repair bills.
- Check active competition, not just historical data. Search your zip code and a 150-mile radius on CarGurus or AutoTrader for similar year, trim, and mileage. If three identical vehicles are sitting unsold at $28,000, pricing yours at $29,500 based on book value alone will stall your sale.
- Build in negotiation room strategically. Luxury buyers almost always negotiate; price 3–5% above your true floor. Economy car buyers also negotiate, but the spread is typically smaller — 1–3% is a reasonable buffer.

Running these steps before you list — rather than after you get your first low offer — puts you in a much stronger negotiating position regardless of which depreciation curve your vehicle sits on.
Practical Takeaways for Luxury and Economy Car Sellers
Here is what the comparison ultimately means in practical terms for each type of seller:
If You Are Selling a Luxury Vehicle
- Do not wait too long. The steepest dollar losses happen in years one through three. If you are past that window, the curve has flattened and you have more time flexibility — but a second dip around high mileage is coming.
- Invest in presentation. A certified pre-owned inspection or a third-party pre-sale inspection report can directly counter buyer anxiety about repair costs and justify a higher asking price.
- Consider the private-sale channel seriously. Dealer trade-in values on luxury vehicles often undercut private-party values by $3,000–$6,000 because dealers need margin to resell. The delta is larger in the luxury segment than in the economy segment.
If You Are Selling an Economy Vehicle
- Timing is more forgiving. Economy cars hold value more steadily, so you do not need to rush to beat a steep drop. Focus on condition and documentation rather than urgency.
- Mileage management matters. Economy buyers are often commuters who pay close attention to miles per year. Staying near or below the 12,000-mile-per-year average preserves your position in the value range.
- Highlight reliability data. If your vehicle is a known slow depreciator — a Toyota Camry, Honda CR-V, or similar — say so in your listing. Link to reliability rankings or mention recent maintenance. Buyers of economy cars are often value-conscious researchers who respond to data.
Whichever segment you are in, the principle is the same: know your curve, price to the data, and time your sale to avoid the sharpest drops. The Depreciation Basics hub is a useful reference to revisit as you refine your pricing strategy.

All claims are backed by peer-reviewed research. Sources on request.