Key Takeaways
The Depreciation Curve
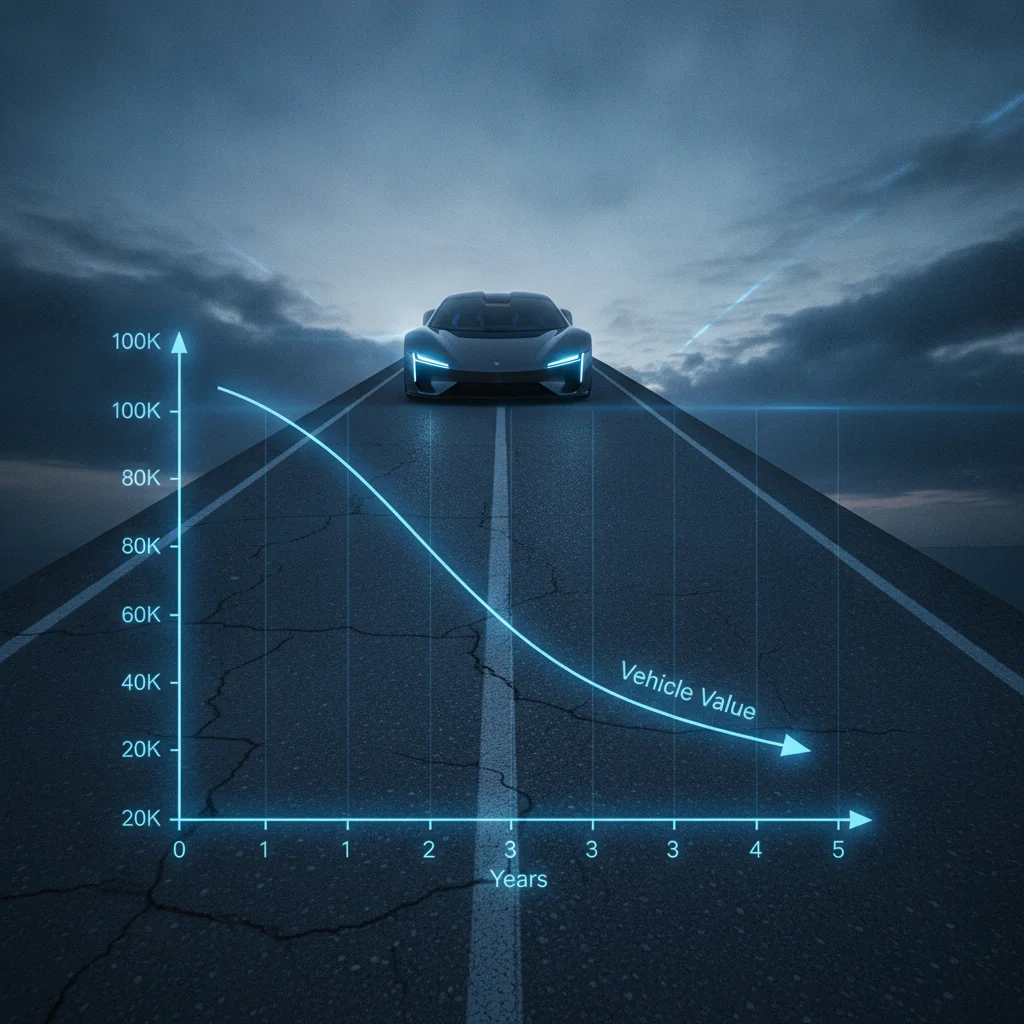
The depreciation curve is a visual and mathematical representation of how a vehicle loses market value over time. New cars depreciate fastest in the early years of ownership — especially year one — and the rate of loss slows as the car ages. Understanding this curve helps you time both your purchase and your sale to minimize the money you leave on the table.
Depreciation is typically modeled using an accelerated method — similar to a declining balance approach — where the largest value drops occur in the earliest periods. This contrasts with straight-line depreciation, which assumes equal annual losses.
Why the First Five Years Are the Ones That Cost You
If you want to understand where your money actually goes when you buy a new car, you have to look at the depreciation curve. Not the sticker price, not the monthly payment — the curve. It tells you the real story of what you're spending.
Here's the short version: the first five years of new-car ownership are when depreciation does the most financial damage. The losses aren't spread evenly over a car's life — they front-load. You pay the most in years one through three, and the rate of loss gradually moderates after that. By the time most cars hit year five, they've already shed 40–60% of their original MSRP.
For a $40,000 vehicle, that's a potential $16,000–$24,000 in lost value before you've even started thinking about selling. That number dwarfs most repair bills people worry about.
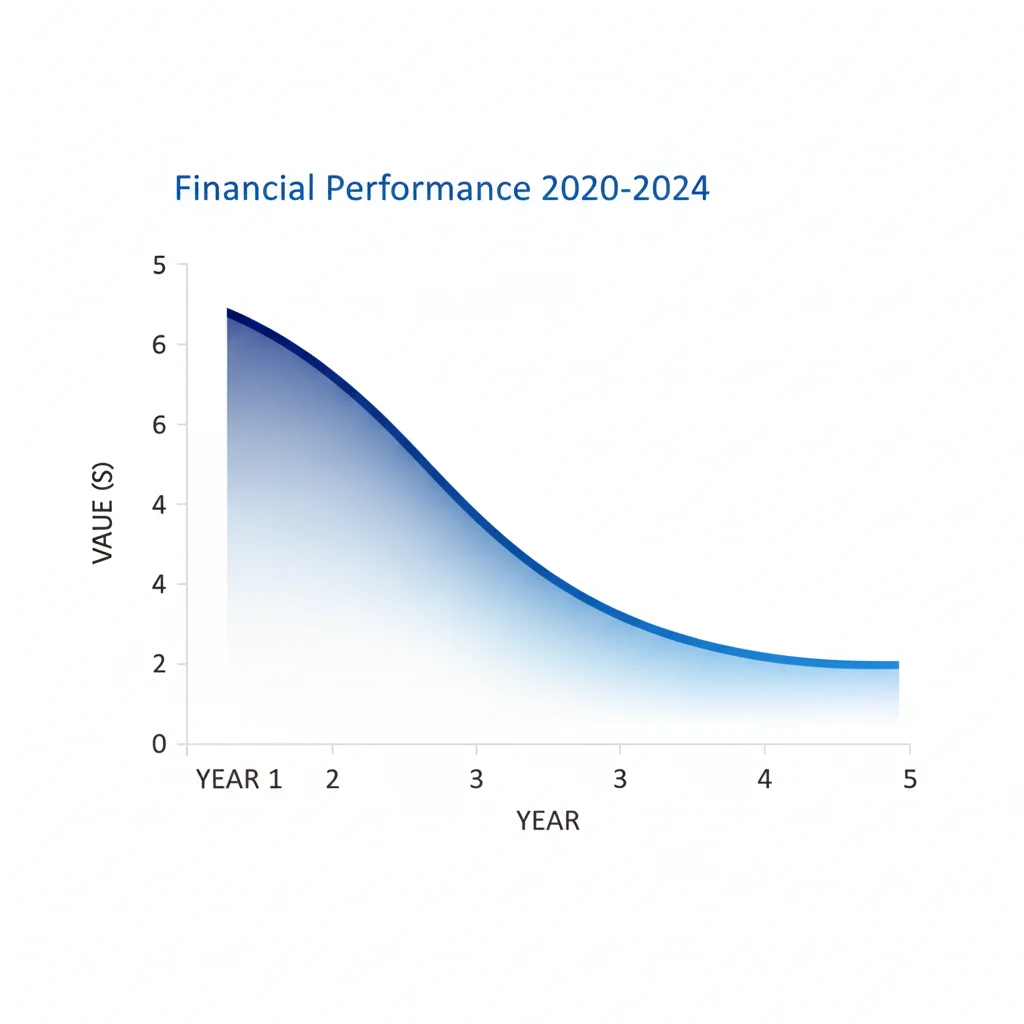
The good news is that once you understand how the curve works — and what influences its shape — you can use that knowledge to your advantage, whether you're buying, holding, or timing your next sale. We'll walk through each year, what's driving the drop, and what you can actually do about it.
For a broader look at how factors like age, mileage, and condition shape your car's trajectory, our depreciation basics hub is a good place to start.
Year One: The Biggest Drop Happens Before You've Made Your Second Payment
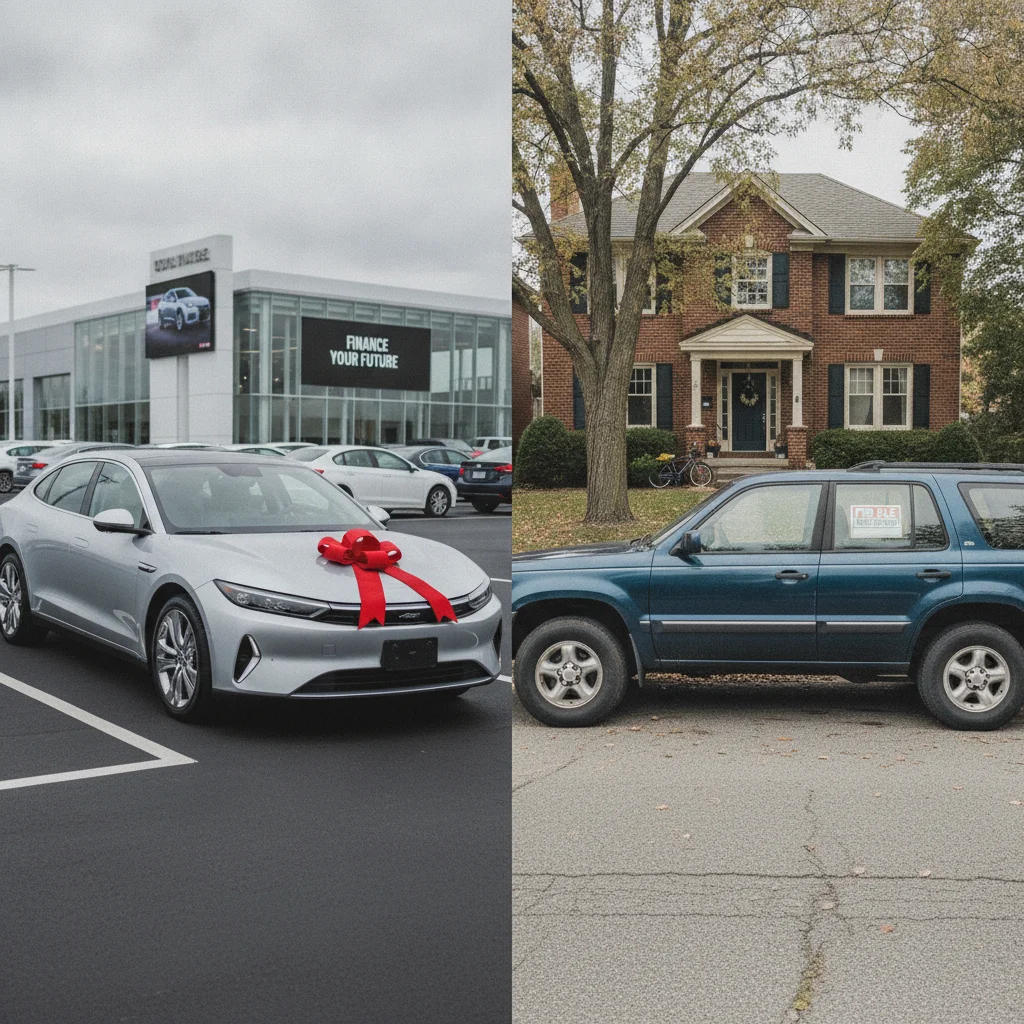
The most brutal depreciation hit isn't at the end of year one — it's in the first few hours of ownership. The moment a new car leaves the dealership lot, it's no longer classified as new. That reclassification alone costs you a chunk of value, often 5–10% before you've even driven a mile.
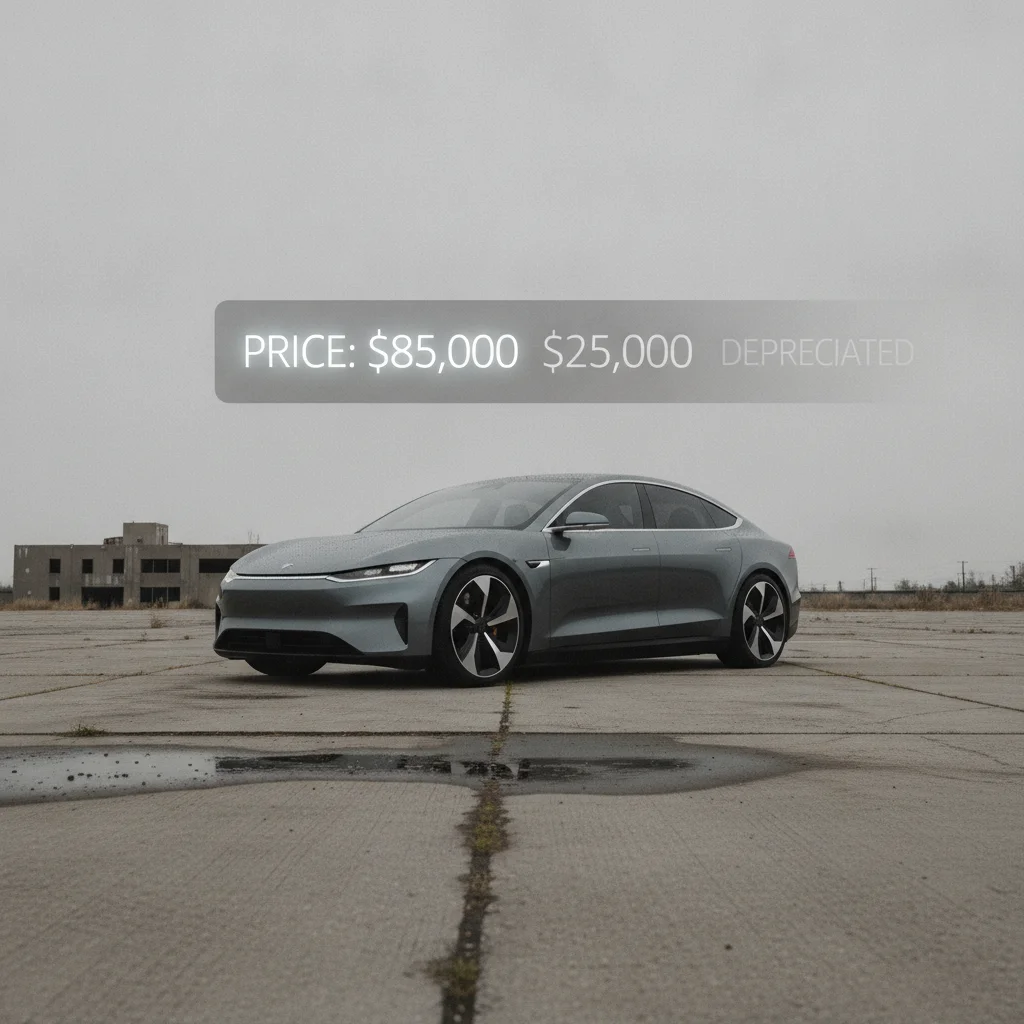
By the end of the first 12 months, the average vehicle has lost 15–20% of its purchase price. On a $45,000 car, that's $6,750 to $9,000 gone in the first year. Not from wear and tear — just from time and market categorization.
20%
Average first-year depreciation for new vehicles
Industry data from iSeeCars and Edmunds consistently shows the average new car loses 15–20% of its value in year one.
49%
Average value lost by year five of ownership
According to Carfax and industry depreciation studies, the average new vehicle retains roughly 51% of its original value after five years.
$11,000+
Average dollar loss in year one on a $50K vehicle
Based on the average 20–22% first-year depreciation rate applied to the median new car transaction price in recent years.
3–4 years
Sweet spot age for used car value
Consumer Reports and industry analysts consistently identify the 3–4 year age range as the point where depreciation slows and value-per-dollar peaks for used buyers.
5–10%
Annual depreciation rate after year five
Once a vehicle clears the first five years, depreciation rate typically drops to 5–10% per year of remaining value, according to industry valuation models.
A few things drive year-one losses this hard:
- The new/used reclassification: Dealers and private buyers both discount used cars versus new, regardless of condition.
- Insurance replacement values drop: Lenders and insurers recalibrate what the vehicle is worth almost immediately.
- New model-year competition: As soon as a new model year arrives, the prior year becomes less desirable — even if the changes are minimal.
Luxury vehicles often see even steeper first-year drops, because the premium buyers pay over function compounds the value-versus-cost gap. A $90,000 luxury sedan isn't necessarily $30,000 more reliable or durable than a $60,000 mainstream counterpart — but it depreciates as though that gap has to close quickly.
Market Conditions Can Temporarily Override the Curve
The used vehicle market during 2021–2023 saw used car prices spike dramatically due to inventory shortages, briefly causing some vehicles to appreciate. These conditions are historically unusual and have since normalized. The depreciation curve is a long-term average — short-term market disruptions can cause temporary deviations in either direction.
Depreciation Doesn't Equal Your Actual Loss
Depreciation measures the drop in market value — not necessarily what you're "losing" in a practical sense. If you paid $30,000, drove the car for five years, and sell for $16,000, you've paid $14,000 for five years of transportation. Whether that's a good deal depends entirely on what you got out of those years, your maintenance costs, and what alternatives existed. Put depreciation in context.
Electric Vehicles Have a Different Depreciation Profile
EVs, particularly early models and those from brands without strong resale track records, have shown steeper early depreciation in many cases. Battery technology uncertainty and rapidly evolving product cycles make used EV valuation more volatile than traditional internal combustion vehicles. Factor this in carefully if you're buying or selling an EV in the first three to five years.
Some vehicles, particularly trucks, popular SUVs, and limited-production models, can temporarily resist first-year depreciation — or even appreciate — when demand outpaces supply. But these are exceptions and rarely last beyond the first cycle of normal inventory levels.
Years Two and Three: The Curve Steepens Further
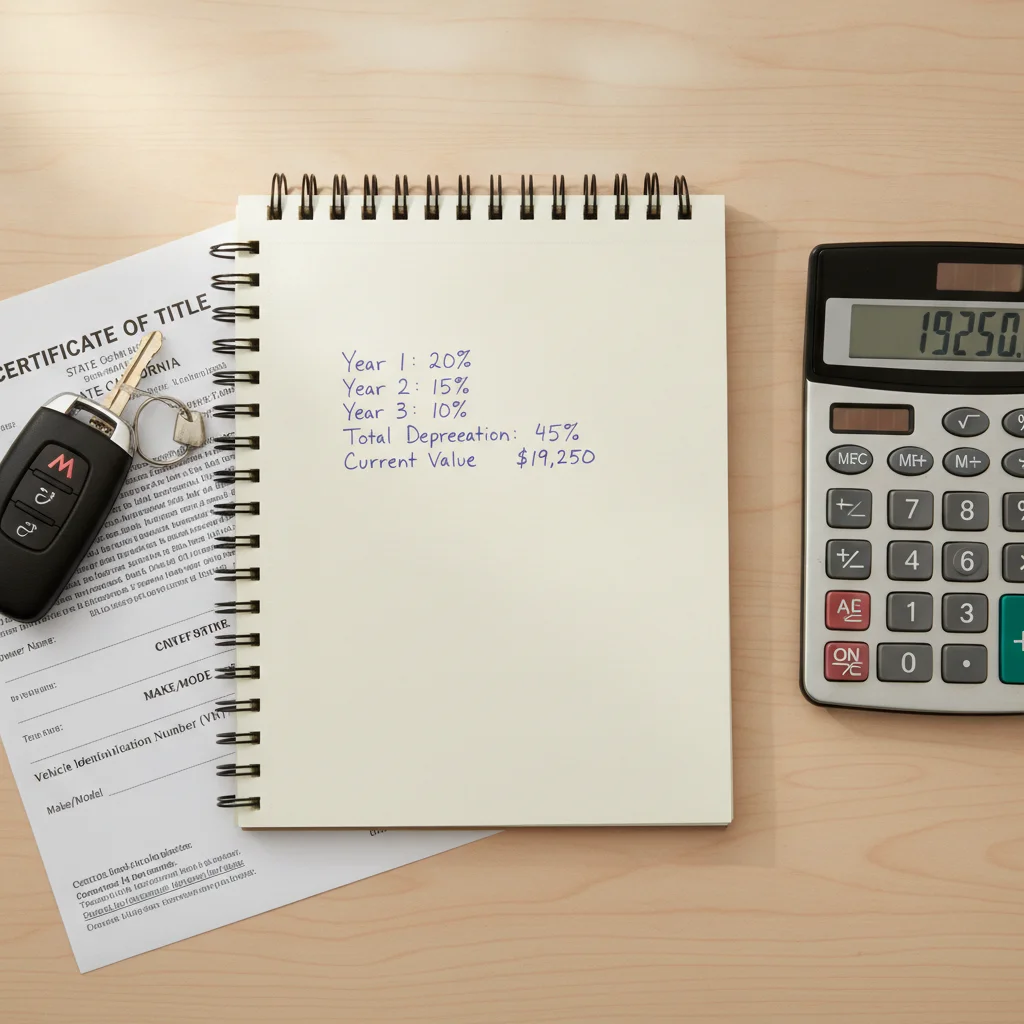
Year one is rough. Years two and three aren't much better — and together, they often account for another 15–25% in cumulative additional losses. By the end of year three, a typical vehicle has lost 40–50% of its original value. That's roughly half of what you paid, gone in 36 months.
What's happening here? A few converging factors:
- Mileage accumulates: Most drivers put on 12,000–15,000 miles per year. By year three, you're at 36,000–45,000 miles — enough to make many buyers pause and push toward a lower-mileage option.
- Warranty coverage narrows: Standard factory bumper-to-bumper warranties are often 3 years/36,000 miles. Once a car approaches or passes that threshold, buyers discount it to offset perceived future repair risk.
- Newer competitors enter the market: Three model years have passed. Updated trims, new tech features, and redesigned competitors make the vehicle feel dated, suppressing buyer interest.
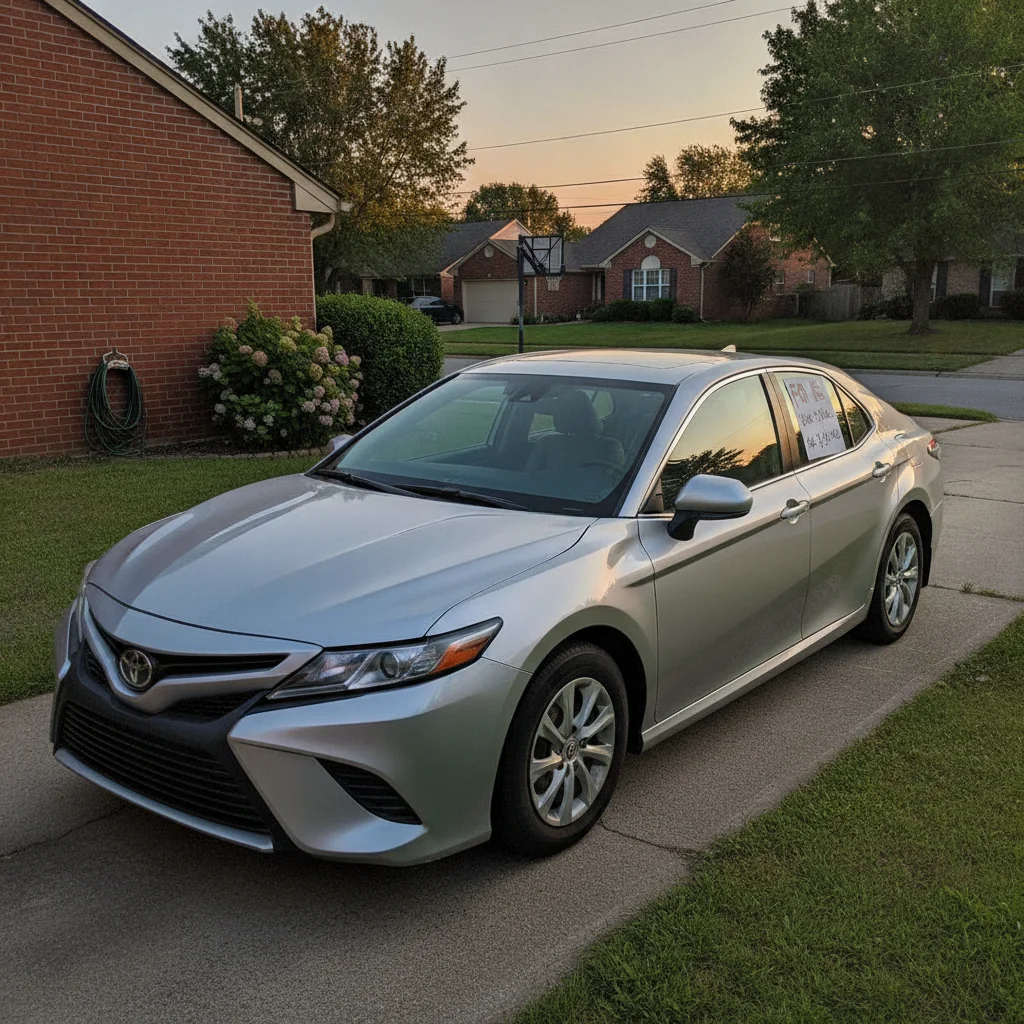
This is exactly why buying new versus used changes your depreciation risk profile so dramatically. A buyer purchasing that same vehicle at the two- or three-year mark absorbs none of those early losses — but they also benefit from everything that original buyer paid to improve and maintain it.
Lock In Your Records From Day One
Start a simple folder — paper or digital — the day you buy the car. Drop in every oil change receipt, inspection report, and service record. When you go to sell in year four or five, that documentation can add hundreds or even thousands of dollars to your negotiating position. Buyers pay for certainty.
Check Residual Values Before You Buy
Before committing to a new vehicle purchase, look up its projected residual value at 36 and 60 months. Manufacturers publish these for lease pricing, and they give you a realistic preview of where the car will sit on the depreciation curve. A model with a strong residual percentage loses less value — which matters whether you lease, finance, or plan to sell.
Time Your Sale Before Major Service Milestones
If your car is approaching a big maintenance interval — like a timing belt, transmission service, or major fluid flush — consider selling before that service is due. Buyers will factor those upcoming costs into their offer regardless. Selling just before a high-mileage milestone can preserve your asking price without requiring you to pay for work that benefits the next owner.
For a detailed year-by-year breakdown, this breakdown of vehicle depreciation from year one to year ten gives you exact typical percentage drops at each ownership milestone.
Years Four and Five: The Curve Finally Begins to Flatten
By year four, the worst of the depreciation damage is done. Annual value loss slows to roughly 10–15% of remaining value per year — still meaningful, but significantly less punishing than years one through three. By the end of year five, most vehicles are sitting at 40–60% of their original MSRP, depending on brand and segment.
This flattening happens for straightforward reasons. The market for 4–5 year old vehicles is large and relatively stable. Buyers shopping in this range are typically more value-conscious, and prices adjust to meet a broad, price-sensitive pool of demand.
“Depreciation is the single largest cost of car ownership for most people — it just doesn't feel like a cost because there's no bill in your mailbox. But it's real money leaving your pocket every month the car sits in your driveway.”
— Philip Reed, Senior Consumer Advice Editor, Edmunds
Year four and five are also when ownership decisions start to branch in meaningful ways:
- Sellers/traders: This window is often ideal for offloading. You retain enough value to use as a meaningful down payment, but depreciation has decelerated enough that waiting another year doesn't punish you as severely as it would have in year two.
- Keepers: If you're planning to hold the car past 100,000 miles, year four and five are where the math shifts in favor of keeping. Your cost per mile drops sharply once the big depreciation is absorbed and you've paid off the loan.
Knowing where your specific vehicle lands on this curve matters. Tools like KBB and Edmunds track real transaction data, and understanding how valuation tools work helps you interpret those numbers in context rather than treating them as gospel.
What Moves the Curve: Factors That Accelerate or Slow Depreciation
The average curve gives you a useful baseline, but individual vehicles deviate from it — sometimes dramatically. Here's what actually moves the needle:
Brand and Model Reputation
Toyota, Honda, and Subaru consistently outperform the depreciation average. Their reputations for reliability sustain buyer demand even as vehicles age. On the opposite end, certain domestic sedans and off-brand luxury vehicles drop faster because resale demand is structurally weaker.
Segment and Body Style
Trucks and body-on-frame SUVs have historically held value better than cars. Sedans, especially mid-size and full-size, have taken significant hits as American buyer preferences shifted toward crossovers and trucks. Minivans occupy an odd middle ground — they serve a specific buyer, and when that buyer wants one, they want a used one.
Mileage Relative to Age
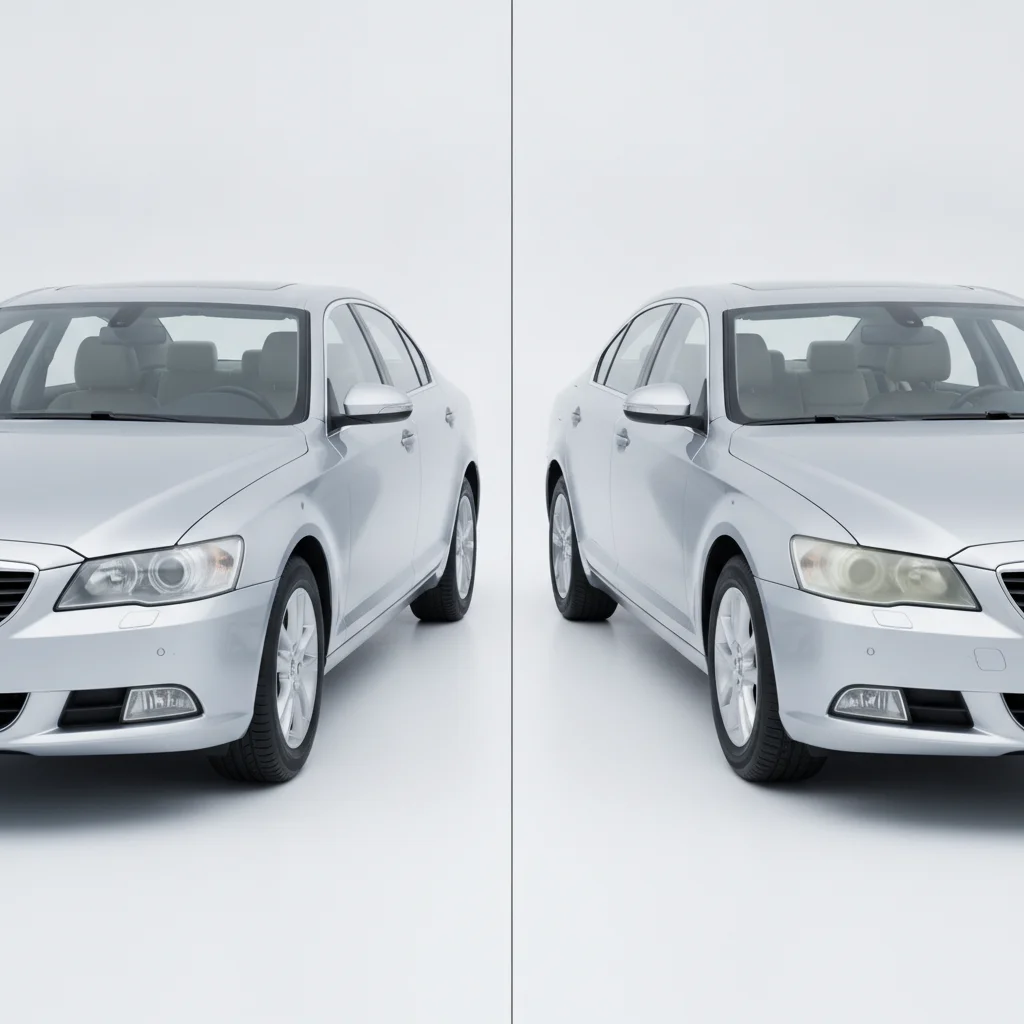
High mileage accelerates the curve. Low mileage can meaningfully slow it. A 4-year-old vehicle with 20,000 miles will command a notable premium over one with 65,000 miles, all else being equal. This is one area where maintenance habits show up clearly in the numbers.
Condition and Maintenance Records
A well-documented service history — oil changes, tire rotations, inspections — signals to buyers that the vehicle has been cared for. It doesn't completely offset mileage or age, but it slows the slide. A car with records typically sells faster and for more than a comparable vehicle with no paperwork trail.
Color and Configuration
It sounds superficial, but unusual colors and stripped-down or oddly configured trims depreciate faster. Neutral colors (white, silver, gray, black) and popular feature packages hold value better because they appeal to a broader buyer pool.
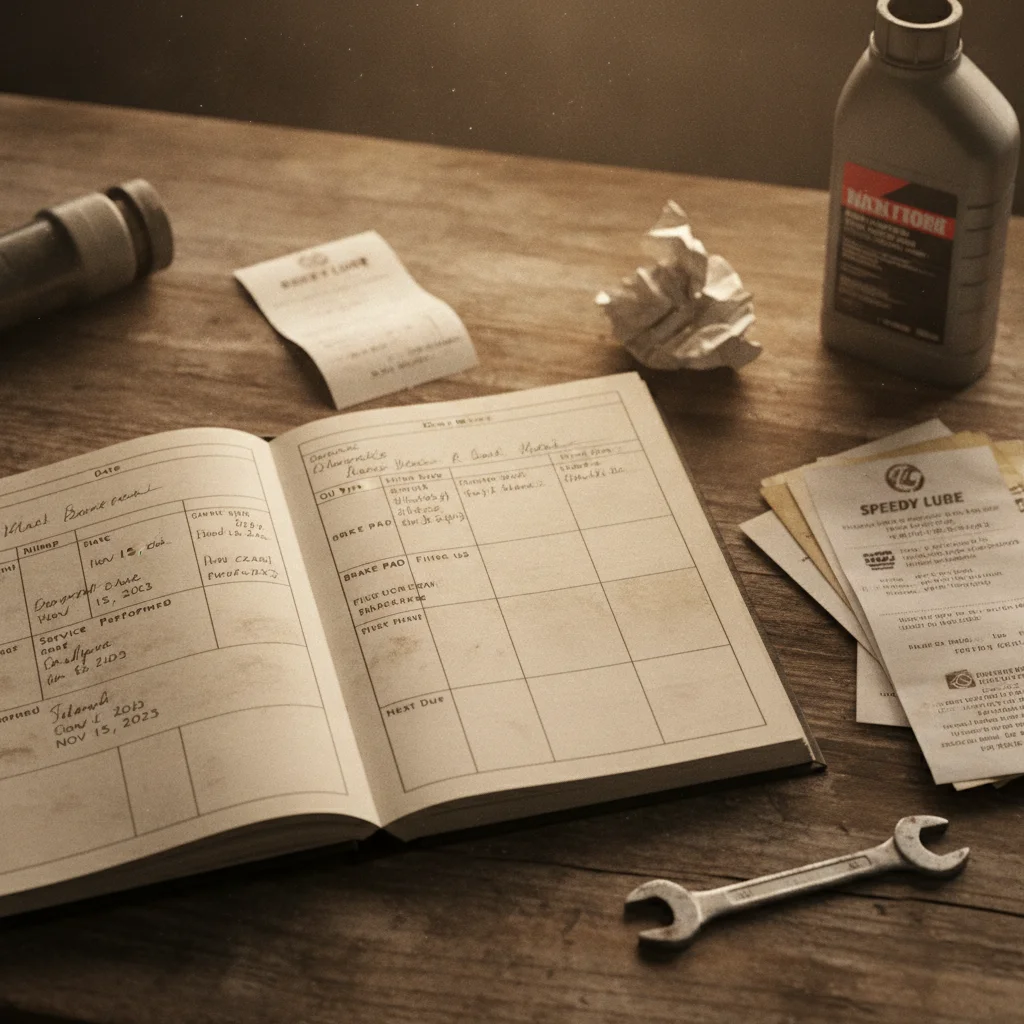
If you want to understand the math behind any of this, this practical walkthrough on calculating your car's depreciation shows you how to run real numbers on your own vehicle.
Market Conditions Can Temporarily Override the Curve
The used vehicle market during 2021–2023 saw used car prices spike dramatically due to inventory shortages, briefly causing some vehicles to appreciate. These conditions are historically unusual and have since normalized. The depreciation curve is a long-term average — short-term market disruptions can cause temporary deviations in either direction.
Depreciation Doesn't Equal Your Actual Loss
Depreciation measures the drop in market value — not necessarily what you're "losing" in a practical sense. If you paid $30,000, drove the car for five years, and sell for $16,000, you've paid $14,000 for five years of transportation. Whether that's a good deal depends entirely on what you got out of those years, your maintenance costs, and what alternatives existed. Put depreciation in context.
Electric Vehicles Have a Different Depreciation Profile
EVs, particularly early models and those from brands without strong resale track records, have shown steeper early depreciation in many cases. Battery technology uncertainty and rapidly evolving product cycles make used EV valuation more volatile than traditional internal combustion vehicles. Factor this in carefully if you're buying or selling an EV in the first three to five years.
How to Use the Depreciation Curve to Your Advantage
Understanding the curve isn't just academic — there are concrete decisions you can make right now that directly affect your financial outcome.
If You're Buying New
Go in with clear eyes. You're paying a premium for first-ownership status, the full warranty, and the ability to configure exactly what you want. Those things have real value for some buyers. But don't confuse that value with a financial investment — you're not buying an appreciating asset. Plan your ownership horizon accordingly. If you're going to sell in two years, you'll absorb the steepest losses. If you're planning to own it for eight to ten years, first-year depreciation matters far less in your total cost-per-mile math.
If You're Buying Used
Targeting a 2–4 year old vehicle puts you past the steepest section of the curve while still getting a vehicle with substantial remaining life. For most buyers, this is the best financial trade-off. If you're still evaluating new vehicles, look for models with consistently low five-year ownership costs — some narrow the used-car advantage considerably.
If You're Selling or Trading In
Years three through five tend to represent the best window. You're past the worst of the depreciation damage, and you still have enough equity to work with. Beyond year six or seven, value stabilizes but continues to erode, and repair costs begin rising — a combination that gradually erodes the financial case for selling and reinvesting.
Lock In Your Records From Day One
Start a simple folder — paper or digital — the day you buy the car. Drop in every oil change receipt, inspection report, and service record. When you go to sell in year four or five, that documentation can add hundreds or even thousands of dollars to your negotiating position. Buyers pay for certainty.
Check Residual Values Before You Buy
Before committing to a new vehicle purchase, look up its projected residual value at 36 and 60 months. Manufacturers publish these for lease pricing, and they give you a realistic preview of where the car will sit on the depreciation curve. A model with a strong residual percentage loses less value — which matters whether you lease, finance, or plan to sell.
Time Your Sale Before Major Service Milestones
If your car is approaching a big maintenance interval — like a timing belt, transmission service, or major fluid flush — consider selling before that service is due. Buyers will factor those upcoming costs into their offer regardless. Selling just before a high-mileage milestone can preserve your asking price without requiring you to pay for work that benefits the next owner.
If You're Keeping the Car Long-Term
Focus your energy on maintenance. A car that reaches year eight in good shape has absorbed the full depreciation curve but still has value — both in use and eventually in resale. Keep records, address small problems before they become big ones, and consider that at some point, you're driving effectively depreciation-free.
If you want to see how the model extends beyond the first five years, the full depreciation curve across a car's lifetime shows what the slope looks like all the way through year ten and beyond.
20%
Average first-year depreciation for new vehicles
Industry data from iSeeCars and Edmunds consistently shows the average new car loses 15–20% of its value in year one.
49%
Average value lost by year five of ownership
According to Carfax and industry depreciation studies, the average new vehicle retains roughly 51% of its original value after five years.
$11,000+
Average dollar loss in year one on a $50K vehicle
Based on the average 20–22% first-year depreciation rate applied to the median new car transaction price in recent years.
3–4 years
Sweet spot age for used car value
Consumer Reports and industry analysts consistently identify the 3–4 year age range as the point where depreciation slows and value-per-dollar peaks for used buyers.
5–10%
Annual depreciation rate after year five
Once a vehicle clears the first five years, depreciation rate typically drops to 5–10% per year of remaining value, according to industry valuation models.
The Bottom Line on Five-Year Depreciation
The depreciation curve doesn't lie. Most of the financial cost of new-car ownership isn't in fuel, insurance, or repairs — it's in the value that evaporates quietly while the car sits in your driveway aging. Knowing that the first five years are where the steepest losses happen gives you the information you need to make a smarter call at every stage: when to buy, what to buy, and when to sell.
You're not going to eliminate depreciation — it's baked into how consumer vehicles work. But you can stop being surprised by it, stop letting it happen to you passively, and start using it as a planning tool. That shift in mindset is worth real money over a lifetime of car ownership.
For side-by-side comparisons of how different depreciation models reflect real-world value loss, this breakdown of straight-line versus accelerated depreciation is worth reading before you run your own numbers.
Market Conditions Can Temporarily Override the Curve
The used vehicle market during 2021–2023 saw used car prices spike dramatically due to inventory shortages, briefly causing some vehicles to appreciate. These conditions are historically unusual and have since normalized. The depreciation curve is a long-term average — short-term market disruptions can cause temporary deviations in either direction.
Depreciation Doesn't Equal Your Actual Loss
Depreciation measures the drop in market value — not necessarily what you're "losing" in a practical sense. If you paid $30,000, drove the car for five years, and sell for $16,000, you've paid $14,000 for five years of transportation. Whether that's a good deal depends entirely on what you got out of those years, your maintenance costs, and what alternatives existed. Put depreciation in context.
Electric Vehicles Have a Different Depreciation Profile
EVs, particularly early models and those from brands without strong resale track records, have shown steeper early depreciation in many cases. Battery technology uncertainty and rapidly evolving product cycles make used EV valuation more volatile than traditional internal combustion vehicles. Factor this in carefully if you're buying or selling an EV in the first three to five years.

All claims are backed by peer-reviewed research. Sources on request.