| Full-Size Truck 3-Year Retention | 65–75% of MSRP (iSeeCars & Black Book industry averages, 2023–2024) |
| Midsize Sedan 3-Year Retention | 45–55% of MSRP (Edmunds True Market Value data, 2023) |
| Compact Crossover 3-Year Retention | 55–65% of MSRP (iSeeCars depreciation study, 2024) |
| Luxury Sedan (European) 3-Year Retention | 45–52% of MSRP (NADA and CarGurus market analysis, 2023) |
| Non-Tesla EV 3-Year Retention | 40–55% of MSRP (iSeeCars EV depreciation report, 2024) |
| Toyota 4Runner 5-Year Retention | ~70–75% of MSRP (Consistently among top 5 retained vehicles, iSeeCars 2024) |
| Fastest Depreciating Segment | Non-Tesla Electric Vehicles (iSeeCars 5-year depreciation rankings, 2024) |
| Slowest Depreciating Segment | Full-Size Pickup Trucks (Black Book residual value data, 2023–2024) |
Why Depreciation Curves Aren't One-Size-Fits-All
A lot of buyers treat depreciation like a flat tax on car ownership — some fixed percentage that applies equally to everything on the lot. That's a costly misunderstanding. A three-year-old full-size pickup might still command 70–75% of its original MSRP in a strong truck market. A three-year-old midsize sedan from an average brand might be sitting at 50–55%. The difference isn't trivial — it can mean thousands of dollars in either direction depending on which side of the transaction you're on.
The underlying mechanics come down to supply, demand, and perceived utility. Segments where buyers consistently outnumber available used inventory hold value better. Segments with bloated lease return volumes, softening consumer interest, or a reputation for high repair costs tend to slide faster. Understanding these patterns lets you buy smarter — either targeting fast-depreciating vehicles for maximum value, or paying a slight premium for a segment with strong resale stability.
For a foundational look at how any car's value drops year by year before you even consider segment differences, see how depreciation curves work across a car's lifetime.
| Full-Size Truck 3-Year Retention | 65–75% of MSRP (iSeeCars & Black Book industry averages, 2023–2024) |
| Midsize Sedan 3-Year Retention | 45–55% of MSRP (Edmunds True Market Value data, 2023) |
| Compact Crossover 3-Year Retention | 55–65% of MSRP (iSeeCars depreciation study, 2024) |
| Luxury Sedan (European) 3-Year Retention | 45–52% of MSRP (NADA and CarGurus market analysis, 2023) |
| Non-Tesla EV 3-Year Retention | 40–55% of MSRP (iSeeCars EV depreciation report, 2024) |
| Toyota 4Runner 5-Year Retention | ~70–75% of MSRP (Consistently among top 5 retained vehicles, iSeeCars 2024) |
| Fastest Depreciating Segment | Non-Tesla Electric Vehicles (iSeeCars 5-year depreciation rankings, 2024) |
| Slowest Depreciating Segment | Full-Size Pickup Trucks (Black Book residual value data, 2023–2024) |
Trucks and Body-on-Frame SUVs: The Slow Depreciators
Full-size pickups — think Ford F-150, Chevrolet Silverado, Ram 1500 — are the most reliable value-holders in the used market. In a normal inventory environment, a well-specified two- to three-year-old half-ton truck retains 65–75% of its original value. At five years out, you're often still looking at 55–65%. That's exceptional compared to virtually any other segment.
Why do trucks hold so well? A few compounding reasons:
- Utility-driven demand: Buyers who need a truck for towing, hauling, or work purposes don't have many substitutes. That inelastic demand keeps resale prices elevated.
- Limited lease volume: Trucks are leased far less frequently than sedans or crossovers, so the used market doesn't get flooded with off-lease returns every three years the way other segments do.
- Powertrain longevity: Well-maintained truck engines regularly hit 200,000+ miles, which extends the useful life buyers are willing to pay for.
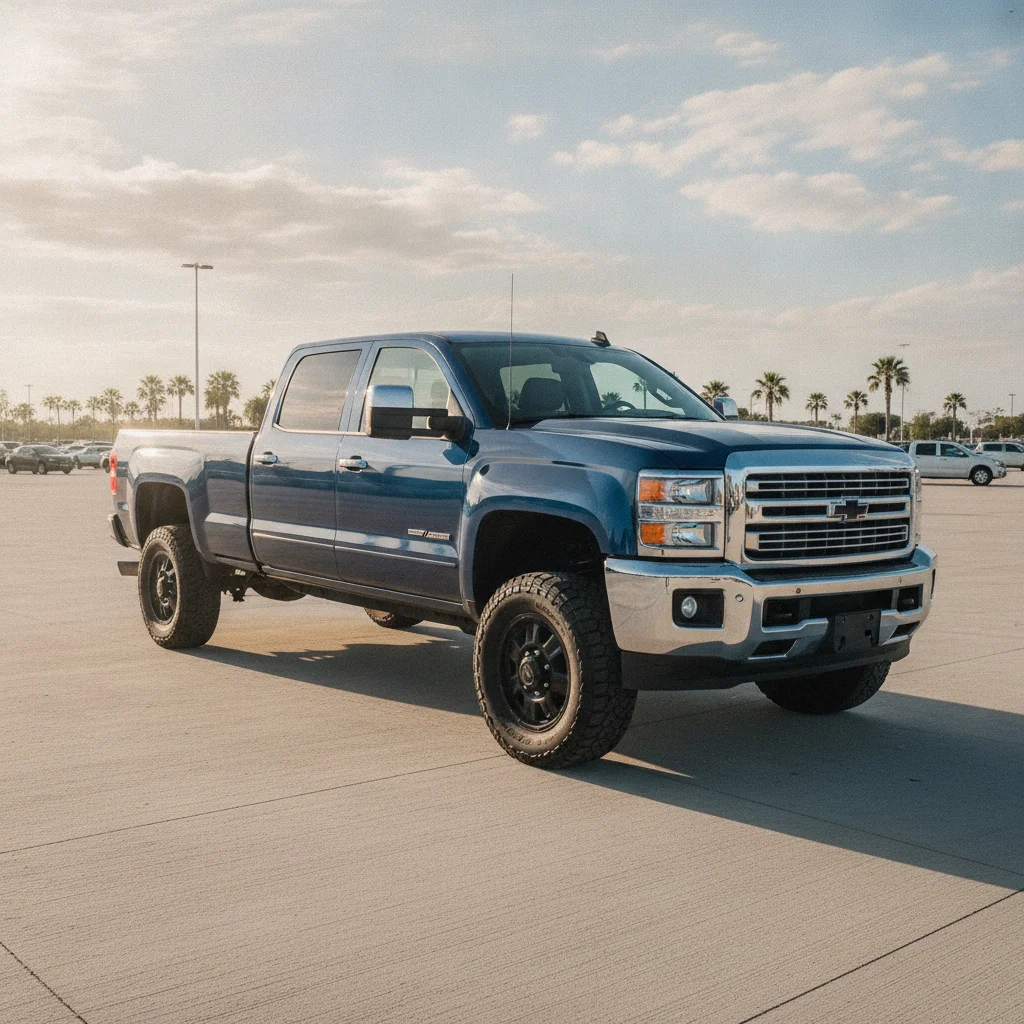
Body-on-frame SUVs (Tahoe, Suburban, Expedition, 4Runner) follow a similar pattern, though they're slightly more volatile. The 4Runner in particular has developed near-cult resale status — five-year-old examples often hold 70–75% of original MSRP because Toyota's reputation for durability intersects with limited supply. Compare that to a domestic three-row SUV, which might be at 55–60% at the same age.
The practical takeaway for buyers: don't expect a bargain on used trucks and body-on-frame SUVs. These vehicles' depreciation curves are shallow. If your budget is tight and you need a truck, buying older (6–8 years) is often the only path to genuine value without compromising too much on condition.
To see how brand and segment reputation shape these outcomes, read about slow vs. fast depreciators and what separates them.
Crossover SUVs: The Middle Ground
Crossovers are the most popular vehicle type sold in America, and that popularity cuts both ways on the used market. High volume means consistent demand, but it also means consistent supply — particularly from lease returns, which flood the 2–3 year used market every cycle.
65–75%
Value retained by full-size trucks at 3 years
Full-size pickups consistently outperform every other segment in resale value retention, according to iSeeCars 2024 data.
~$9,000
Average used crossover premium over comparable sedan
Buyers pay a significant premium for crossover body style over functionally similar sedan platforms, per Edmunds market analysis.
50–60%
Value lost by some non-Tesla EVs in 3 years
Early-generation non-Tesla EVs showed some of the steepest depreciation of any segment, per iSeeCars EV depreciation report, 2024.
$25,000–$30,000
Typical dollar loss on European luxury sedan in 3 years
High MSRP combined with aggressive lease programs drives outsized absolute dollar depreciation in the European luxury segment.
10–15%
Resale gap between Japanese and European luxury brands
Lexus and Acura consistently retain 10–15 percentage points more value than BMW and Mercedes-Benz at equivalent age, per NADA data.
A compact crossover — CR-V, RAV4, Escape — typically retains 55–65% of its value at three years. Japanese-branded examples (RAV4, CR-V, Forester) consistently sit at the higher end of that range; domestic and Korean brands tend to land lower, though Hyundai and Kia have closed the gap considerably over the past decade due to improved reliability scores.
Midsize crossovers (Pilot, Explorer, Highlander, Traverse) show slightly more variation. The Highlander holds close to compact Japanese crossover rates. The Traverse and Explorer historically depreciate a bit faster — around 45–55% retained at three years — partly due to higher base MSRPs and larger lease return volumes.
Where Crossovers Get Complicated: Three-Row Models
Three-row crossovers occupy a specific use case: families who want SUV-like seating without body-on-frame towing capacity. The demand is real but narrower than two-row crossovers. Combined with the fact that three-row crossovers tend to carry higher MSRPs, you often get steeper percentage drops in the first 1–3 years, followed by steadier resale performance once the initial depreciation cliff passes.
For buyers, the 3–4 year mark on a mainstream Japanese crossover is often the sweet spot — you've captured most of the initial depreciation without yet hitting the higher-mileage maintenance inflection point where repair costs start to rise.
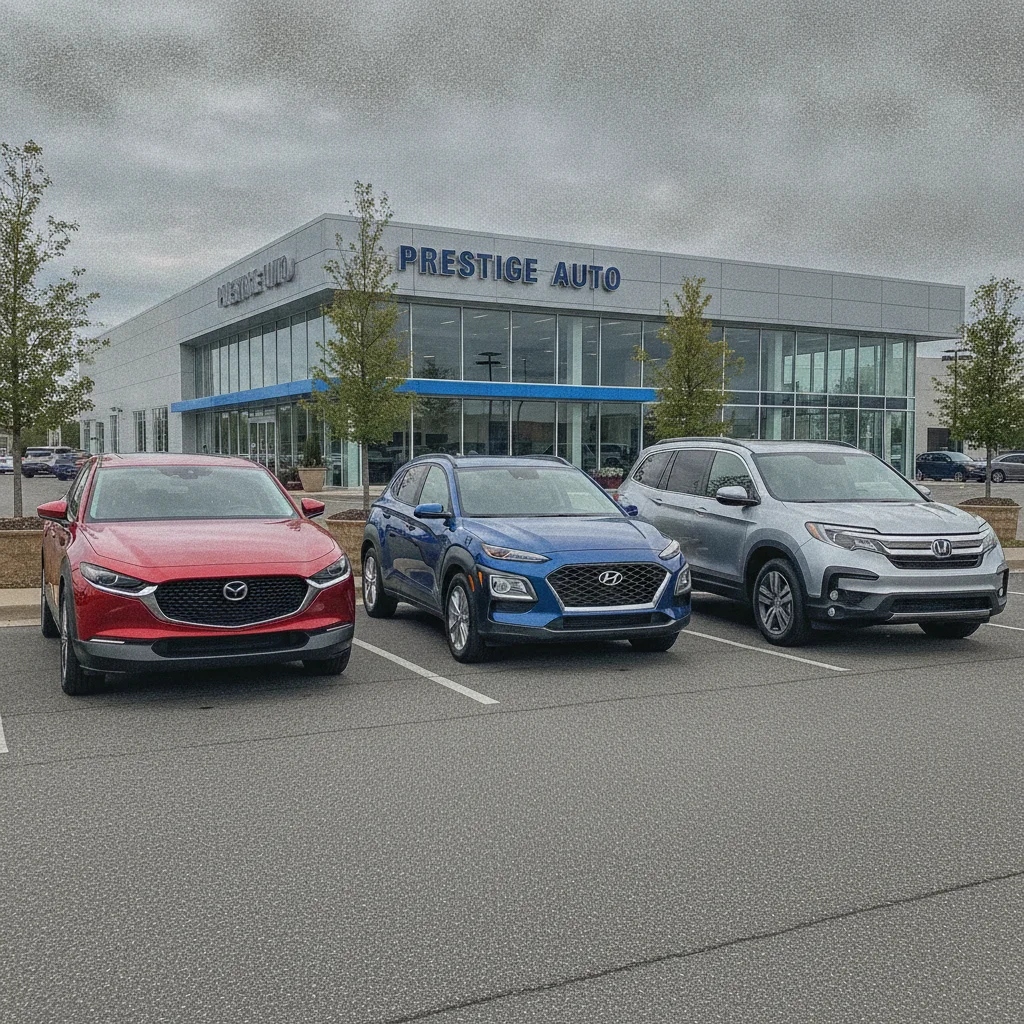
See depreciation rate benchmarks by vehicle category for numeric ranges you can use to anchor your crossover pricing expectations.
Sedans and Hatchbacks: Fast Drops, Genuine Bargains
Sedans have taken a beating in the market for years. Consumer preference has shifted hard toward crossovers and trucks, which means sedan trade-ins and lease returns pile up faster than the market can absorb them at high prices. The result: midsize and compact sedans depreciate significantly faster than crossovers, even when the underlying vehicle is mechanically comparable.
A typical midsize sedan — Camry, Accord, Fusion, Altima — loses 40–55% of its MSRP in the first three years. At five years, you're often looking at 35–45% retained value. The Camry and Accord hold better than average; the Fusion and older-generation Nissan products drop faster. Full-size sedans (Chrysler 300, Dodge Charger/Challenger in non-enthusiast trims) often fall even further.
The Sedan Value Window Is Real — But Fleeting
The best used sedan deals tend to appear in the 2–4 year range when off-lease volume peaks and dealer lots are well-stocked. As sedans age past 6–7 years, supply tightens again because fewer were sold new, and per-mile value often increases relative to the mid-age glut. If you're sedan shopping, act during that supply peak rather than waiting for further price drops that may not materialize.
Used EV Tax Credit Changes the Math
The federal used EV tax credit — up to $7,500 for qualifying vehicles under $25,000 — effectively raises the purchase floor for many older EVs. Before concluding a used EV is underpriced, factor in whether you qualify for the credit, which requires income limits and dealer enrollment in the IRS program. The credit can make what looks like a mediocre deal into a genuinely strong one.
Market Conditions Shift These Ranges
The depreciation percentages cited throughout this article reflect typical conditions in a balanced used car market. During supply disruptions — such as the inventory shortages seen in 2021–2022 — used vehicle values across all segments deviated dramatically from historical norms. Always cross-reference current listings on Carfax, Autotrader, and CarGurus rather than relying solely on historical benchmarks.
For buyers, this is where you can find real value — especially if you're flexible about body style. A three-year-old Accord with 30,000 miles might cost $8,000–$10,000 less than a three-year-old CR-V with comparable specs, even though they share the same platform, engines, and reliability profile. You're essentially paying a premium for the crossover body style itself.
Economy Sedans: Even Steeper Drops
Subcompact and economy sedans (Civic, Corolla, Elantra, Sentra) depreciate faster in percentage terms than their midsize siblings, partly because their MSRPs are lower to begin with, leaving less dollar-value headroom. A three-year-old Corolla might retain 55–60% — that's healthy in percentage terms — but the absolute dollar savings versus new are smaller. Economy car depreciation vs. luxury car depreciation covers this dynamic in detail if you're comparing segments by absolute dollar loss versus percentage loss.
Hatchbacks tend to hold slightly better than comparable sedans due to cargo flexibility adding functional appeal. European hatchbacks (Golf, Mazda3 hatch) often see stronger resale than equivalent American-market sedans, though total units sold in the US remain lower.
Luxury Cars: Big Dollar Drops, Sometimes Remarkable Deals
Luxury vehicles have notoriously steep first-three-year depreciation curves. A $65,000 German luxury sedan can shed $25,000–$30,000 in value by year three — a 40–45% loss in absolute dollars that leaves the buyer sitting on a rapidly depreciating asset. The combination of high MSRP, aggressive lease programs flooding the used market with off-lease returns, and expensive out-of-warranty repair costs create a triple drag on resale.
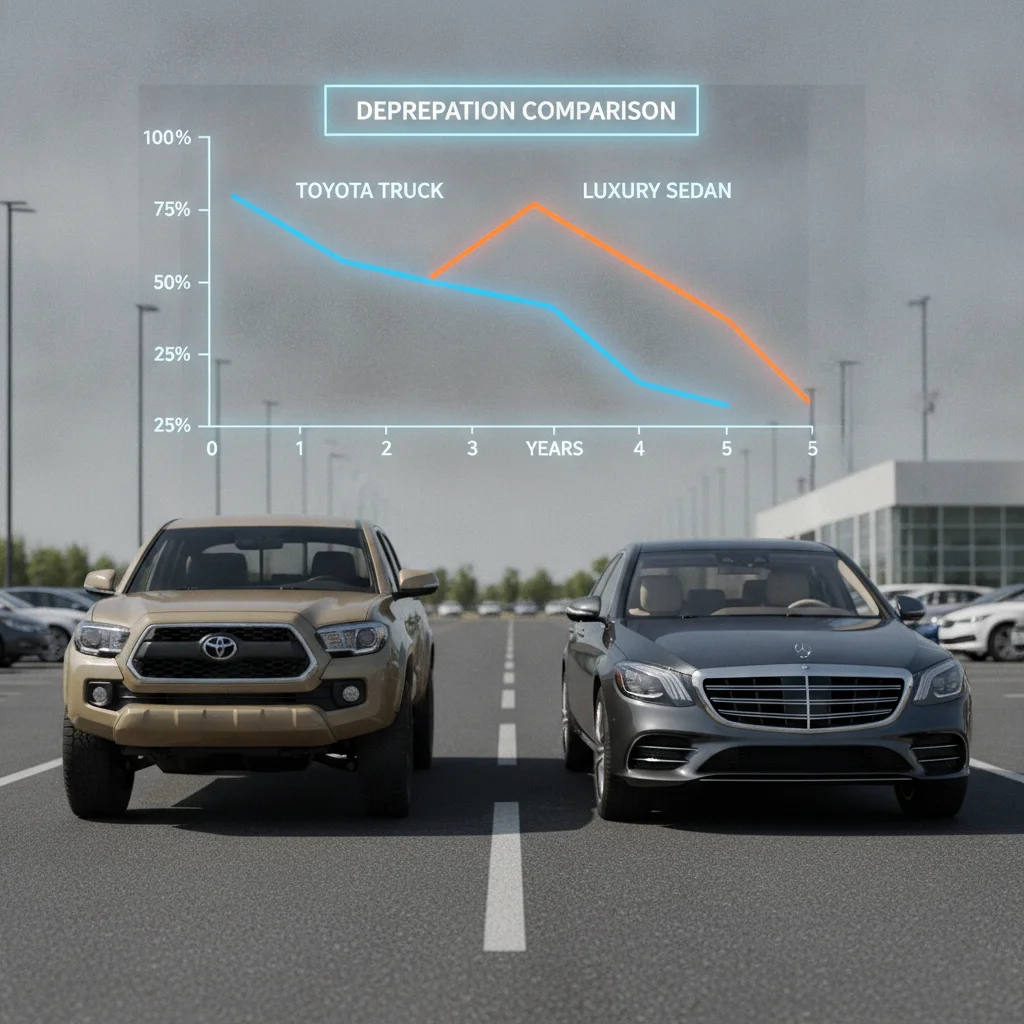
European luxury brands (BMW, Mercedes-Benz, Audi) consistently depreciate faster than their Japanese counterparts (Lexus, Acura, Infiniti). A 3-year-old BMW 5 Series might retain 45–52% of MSRP; a Lexus ES at the same age might be at 55–62%. That gap is primarily reliability-driven — ownership cost perception matters enormously in the luxury segment.
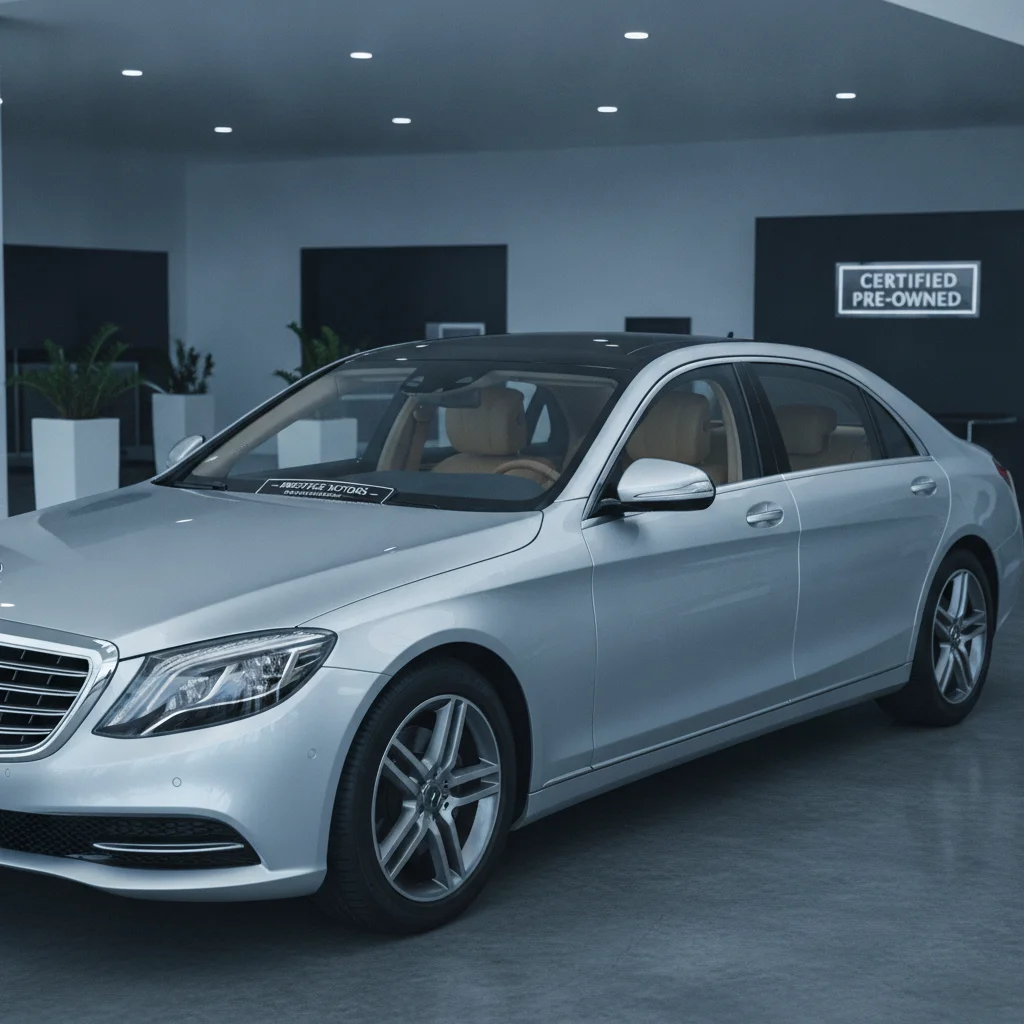
For buyers, the math on certified pre-owned luxury can be compelling: you get most of the features of a new luxury car, with the steep first-ownership depreciation already absorbed by the original buyer. The caveat is post-warranty maintenance costs, which can be substantial on European makes. Do your homework on expected service costs before assuming a low purchase price equals low total cost of ownership.
Sports cars and performance vehicles occupy their own niche. Some hold value exceptionally well (Porsche 911, Toyota Supra, Ford Bronco Raptor), while mass-market sport coupes depreciate sharply once the novelty wears off. See how sports cars compare to other segments for a more detailed breakdown.
The reliability-resale connection is significant: a vehicle's reliability reputation directly shapes its depreciation rate — a pattern that's nowhere more visible than in the gap between Japanese and European luxury brands.
Depreciation Curve
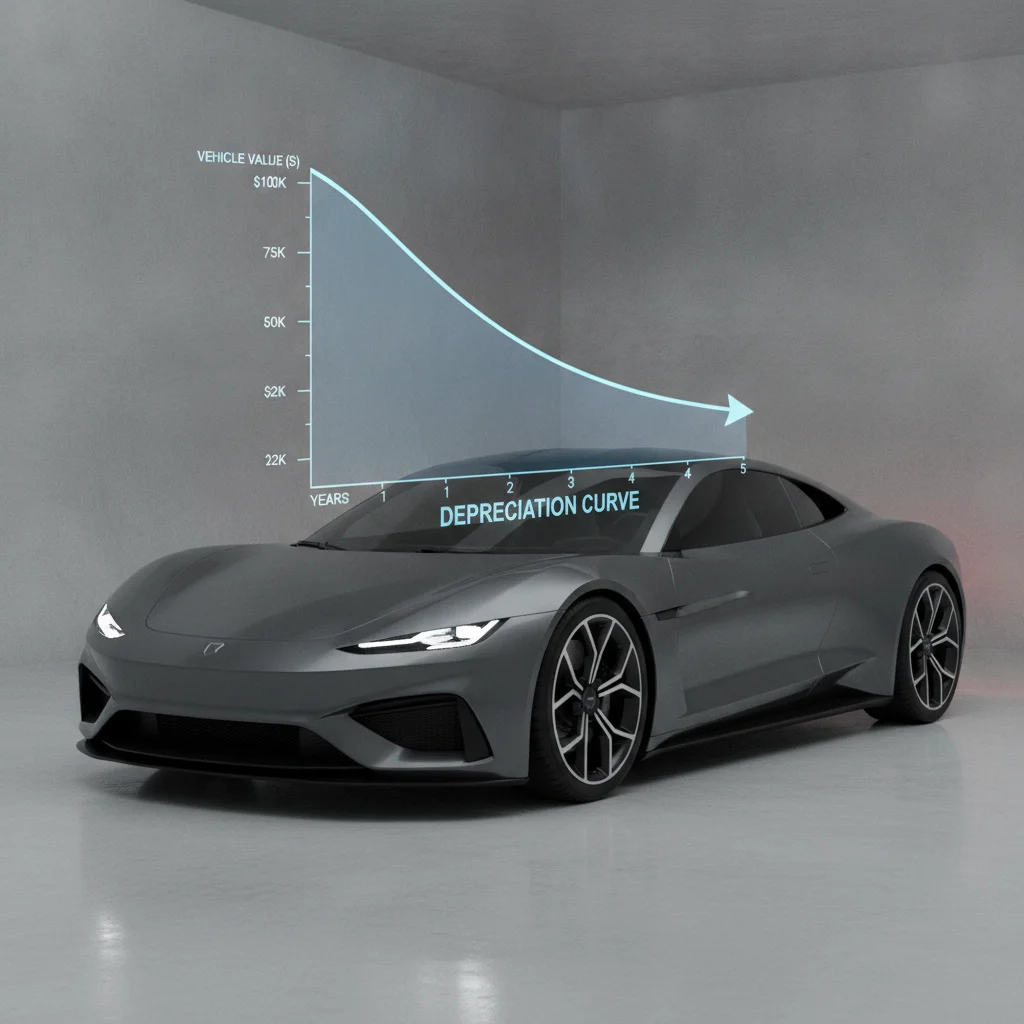
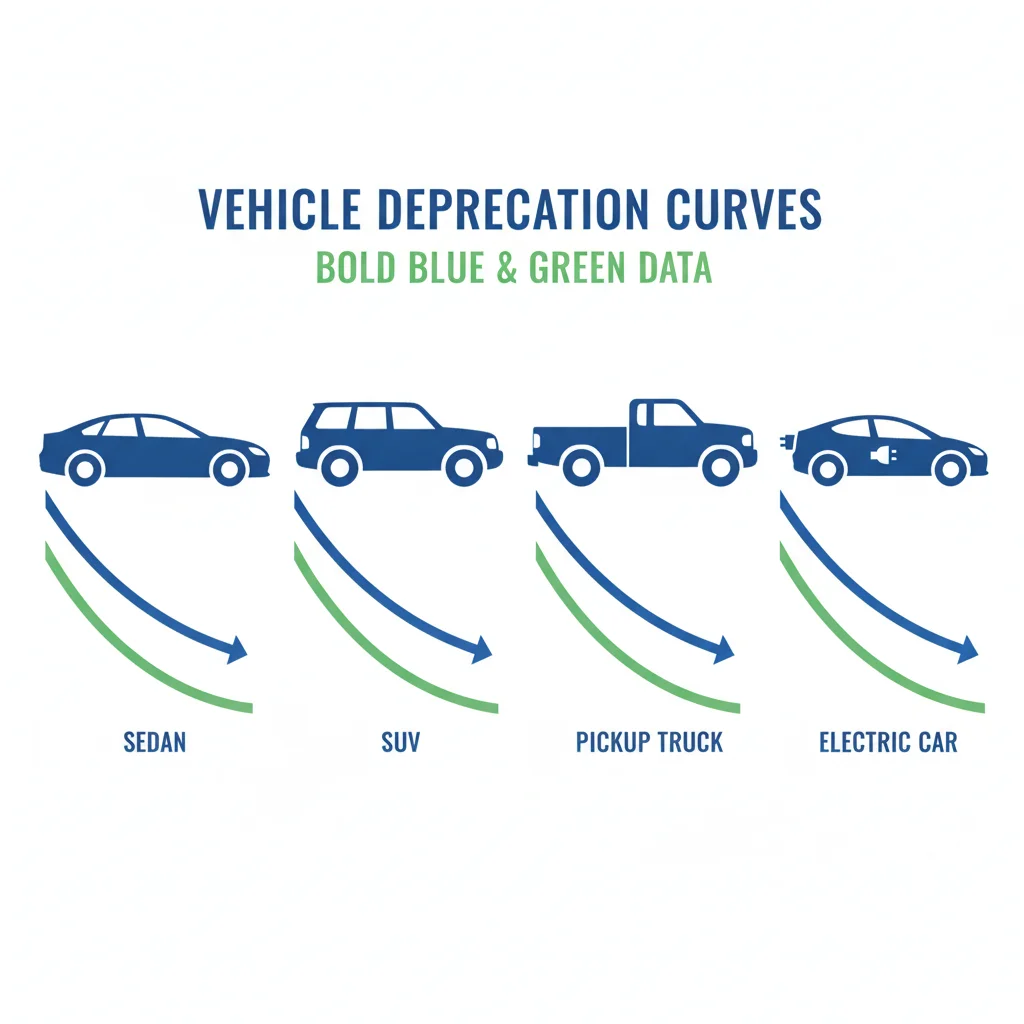
The graphical representation of how a vehicle's market value declines over time. Most curves are steep in years 1–3 and flatten progressively as the vehicle ages.
Residual Value
The projected or actual market value of a vehicle at a specific future point, expressed as a dollar amount or percentage of original MSRP. Lenders and lessors use residual values to set lease payments.
Off-Lease Return
A vehicle returned to a dealership or manufacturer at the end of a lease term. High volumes of off-lease returns in a given segment typically suppress used prices by increasing supply.
Segment
A category of vehicles grouped by size, body style, and intended use — such as compact crossover, full-size truck, or luxury sedan. Depreciation rates vary significantly between segments.
Certified Pre-Owned (CPO)
A manufacturer-backed used vehicle program that includes inspection, reconditioning, and extended warranty coverage. CPO vehicles typically carry a price premium over non-certified used cars but offer additional buyer protections.
Inelastic Demand
A market condition where demand for a product remains relatively stable even when prices rise, because buyers have few acceptable substitutes. Trucks frequently exhibit inelastic demand, which supports their resale values.
Electric Vehicles: A Depreciation Story Still Being Written
EVs have shown some of the most volatile depreciation of any segment over the past three years, for reasons that are partly market-driven and partly technology-driven. Early-generation non-Tesla EVs (Nissan Leaf, Chevy Bolt, earlier Hyundai Ioniq) depreciated extremely fast — 50–60% in the first three years was not uncommon — due to range anxiety, evolving battery technology, and limited charging infrastructure.
Tesla has maintained stronger resale than most EV competitors, though even Tesla values have softened as the company repeatedly cut new vehicle prices, creating a ripple effect that dragged down used values. When a new Model 3 drops in price by $5,000, every comparable used Model 3 on the market effectively loses value overnight.
The current EV depreciation landscape is complicated by:
- Federal tax credit eligibility: The $7,500 used EV tax credit (for vehicles under $25,000 meeting certain criteria) has added a demand floor for older, lower-priced EVs that otherwise would have fallen further.
- Battery degradation uncertainty: Buyers can't easily inspect battery health the way they can check a combustion engine, which suppresses used EV prices as a risk premium.
- Rapid model evolution: A three-year-old EV can feel significantly more dated than a three-year-old ICE vehicle in terms of range, software features, and charging speed — accelerating perceived obsolescence.
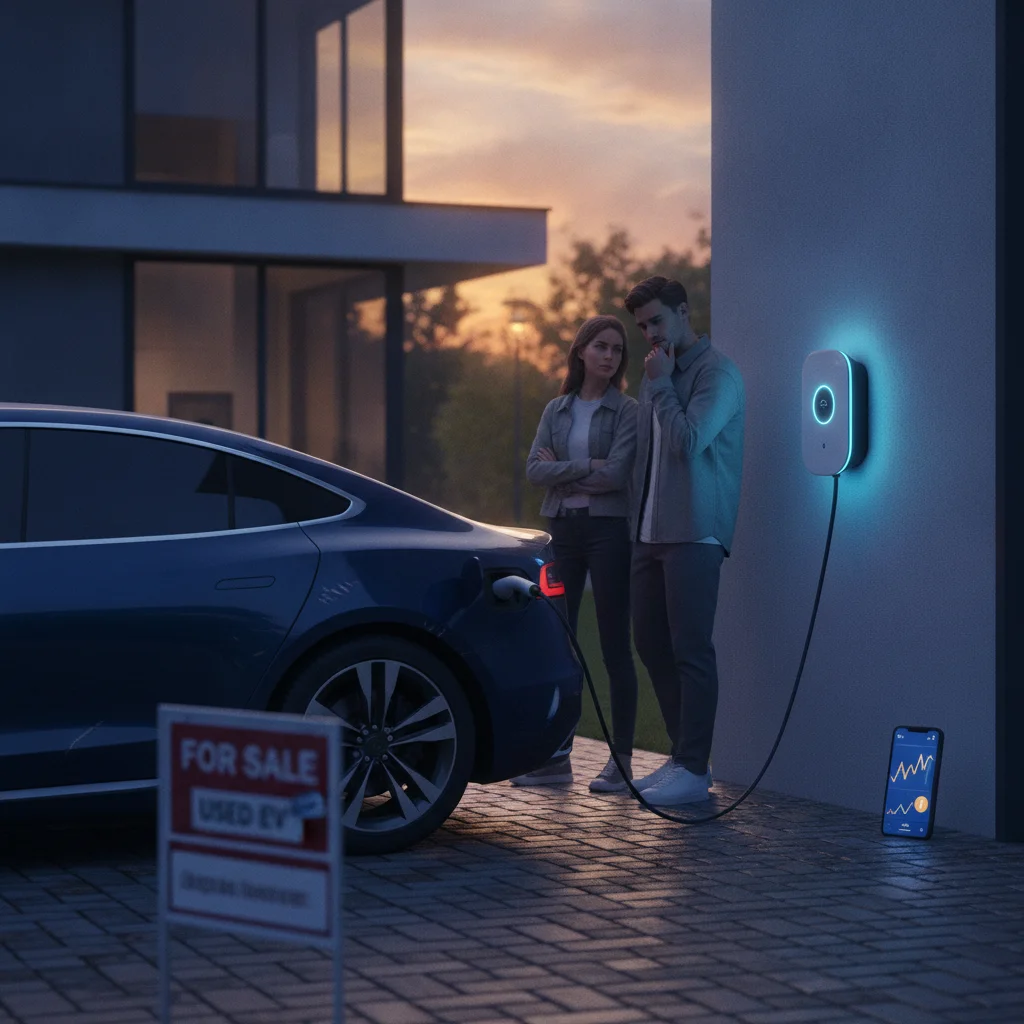
For buyers willing to accept current-generation range limitations, used EVs — particularly non-Tesla models — can represent the sharpest value opportunity in the entire used market right now. A 2–3 year old Chevy Bolt at 50–60 cents on the dollar with a battery that still delivers 200+ miles of real-world range is genuinely compelling for the right use case.
Timing matters in this segment perhaps more than any other. See how depreciation curves affect the timing of your buy or sell decision to think through when to pull the trigger on an EV purchase.
For a broader framework on what segment benchmarks look like across all categories, explore the depreciation basics hub for structured guidance on how vehicles lose value over time.
iSeeCars Annual Depreciation Study
A free, data-rich annual report tracking 5-year depreciation rates across hundreds of makes and models. Essential for benchmarking any used vehicle you're considering buying or selling.
Edmunds True Market Value (TMV)
Edmunds' TMV tool pulls real transaction data to show what buyers in your area are actually paying for specific used vehicles — far more accurate than sticker-price comparisons.
NADA Guides
The industry standard for lender and dealer valuations. NADA's used vehicle values are what most banks use when determining loan-to-value ratios, making it essential context for any financing discussion.
CarGurus Market Analysis
CarGurus rates individual listings as "great," "good," or "overpriced" based on comparable local sales data, giving buyers a fast sanity check on whether a specific asking price reflects actual market conditions.
IRS Clean Vehicle Credit (Used)
The official IRS guidance on the used EV tax credit, including income limits, qualifying vehicles, and dealer enrollment requirements. Critical reading before purchasing any used electric vehicle.

All claims are backed by peer-reviewed research. Sources on request.