Key Takeaways
Usable Battery Capacity
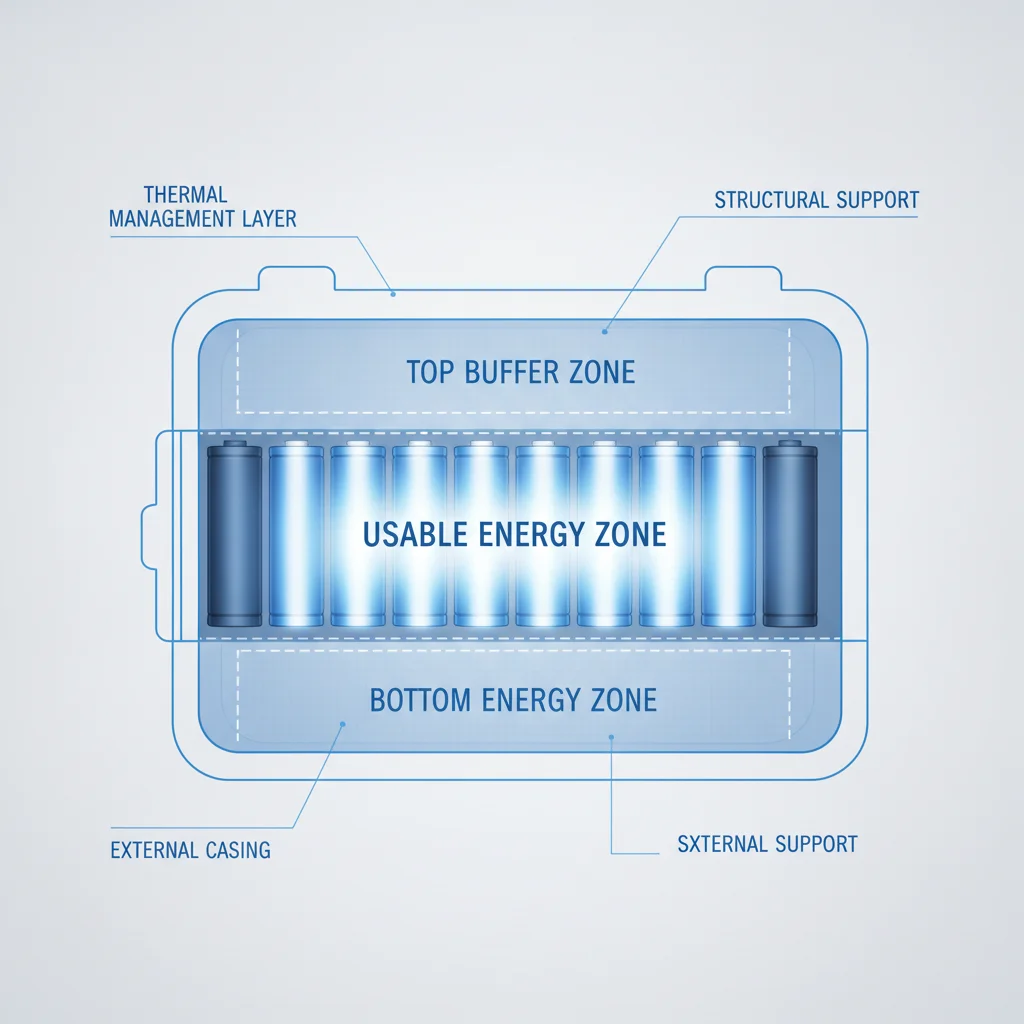
Usable battery capacity is the portion of an EV's total battery energy that the car's software actually allows you to draw on during normal driving. Automakers intentionally reserve a buffer of energy at both the top and bottom of the pack — energy you can never directly access — to protect battery chemistry and extend the pack's long-term lifespan. The number advertised in brochures is usually the gross (total) capacity; the usable figure is always smaller.
Expressed in kilowatt-hours (kWh), usable capacity is enforced by the battery management system (BMS), which sets hard voltage floors and ceilings per cell. The gap between gross and usable typically ranges from roughly 4% to 10% of total pack energy, though some manufacturers reserve more.
The Number on the Spec Sheet Is Not What You Drive On
Walk into any EV dealership and the battery capacity figure on the window sticker looks clean and absolute: 75 kWh, 100 kWh, 82 kWh. It reads like a fuel tank size — fixed and fully accessible. It isn't. In practice, every EV on sale today operates on a usable capacity that is measurably smaller than that advertised number, sometimes by a meaningful margin. Understanding why that gap exists — and what it actually means for your daily driving — is one of the most practically useful things an EV buyer can know.
For a foundational primer on what kWh even measures and how it connects to driving range, see Kilowatts, Kilowatt-Hours, and Miles of Range: Making Sense of EV Specs. Once you have that baseline, the concept of usable versus gross capacity becomes much easier to work with.
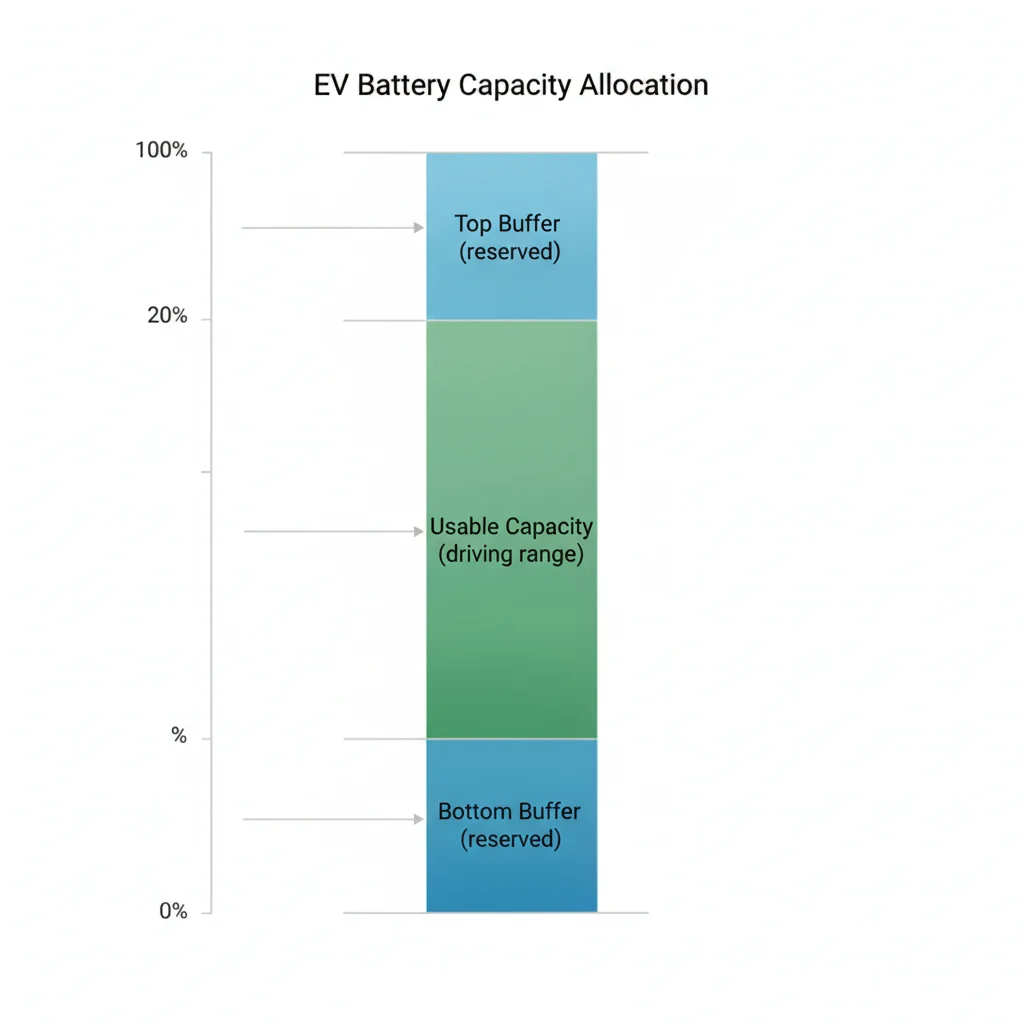
The short version: EV batteries are deliberately engineered with a buffer of energy at both the top and bottom of the charge range. That buffer is enforced by software, invisible to the driver, and never directly accessible. It exists for good reasons — and knowing those reasons changes how you interpret every EV range claim you'll ever read.
Why Manufacturers Reserve Energy at Both Ends
Lithium-ion and lithium-iron-phosphate cells — the two dominant chemistries in today's EV market — are sensitive to the extremes of their charge range. Push a cell to its absolute maximum voltage and you accelerate a set of chemical reactions that permanently degrade the electrode materials. Drain it to true zero and a different set of harmful reactions — including lithium plating and copper dissolution — can compromise cell integrity. Neither scenario is safe for long-term use, and neither is acceptable in a product expected to last ten years or more.
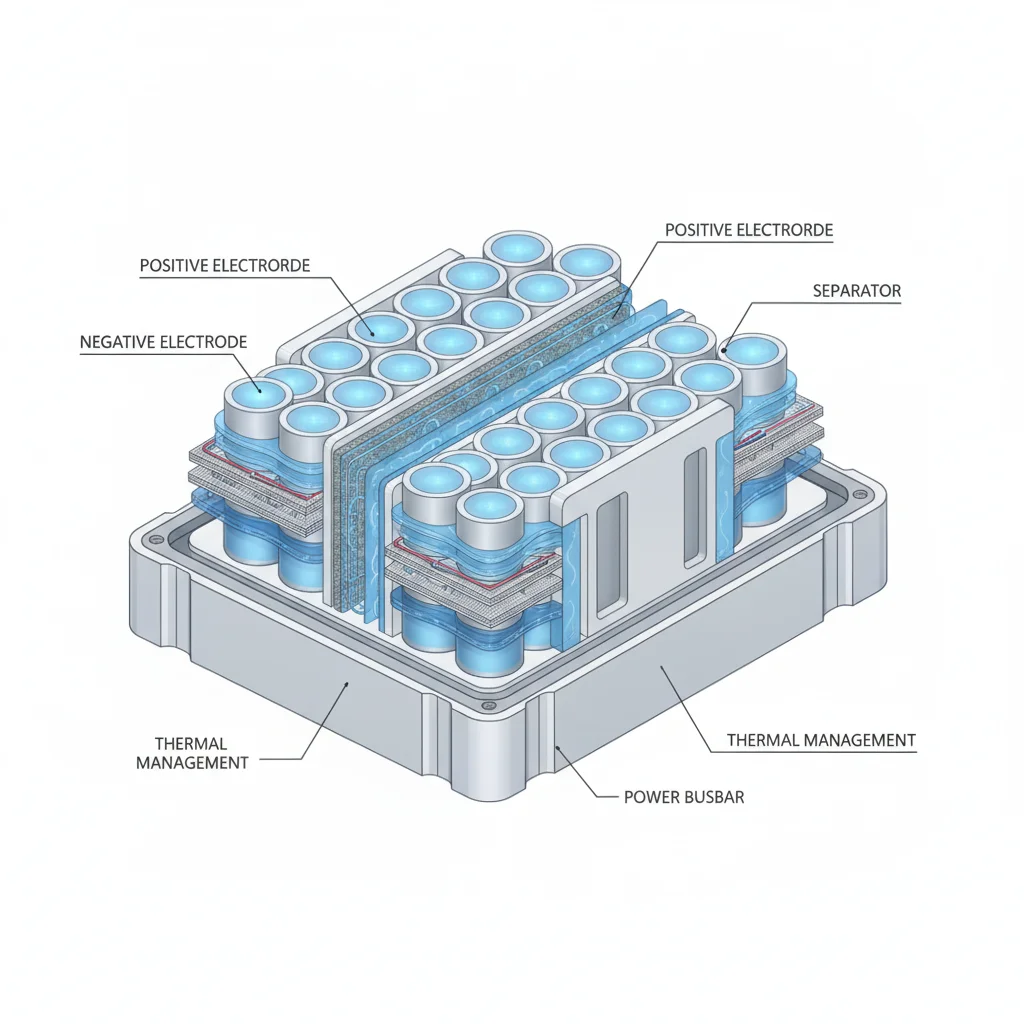
The battery management system (BMS) is the electronic guardian that prevents both scenarios. It monitors voltage, temperature, and state-of-charge at the individual cell level and enforces hard limits: a voltage ceiling above which cells will not be charged, and a voltage floor below which the car will not draw power. These limits define the usable window — the band of energy you actually drive on.
4–10%
Typical buffer as share of gross pack capacity
Independent testing across dozens of current production EVs by EV Database and ABRP consistently shows buffer sizes in this range, with most mainstream models clustering near 6–8%.
~7%
Average usable-to-gross capacity gap
Analysis of confirmed usable capacity data for over 50 EV models by EV Database (2023) shows a median buffer of approximately 7% of gross capacity across all segments.
70%
Minimum capacity retention guaranteed by most OEM warranties
The majority of EV manufacturers in the U.S. warrant at least 70% of original usable battery capacity over 8 years or 100,000 miles, per their published warranty documentation.
>80%
Capacity retained by most batteries at 100,000 miles
Real-world fleet data compiled by Recurrent Auto from thousands of EVs in service shows the majority retain more than 80% of original capacity at 100,000 miles.
The top buffer typically serves multiple purposes simultaneously. It protects cell chemistry from the degradation that accelerates at high state-of-charge. It also preserves headroom for regenerative braking: if the pack were genuinely full, the car would have nowhere to put energy recovered during deceleration, forcing the friction brakes to work harder and wasting energy. The bottom buffer similarly protects cells from deep discharge and ensures the BMS itself retains enough power to shut the system down safely and communicate its state to a charger when plugging in.
U.S. Disclosure Rules Don't Require Usable kWh
Unlike the European Union, where usable battery capacity disclosure has become increasingly standardized, the United States has no federal requirement for automakers to publish confirmed usable kWh figures. The EPA's range testing methodology implicitly accounts for real-world usable capacity — since range tests are driven until the car stops — but the energy figure on a U.S. spec sheet remains gross capacity by convention. Always cross-reference manufacturer figures against third-party data before making a purchase decision.
Lithium-Iron-Phosphate (LFP) Packs Handle Charging Differently
LFP chemistry — used in some Tesla Standard Range models, certain BYD vehicles, and others — has a flatter voltage curve that makes state-of-charge harder to estimate precisely. Manufacturers of LFP-equipped EVs often recommend regular charging to 100% to help the BMS recalibrate its state-of-charge estimates. The top buffer still exists in LFP packs, but the management strategy at the cell level differs from the nickel-manganese-cobalt (NMC) chemistry used in most other EVs.
How the Numbers Actually Break Down
Real-world examples illustrate the gap more clearly than abstractions. Consider a few well-documented cases from vehicles that have been independently tested:
- Tesla Model Y Long Range (2023): Gross pack capacity of approximately 82 kWh; independently confirmed usable capacity of roughly 77.4 kWh — about a 5.6% buffer.
- Hyundai IONIQ 6 Standard Range RWD: Gross pack of 53 kWh; usable capacity of approximately 49 kWh — a gap of roughly 7.5%.
- Chevrolet Equinox EV (2024): Gross pack of 85 kWh; usable capacity of approximately 78.9 kWh — a buffer of around 7.2%.
- Rivian R1T Standard Pack: Gross 135 kWh; usable approximately 125 kWh — a relatively modest ~7.4% buffer on a very large pack.
These figures come from third-party testers and owner communities rather than manufacturer disclosures, because the U.S. market does not require automakers to publish usable capacity. That opacity is itself worth noting: when you see a headline kWh figure, you should assume it is gross capacity unless the listing specifically states otherwise.
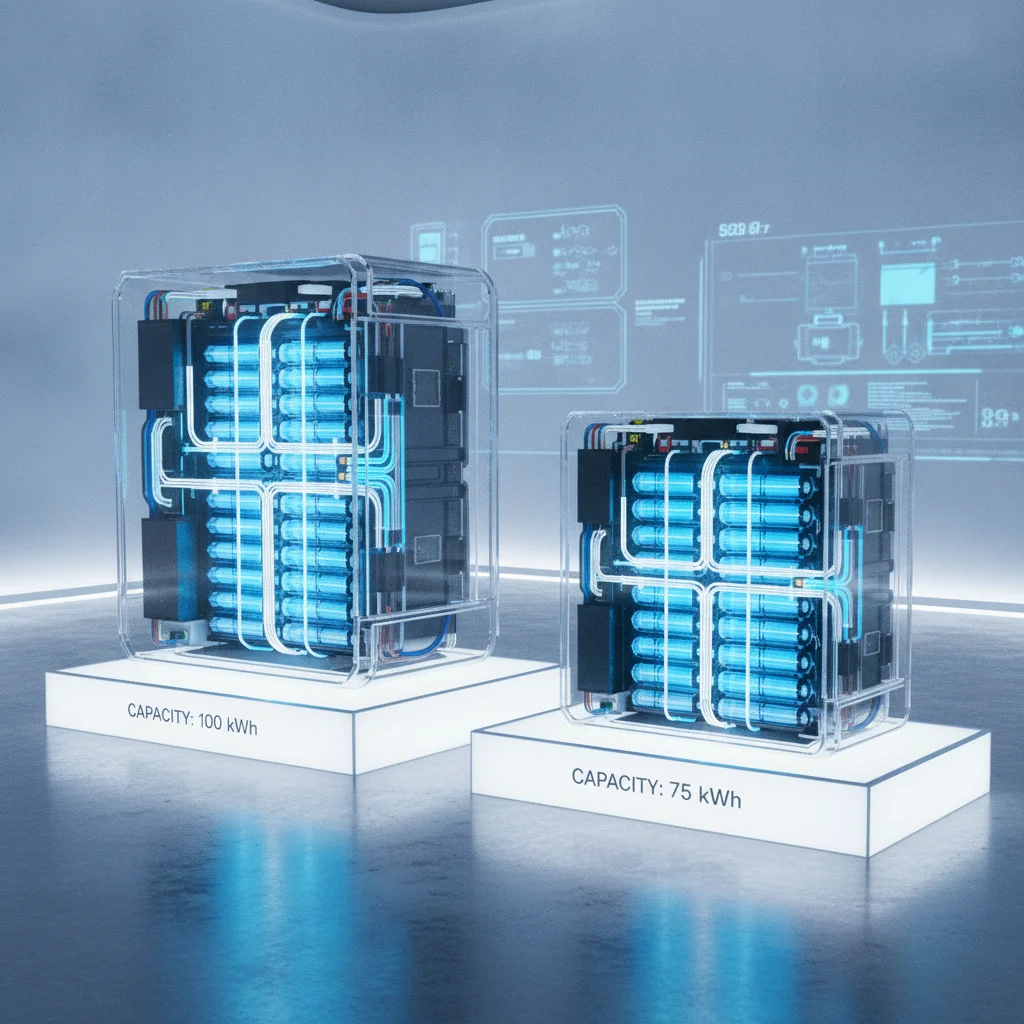
The size of the buffer is not arbitrary. Engineers tune it based on the specific cell chemistry used, the target charging speed, the thermal management architecture, and the longevity warranty the company is prepared to back. A model designed for 250 kW DC fast charging typically maintains a larger top buffer than one rated for 100 kW, because higher charging rates generate more heat and stress at the top of the charge curve.
Find Confirmed Usable kWh Before You Buy
Before finalizing an EV purchase, look up the model's confirmed usable capacity on EV Database (ev-database.org) or ABRP's vehicle profiles. These figures come from real-world testing rather than manufacturer marketing and give you a much more accurate basis for comparing range across competing models. Bookmark these resources alongside any manufacturer spec sheet you review.
Use Usable kWh — Not Gross kWh — for Cost Calculations
When estimating home charging costs or comparing energy cost-per-mile across vehicles, always use the confirmed usable kWh figure rather than the gross spec. Plugging in the gross number will underestimate your cost-per-mile by approximately 6–10%, skewing comparisons between vehicles with different buffer sizes. Most home energy management apps let you input a custom battery size — use the usable figure there too.
What 'Charging to 100%' Actually Means
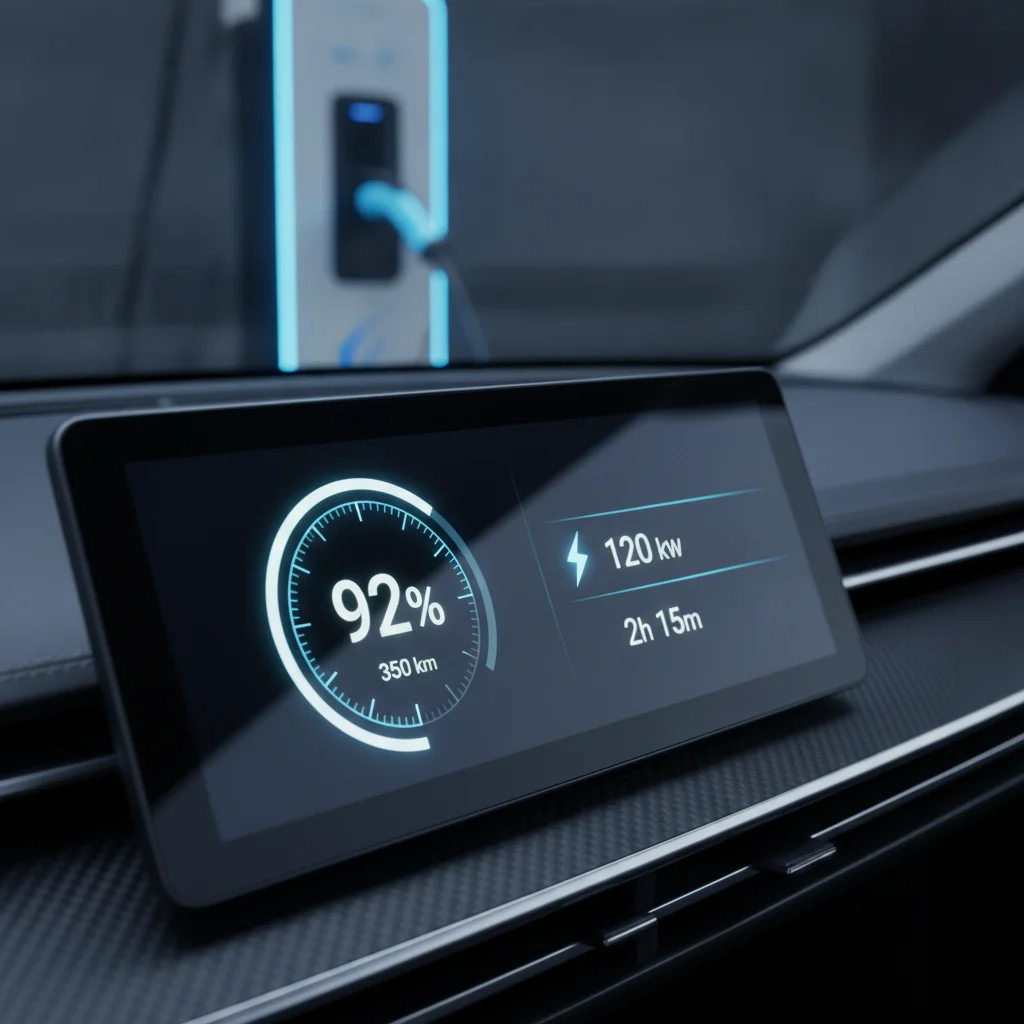
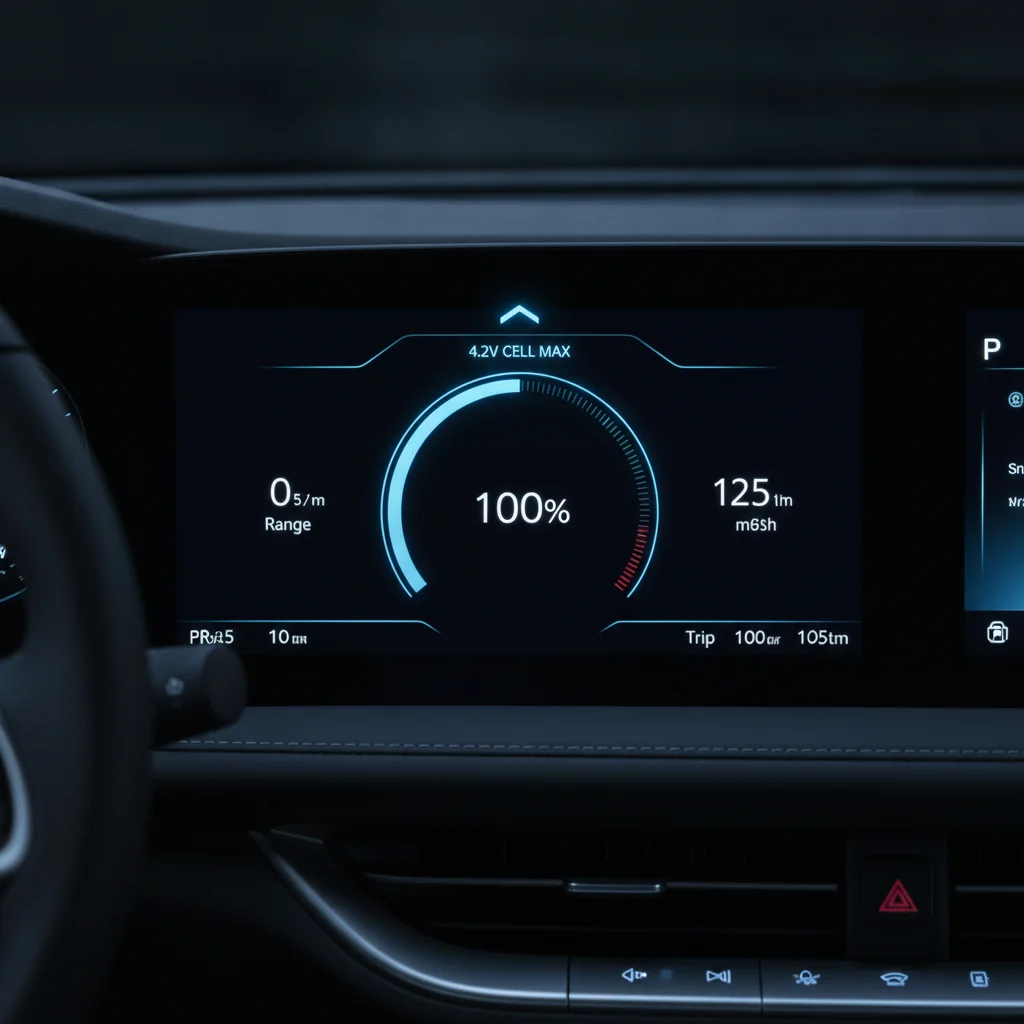
Here is where terminology gets genuinely confusing for new EV owners. When your car's display reads 100%, you have filled the usable portion of the pack — not the physical maximum the cells could theoretically hold. The top buffer is already in place; the software simply labels the top of the usable window as '100%' because that is the most intuitive way to present state-of-charge to a driver.
A handful of manufacturers — Tesla being the most prominent example — offer an occasional override that charges slightly beyond the standard ceiling, sometimes called 'charge to full' or accessed by setting the charge limit to a special maximum. Even that override does not typically reach the absolute physical ceiling of the cells; it merely reduces the top buffer from, say, 8% to 3–4%. Tesla recommends using this mode only for long trips, not as a daily charging habit, precisely because the chemistry stress at high state-of-charge accumulates over repeated cycles.
“The state-of-charge number a driver sees is an abstraction — a carefully managed translation of complex electrochemical reality into a simple percentage. The buffer isn't hidden from you maliciously; it's hidden from you because understanding it shouldn't be a prerequisite for driving.”
— Daan Schneemann, EV battery systems engineer and contributor to EV Database technical documentation
The bottom buffer creates a parallel illusion in reverse. When the display reads 0% and the car stops moving, there is still energy in the cells — just energy the BMS will not release. This is a deliberate safety margin: it keeps cells from reaching the damaging deep-discharge threshold and ensures the car can accept a charge signal when you plug in at a dead-low state-of-charge. In practice, most experienced EV drivers treat 10–20% displayed charge as their personal low threshold, which means they are operating even further from the pack's physical floor — a habit that, incidentally, extends battery life.
Usable Capacity and What It Means for Real-World Range
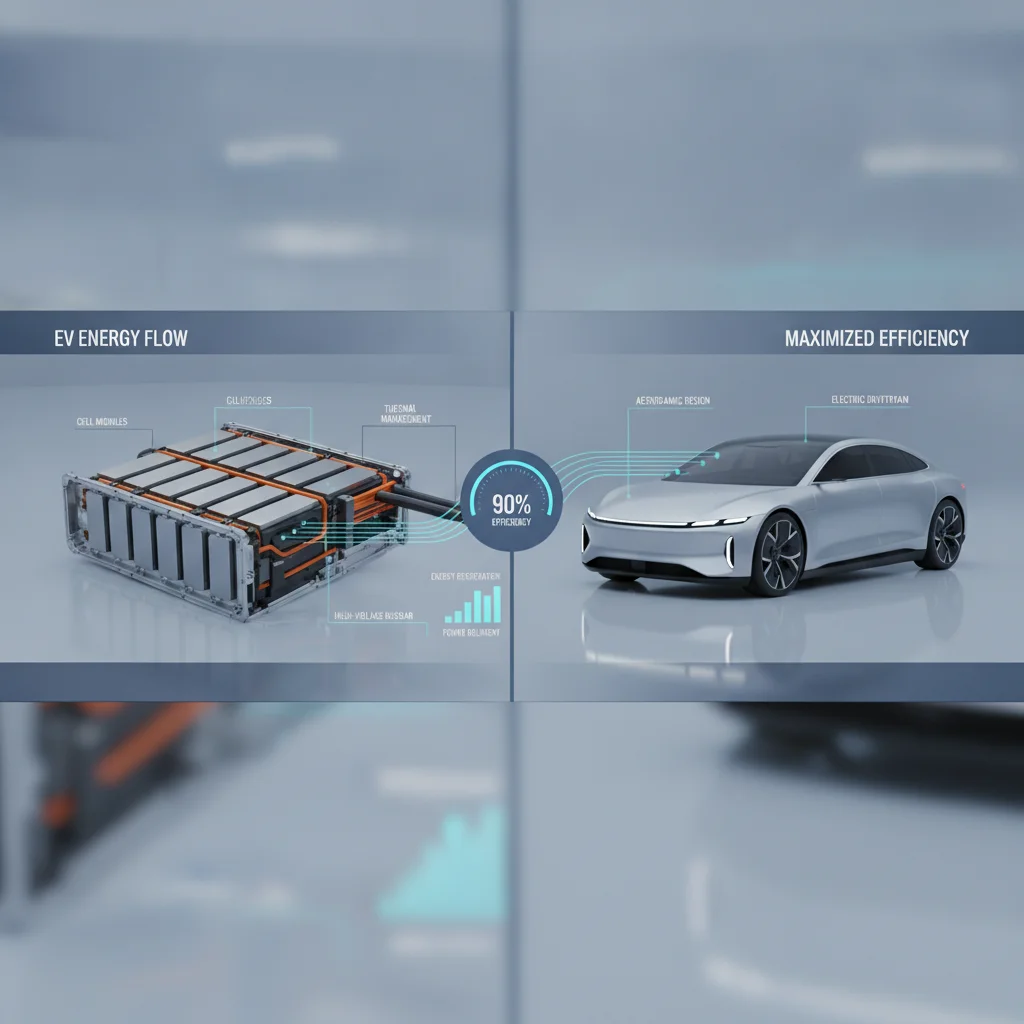
Range is not simply a function of usable kWh. It is the product of usable capacity and efficiency — how many miles the car can travel per kWh consumed. A 77 kWh usable pack in an aerodynamically efficient sedan might deliver more real-world range than a 90 kWh usable pack in a heavy, less efficient SUV. Battery Size vs. Efficiency: Which One Actually Determines Real-World Range explores that interaction in detail.
For the purpose of comparing vehicles fairly, usable kWh is a more honest input than gross kWh. If you are evaluating two competing EVs and both advertise similar EPA range estimates, checking the confirmed usable capacity helps you understand whether that range comes from a larger pack or from a more efficient drivetrain — a distinction that matters when you factor in charging costs and long-term degradation.
Degradation compounds the usable capacity question over time. As cells age, the gross capacity of the pack gradually decreases. The BMS buffers typically remain in place as a fixed voltage threshold, meaning usable capacity contracts alongside gross capacity as the battery ages. Battery Degradation Over Time: How Much Range Do EVs Actually Lose? provides data on how quickly that contraction actually occurs in real-world fleets — and the news is generally more reassuring than many buyers expect.
For a comprehensive look at how EPA ratings are derived, how efficiency metrics interact with pack size, and how to compare EVs on range honestly, The Full Picture on EV Range: A Data-Driven Reference pulls all of those threads together in one place.
How to Use This Knowledge When Shopping for an EV
Most manufacturer spec sheets in the United States list gross capacity. When comparing vehicles, seek out the confirmed usable figures from third-party sources — EV Database, A Better Route Planner (ABRP), or Recurrent Auto's data sets are reliable starting points. If you cannot find a confirmed usable number, applying a rough 7% reduction to the advertised gross figure gives a reasonable conservative estimate for most current mainstream EVs, though individual models vary.
When evaluating how buffer size affects your specific needs, consider these practical dimensions:
- Charging speed matters: If you frequently use DC fast charging, a manufacturer's decision to maintain a larger top buffer can actually help you — it typically correlates with a better-sustained charging curve and less heat-related throttling.
- Warranty benchmarks: Most EV battery warranties guarantee a minimum of 70% capacity retention over 8 years or 100,000 miles. That retention figure is measured against the original usable capacity, not the gross capacity — worth clarifying when reading warranty language.
- Daily habit calibration: Understanding that 100% on your display is already a protected figure helps you make informed decisions about whether daily charging to 80% — a commonly recommended best practice — is truly necessary given your chemistry and BMS design.
Once you understand usable capacity, you are ready to evaluate the full matrix of battery specifications that should inform a purchase decision. What to Look for in an EV's Battery Specs Before You Buy covers the next tier of technical detail: charging curves, thermal management design, and how to read a spec sheet with the informed skepticism it deserves.
Find Confirmed Usable kWh Before You Buy
Before finalizing an EV purchase, look up the model's confirmed usable capacity on EV Database (ev-database.org) or ABRP's vehicle profiles. These figures come from real-world testing rather than manufacturer marketing and give you a much more accurate basis for comparing range across competing models. Bookmark these resources alongside any manufacturer spec sheet you review.
Use Usable kWh — Not Gross kWh — for Cost Calculations
When estimating home charging costs or comparing energy cost-per-mile across vehicles, always use the confirmed usable kWh figure rather than the gross spec. Plugging in the gross number will underestimate your cost-per-mile by approximately 6–10%, skewing comparisons between vehicles with different buffer sizes. Most home energy management apps let you input a custom battery size — use the usable figure there too.
All claims are backed by peer-reviewed research. Sources on request.