Key Takeaways
Option A
Battery Size (kWh Capacity)
The raw fuel tank — more capacity means more potential energy stored.
Best for: Drivers who prioritize maximum range ceiling, tow frequently, or operate in extreme climates where efficiency losses are unavoidable.
Option B
Efficiency (Miles per kWh)
The fuel economy figure — how far each unit of stored energy actually takes you.
Best for: Urban and highway commuters who want lower operating costs and predictable range without necessarily carrying the heaviest battery pack.
If you regularly drive 300+ miles between charges or tow a trailer
Battery Size (kWh Capacity)
High-demand use cases drain kilowatt-hours faster regardless of how efficient a vehicle is. A larger pack provides the raw buffer needed to complete those trips without range anxiety.
If you primarily commute in the city or on mixed suburban routes
Efficiency (Miles per kWh)
Stop-and-go driving allows regenerative braking to recapture energy, making a highly efficient smaller-battery vehicle more cost-effective and nearly as capable day to day.
If you live in a cold climate and charge at home overnight
Battery Size (kWh Capacity)
Cold weather reduces efficiency by 20–40%, meaning a larger buffer is essential to arrive at your destination with reserve charge during winter months.
If minimizing operating cost per mile is your top priority
Efficiency (Miles per kWh)
A more efficient EV costs less to charge to the same functional range, compounding savings over years of ownership regardless of electricity rate.
If you want the most accurate range prediction across seasons and conditions
Efficiency (Miles per kWh)
Efficiency ratings reveal how a vehicle handles energy under real-world variables. Pairing them with usable capacity gives the most honest picture of dependable range.
The Range Formula Everyone Gets Wrong
Ask most EV shoppers what determines how far their car will travel on a charge, and the answer comes back quickly: battery size. It's an intuitive assumption — bigger tank, more miles. But the analogy breaks down almost immediately when you look at real data.
Range is the product of two variables multiplied together: usable battery capacity (kWh) × efficiency (miles per kWh). Remove either factor from the equation and you're flying blind. A 100 kWh pack in a 6,000-pound SUV with poor aerodynamics may deliver less practical range than a 75 kWh pack in a purpose-built, aerodynamically optimized sedan.
This isn't a hypothetical. The 2024 Rivian R1T with its 135 kWh "Max" pack is rated at approximately 410 miles — impressive, but its efficiency sits around 2.6–2.8 mi/kWh depending on configuration. Meanwhile, the 2024 Tesla Model 3 Long Range RWD carries a 75 kWh usable pack and achieves an EPA rating of about 358 miles at roughly 4.5 mi/kWh. The Rivian moves nearly 80% more energy for only about 14% more EPA range.
That gap represents real money — both in purchase price and in charging costs over the life of the vehicle. Understanding the dynamic between capacity and efficiency isn't just academic; it directly shapes what you pay, how you plan road trips, and whether a given EV actually fits your life.
For a deeper look at how variables like speed and climate stress these numbers further, see our analysis of what affects EV range beyond battery size.
Breaking Down Battery Capacity: What the kWh Number Really Means
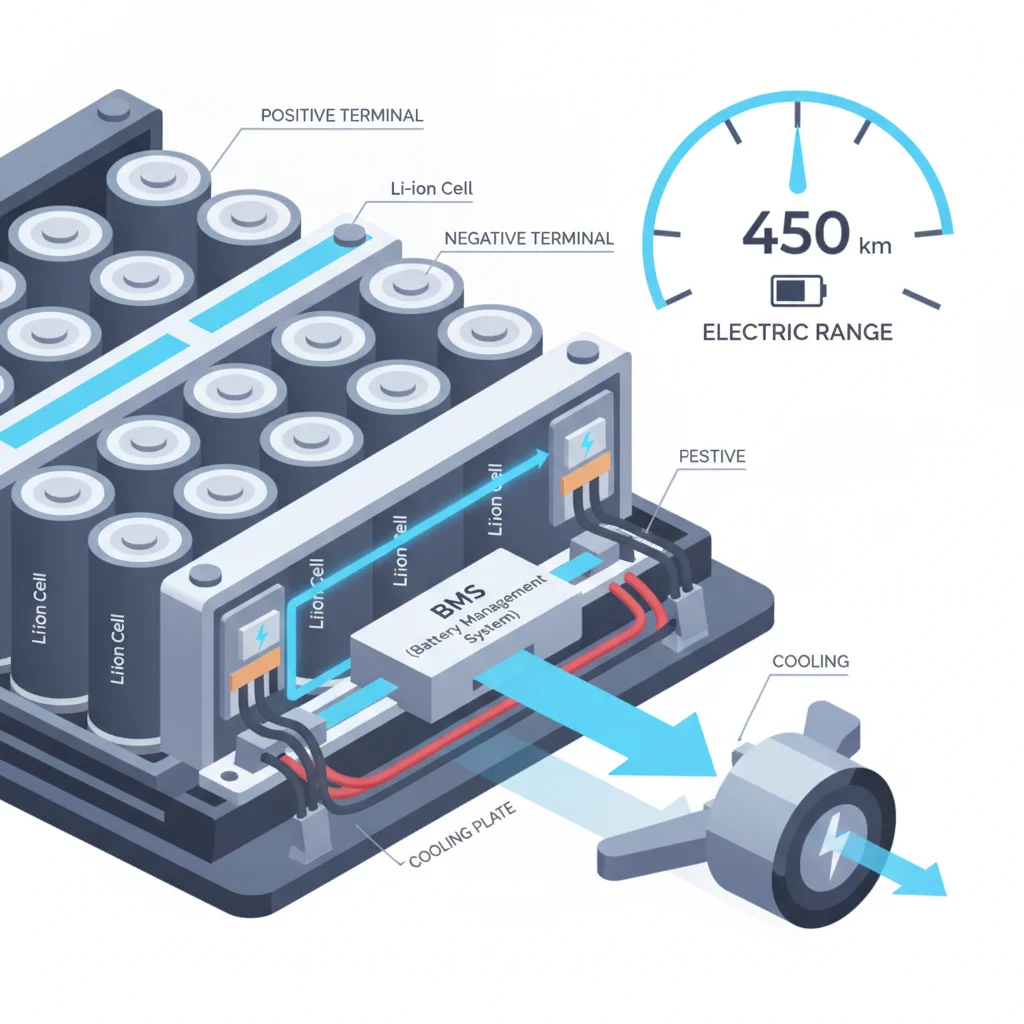
Battery capacity is measured in kilowatt-hours — the same unit on your electricity bill. A 100 kWh pack can theoretically deliver 100 kilowatts for one hour, or 10 kilowatts for ten hours. In an EV, it's the reservoir from which all propulsion, climate control, and auxiliary systems draw power.
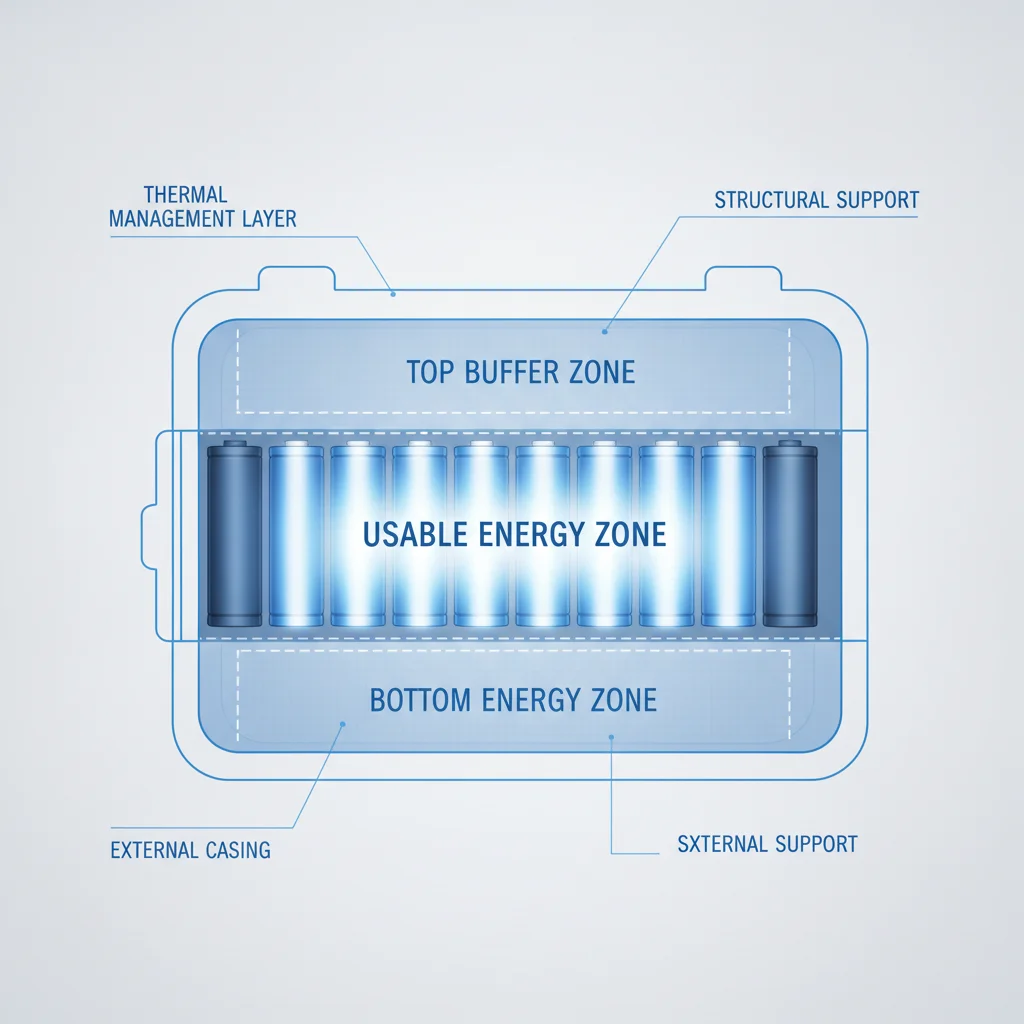
But here's the part that catches most buyers off guard: the number printed on the spec sheet is almost never the number you can actually use. Automakers reserve a buffer — typically 5–10% at the top and bottom of the pack — to protect battery chemistry and extend long-term cell life. A vehicle advertised with an 82 kWh battery might deliver only 75–77 kWh of usable capacity.
Understanding what usable battery capacity actually means is essential before you trust any range comparison. Two vehicles with identical gross capacity can have meaningfully different usable capacity depending on how aggressively each manufacturer manages its buffer.
| Criterion | Battery Size (kWh Capacity) | Efficiency (Miles per kWh) |
|---|---|---|
| Primary metric | Total energy stored (kWh) | Distance per unit of energy (mi/kWh) |
| Impact on range ceiling | Sets the absolute maximum range possible | Determines how close you get to that ceiling |
| Effect of cold weather | Larger buffer absorbs degradation better | Efficiency drops 20–35%; range shrinks proportionally |
| Effect of highway speed | More kWh means more runway at speed | Efficiency falls sharply above 65–70 mph |
| Charging cost impact | Larger packs cost more per full charge cycle | Higher efficiency = fewer kWh needed per mile |
| Vehicle weight relationship | Larger packs add significant curb weight | Lighter vehicles typically achieve higher efficiency |
| Towing and payload | Larger capacity compensates for efficiency loss | Towing can cut efficiency by 40–60% |
| Purchase cost premium | High — raw materials drive significant cost | Low — improved through engineering, not materials |
| Urban driving advantage | Modest — more than needed for typical commutes | High — regen braking boosts real-world efficiency |
| Best single use case | Long-distance, towing, cold-climate driving | Daily commuting, cost-sensitive, mixed-use driving |
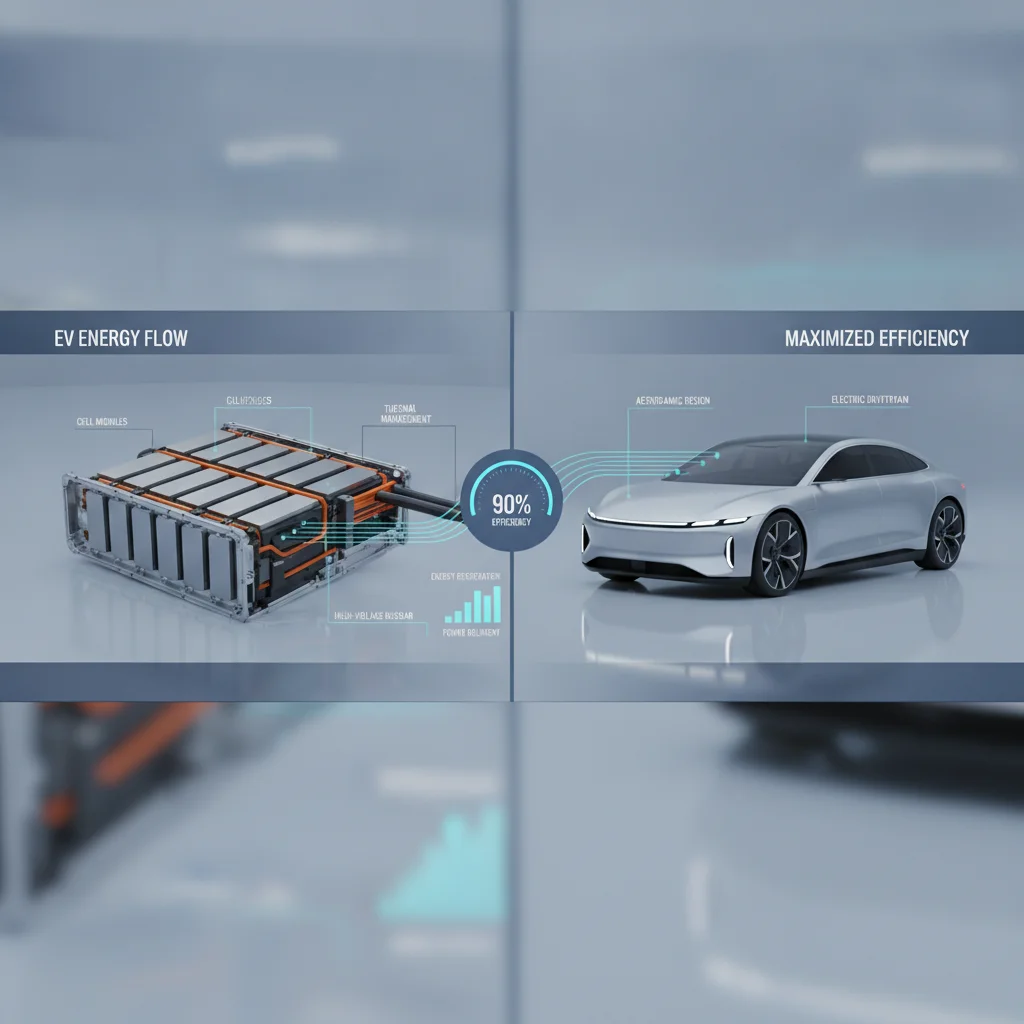
Gross capacity also says nothing about how efficiently the vehicle converts stored electricity into forward motion. A less aerodynamic body, a heavier curb weight, a less refined motor, or an older inverter design can all erode the range that large pack would otherwise deliver. In that sense, kWh is the ceiling — efficiency determines how close you actually get to it.
40%
Cold-weather range reduction in some EVs
AAA testing found EV range can drop up to 40% when cabin heating is used in 20°F temperatures, regardless of pack size.
4.5 mi/kWh
EPA efficiency — Tesla Model 3 Long Range RWD
Among the most efficient production EVs available in the U.S. as of 2024, per EPA test data published on fueleconomy.gov.
~10%
Typical manufacturer battery buffer (top and bottom)
Most automakers reserve 5–10% of total pack capacity at each end to protect cell longevity, reducing usable kWh below the advertised figure.
$200+
Annual extra charging cost for low-efficiency EVs
Estimated additional home-charging cost per year for a 3.0 mi/kWh vehicle versus a 4.0 mi/kWh vehicle covering 15,000 miles at $0.16/kWh.
60%
Efficiency loss when towing near max capacity
Real-world towing tests by outlets including Edmunds and Car and Driver consistently show 40–60% range reductions when EVs tow near rated capacity.
Efficiency Ratings: The Most Underused Number in EV Shopping
Efficiency in EVs is typically expressed as miles per kWh (mi/kWh) or, on the EPA's window sticker, as MPGe (miles per gallon equivalent). MPGe uses the energy equivalency of one gallon of gasoline (33.7 kWh) to produce a comparable figure, which makes cross-shopping with gas vehicles easier — but for EV-to-EV comparisons, mi/kWh is more useful.
The efficiency figure represents exactly how far each kilowatt-hour of stored energy moves the vehicle under EPA test conditions. A car rated at 4.0 mi/kWh will travel 200 miles on 50 kWh. One rated at 2.5 mi/kWh will travel only 125 miles on the same 50 kWh. That 37.5-mile gap costs real money to make up with a larger battery.
What Drives Efficiency Differences Between EVs
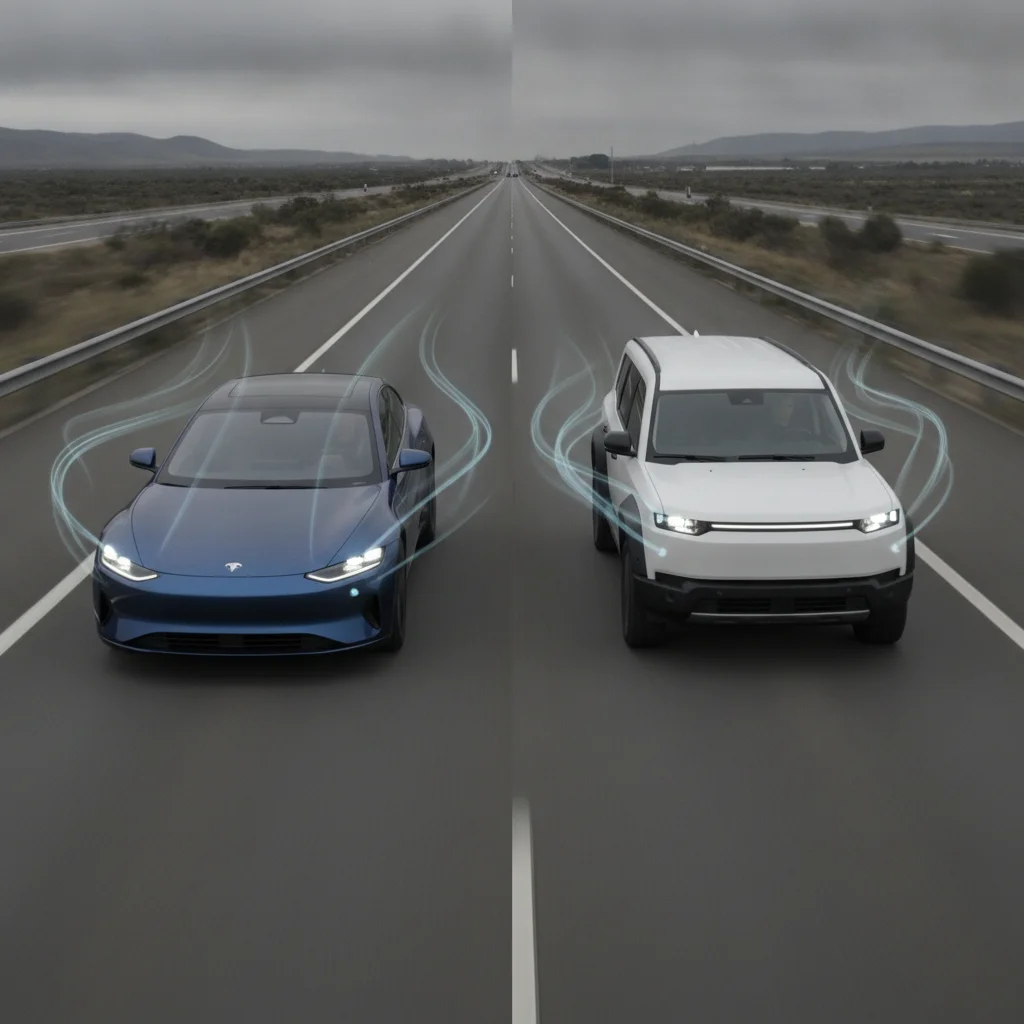
- Aerodynamic drag: The coefficient of drag (Cd) is perhaps the single most important physical efficiency factor. The Model 3's 0.23 Cd versus an SUV's 0.30+ Cd creates compounding losses at highway speeds.
- Curb weight: Every additional pound requires more energy to accelerate and, on grades, to maintain speed. It also reduces the effectiveness of regenerative braking.
- Motor and inverter design: Permanent magnet motors and silicon carbide inverters — increasingly common in newer EVs — convert electrical energy to motion more efficiently than older induction designs.
- Heat pump adoption: Climate control is an enormous efficiency drain. Heat pumps reclaim ambient heat rather than generating it resistively, cutting HVAC energy consumption by up to 50% in mild cold.
- Tire rolling resistance: EV-optimized tires with lower rolling resistance compounds and narrower profiles improve efficiency at the cost of some ride comfort.
Real-world efficiency degrades under conditions the EPA test doesn't fully capture — highway speeds above 70 mph, sustained cold, heavy payloads, or aggressive driving. Our companion piece on why rated range and real-world range never match explains exactly how these gaps develop.
Head-to-Head: When Capacity Wins and When Efficiency Wins
The relationship between capacity and efficiency isn't static — it shifts depending on your driving profile. Consider three common buyer scenarios:
Scenario 1: The Long-Distance Road Tripper
On a 400-mile drive, a driver needs both raw capacity and reasonable efficiency. But if the route involves sustained 75–80 mph highway speeds, efficiency drops significantly — EPA ratings are conducted at lower average speeds. At 75 mph, a vehicle rated at 3.5 mi/kWh might actually deliver closer to 2.8–3.0 mi/kWh. In this case, the larger battery pack is the more forgiving variable. A 100 kWh pack at 2.8 mi/kWh still delivers roughly 280 miles between stops; a 60 kWh pack at 3.5 mi/kWh drops to 168 miles at the same real-world highway efficiency.
Scenario 2: The Urban Commuter
Stop-and-go city driving actually rewards efficient vehicles disproportionately. Regenerative braking recaptures energy that would be lost as heat in a friction-braking system. An efficient EV in urban traffic can approach or even exceed its EPA rating in some conditions. Here, a 75 kWh vehicle achieving 4.2 mi/kWh nets 315 miles of usable city range — more than adequate for most commuters whose daily usage rarely exceeds 50–80 miles.
Scenario 3: The Cold-Climate Driver
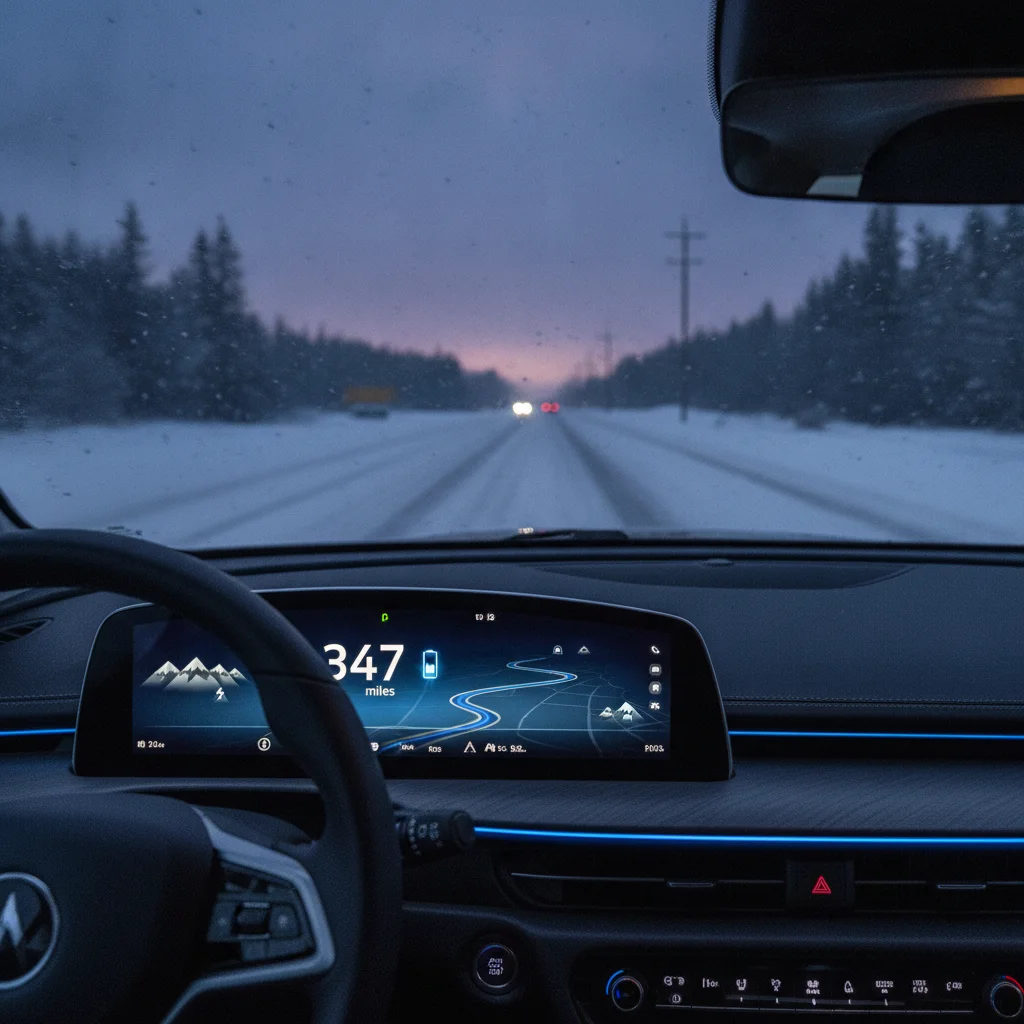
This is where both metrics are tested simultaneously. Cold weather reduces battery efficiency by suppressing chemical reaction rates in cells, and it forces heavy HVAC use (unless a heat pump is installed). A vehicle might lose 25–35% of its effective range in sub-freezing conditions. Both a large, inefficient pack and a small, efficient pack suffer — but a larger pack has more absolute range to lose before reaching a functionally limiting threshold.
The full picture on EV range offers a data-driven reference covering exactly how these derating factors compound across different vehicle types.
EPA Testing Doesn't Reflect Highway Speeds
The EPA's five-cycle test includes a highway segment averaging only about 48 mph — well below the 70–80 mph many drivers cruise at. Manufacturers report efficiency figures derived from this test, which means real highway efficiency will typically be lower than the sticker suggests. When planning a road trip, apply a 15–20% efficiency haircut to the EPA figure as a conservative baseline.
Heat Pumps Change the Cold-Weather Calculus
Vehicles equipped with heat pumps — including recent Tesla models, the Hyundai Ioniq 6, and others — suffer significantly smaller cold-weather range losses than those using resistive heating. If you're in a cold climate, heat pump availability should be a key specification to verify before purchase, as it can preserve 10–20% more range in sub-freezing temperatures.
Usable Capacity Is Not Always Published
Automakers frequently advertise gross battery capacity rather than the usable figure. The EPA publishes usable capacity in its official test documents, which are freely accessible at fueleconomy.gov. Cross-referencing the gross spec-sheet number with the EPA's usable figure before comparing vehicles ensures you're making an apples-to-apples range assessment.
The Cost Dimension: Efficiency Affects More Than Range
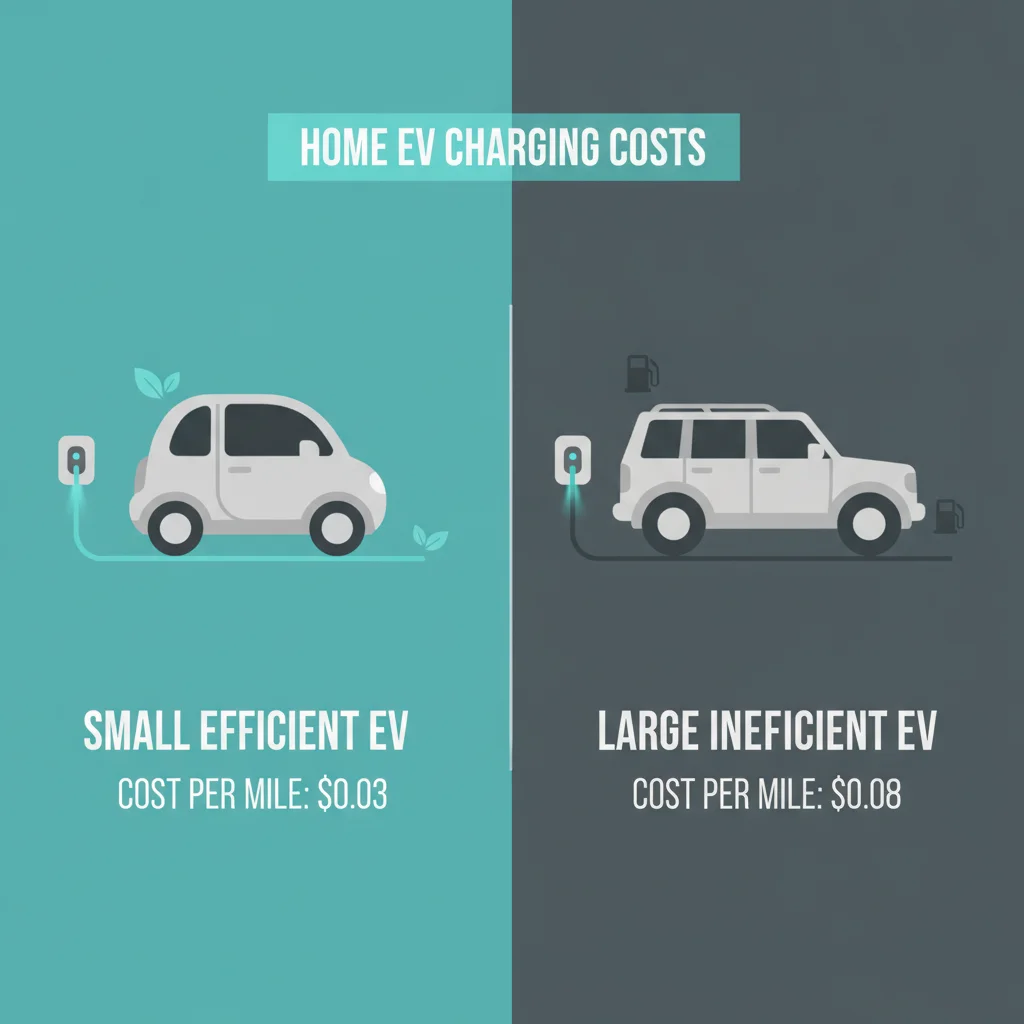
Range is the headline, but efficiency quietly governs your total cost of ownership. A less efficient vehicle doesn't just stop sooner — it costs more every single time you charge it. At the national average electricity rate of approximately $0.16 per kWh (as of early 2025), the math compounds quickly over years of ownership.
Consider two EVs with identical 300-mile EPA ratings but different efficiency profiles: Vehicle A achieves that range on 75 kWh (4.0 mi/kWh); Vehicle B achieves it on 100 kWh (3.0 mi/kWh). Every 300-mile charge cycle, Vehicle B consumes 25 additional kWh — costing roughly $4 more. Over 15,000 miles per year, that's approximately $200 in additional annual charging costs at home rates. On DC fast chargers, where commercial rates often reach $0.35–0.50/kWh, the gap widens considerably.
That cost relationship doesn't end at the charger. More of your article on how real-world range changes your effective charging cost unpacks how efficiency loss directly inflates what you pay per mile driven, particularly on public networks.
There's also the purchase-price dimension. Larger battery packs drive up vehicle cost significantly — the raw material cost of lithium, nickel, and manganese for a 100 kWh pack versus a 75 kWh pack can add $5,000–$10,000 to the manufacturing cost alone. Buyers chasing maximum range via capacity rather than via efficiency often pay a premium on both the vehicle purchase and ongoing operating costs.
How to Use Both Metrics to Set Accurate Range Expectations
The practical takeaway from this analysis isn't to pick one metric and ignore the other — it's to use them together. Here's a simple framework for comparing EVs honestly:
- Find the usable battery capacity, not the gross capacity. This information is available in EPA test documents and reputable EV databases. Subtract the manufacturer's buffer from the advertised pack size if usable capacity isn't published.
- Apply a real-world efficiency correction. The EPA figure is a reasonable baseline, but apply a 10–15% reduction for primarily highway driving and a 25–35% reduction for sustained cold-weather operation to get a conservative, dependable range estimate.
- Calculate your personal range: Usable kWh × adjusted mi/kWh = realistic range. Then subtract another 10–15% for charging buffer (most EV owners avoid charging below 10–15% regularly).
- Stress-test that number against your longest regular trip, not your average commute. Range anxiety emerges at the margins — on the occasional 250-mile day, not the typical 40-mile round trip.
For buyers who want an even more granular accounting of the factors that separate EPA estimates from pavement reality, our piece on why EPA-rated range and real-world range diverge lays out every variable in plain language.
Ultimately, neither battery size nor efficiency is the definitive answer to the question of real-world range. The best EV for your life is the one whose combination of both metrics — evaluated against your specific climate, driving patterns, and charging access — produces dependable range without unnecessary cost. That requires a slightly more nuanced look at the spec sheet, but it's a look that pays dividends over years of ownership.
All claims are backed by peer-reviewed research. Sources on request.