Key Takeaways
Before cross-shopping on EPA range, convert every candidate to miles-per-kWh using usable pack size — not gross capacity. This single step filters out misleadingly high figures inflated by oversized packs.
A vehicle with a larger, heavier pack can post a higher EPA number while being fundamentally less efficient, costing more per mile and performing worse when conditions deviate from the test cycle.
When test-driving an EV in winter, ask the dealer to let you sit with the cabin heat running for 10 minutes before noting the projected range — that's the number you'll actually live with on cold mornings.
HVAC load is the single largest variable accessory drain, and resistive heat systems can draw 4–6 kW continuously, directly reducing usable range in a way the EPA cycle does not capture.
On long road trips, set your navigation to charge targets of 80% departure and 15–20% arrival rather than using the auto-routing default. This keeps the battery in its fastest-charging zone throughout the journey.
Charging speed tapers sharply above 80% SOC on virtually all current EVs; optimizing around this curve cuts total trip time more reliably than hunting for the highest-powered charger.
If you drive at sustained highway speeds above 70 mph regularly, apply a 20–25% personal derating factor to any EPA range figure before comparing vehicles — your real-world number will reliably land in that zone.
Aerodynamic drag increases with the square of velocity; the EPA test cycle does not include extended high-speed segments, making highway-heavy drivers the group most consistently disappointed by sticker range.
For buyers in cold climates, prioritize EVs with heat pumps over resistive heaters — the efficiency difference (up to 3x) means significantly less range sacrificed to cabin warmth in winter.
Heat pumps move thermal energy from the ambient air rather than generating it electrically, consuming roughly one-third the power of resistive elements at the same cabin temperature output.
What EPA Range Ratings Actually Mean
When an EV's window sticker lists a range figure, that number comes from the U.S. Environmental Protection Agency's standardized test procedure — not from driving on public roads. Understanding what that procedure does and does not capture is the first step toward setting realistic expectations.
The EPA uses a two-cycle test: the Urban Dynamometer Driving Schedule (UDDS) and the Highway Fuel Economy Test (HWFET). For EVs, the agency runs these cycles on a dynamometer — essentially a treadmill for cars — in a climate-controlled laboratory set to 72°F (22°C). The combined result is then derated by a correction factor (currently 0.7 for most EVs) intended to better approximate real-world performance. This corrected figure is what appears on the Monroney label.
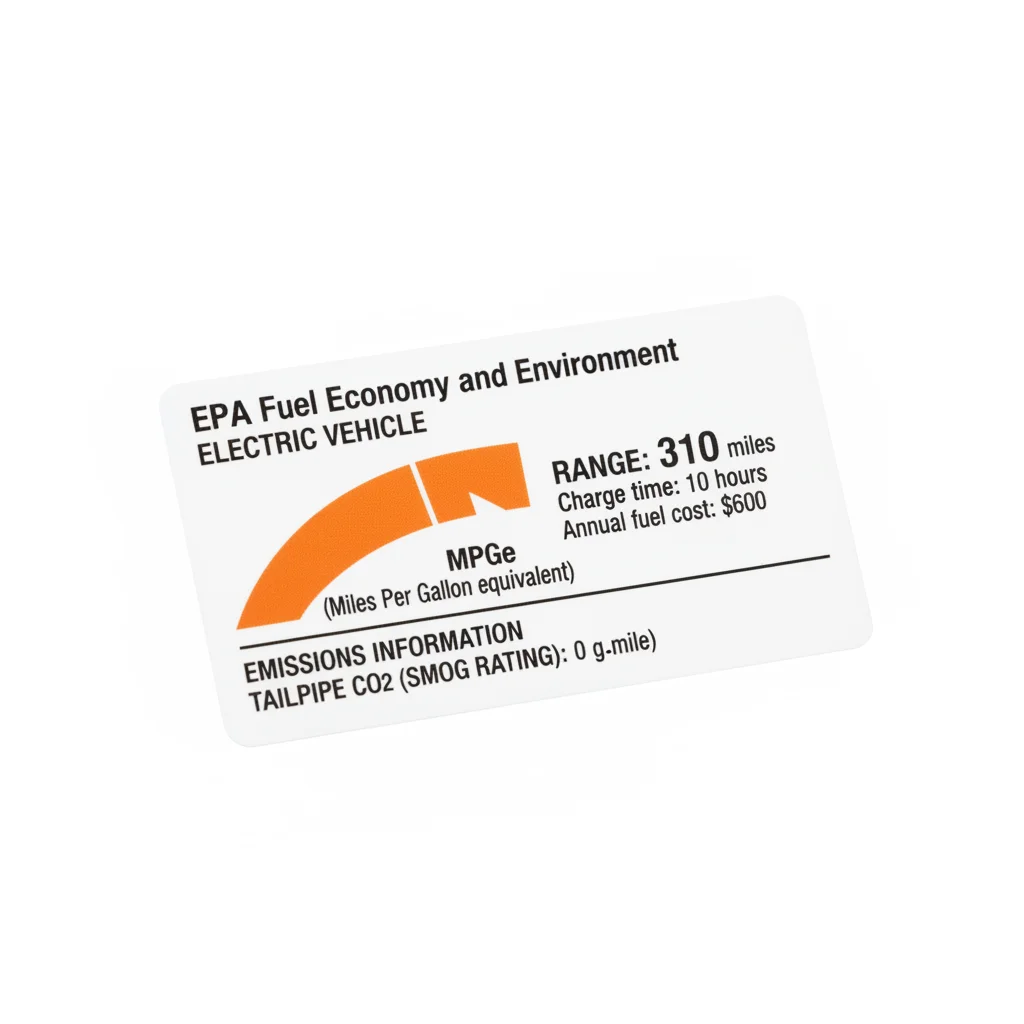
The process sounds rigorous, and it is — within its scope. But the test cycle was originally developed for internal combustion engines and does not fully replicate the variety of conditions EV drivers encounter. It assumes a temperate climate, no accessory loads beyond the baseline, and a driving style that falls between gentle urban commuting and moderate highway cruising.
The EPA itself acknowledges the limitation by publishing a range band rather than a single number on its fueleconomy.gov site, but manufacturers and media typically lead with the optimistic midpoint. For a deeper look at how electric motors and battery systems interact to produce that range figure, see How EVs Work — a plain-language breakdown of EV fundamentals.
EPA Testing: What Changed in 2023
The EPA updated its EV testing methodology in 2023, adding a third test cycle with HVAC systems running to better capture climate-control energy draw. The change reduced some manufacturers' stated range figures by 3–8% but brought ratings closer to real-world performance. If you're comparing a vehicle rated before and after this change, the numbers are not directly comparable without checking the model year of the rating.
Manufacturer Range Claims vs. EPA Ratings
Some manufacturers advertise WLTP (Worldwide Harmonised Light Vehicles Test Procedure) range figures in marketing materials — a European standard that typically yields 10–15% higher numbers than the EPA equivalent. Always verify which standard a range claim references before using it for comparison. The EPA figure is the legally required U.S. disclosure.
LFP Chemistry and Full Charges
If your EV uses lithium iron phosphate (LFP) chemistry — common in base-trim Model 3, Model Y, and several other mainstream EVs — the manufacturer's recommendation to charge to 100% regularly is not a mistake. LFP cells do not experience the same high-SOC stress as NMC cells, and frequent full charges help the battery management system maintain accurate SOC readings.
How Battery Chemistry and Pack Size Drive Range
Range starts with the battery. Two specifications dominate the conversation: usable capacity (measured in kilowatt-hours, or kWh) and cell chemistry — and neither tells the full story alone.
Usable vs. Gross Capacity
Manufacturers reserve a buffer at both the top and bottom of a battery pack to protect cell longevity. A pack with 82 kWh of gross capacity might expose only 75 kWh as usable. This gap varies widely — from roughly 5% on some vehicles to over 10% on others. Comparing gross capacity figures across brands is therefore misleading; usable kWh is the number that matters for range calculations.
10–30%
Real-world range deficit vs. EPA rating
Independent testing by Edmunds, Consumer Reports, and European automotive groups consistently finds this gap under normal driving conditions.
25%
Average range loss at 20°F vs. 70°F
According to Recurrent Auto's analysis of more than 10,000 EVs tracked over multiple seasons.
2.3%
Median annual battery degradation rate
Recurrent Auto's 2023 fleet study of more than 15,000 EVs across multiple brands and model years.
37 miles
Average U.S. daily driving distance
Based on Federal Highway Administration data, meaning most drivers need far less range than they assume.
$0.04
Approximate cost per mile at average U.S. rates
Calculated at $0.16/kWh residential electricity and 4.0 mi/kWh efficiency — roughly 3–4x cheaper than gasoline per mile.
Chemistry Matters More Than Size Alone
Lithium iron phosphate (LFP) cells, common in base trims of several mainstream EVs, are denser, safer, and more tolerant of full charges — but deliver lower energy density than nickel manganese cobalt (NMC) cells. An NMC pack can store more energy in the same physical space, which is why longer-range variants of the same model often switch chemistry at higher trim levels. Solid-state batteries, still in limited commercial production as of 2025, promise significantly higher density and faster charge acceptance, but broad availability remains years away.
The practical takeaway: a 75 kWh NMC pack and a 75 kWh LFP pack will not deliver identical range. Drivetrain efficiency — how effectively the motor converts stored electricity into motion — determines where the difference lands, often 5–10% in the NMC pack's favor under identical conditions.
Before cross-shopping on EPA range, convert every candidate to miles-per-kWh using usable pack size — not gross capacity. This single step filters out misleadingly high figures inflated by oversized packs.
A vehicle with a larger, heavier pack can post a higher EPA number while being fundamentally less efficient, costing more per mile and performing worse when conditions deviate from the test cycle.
When test-driving an EV in winter, ask the dealer to let you sit with the cabin heat running for 10 minutes before noting the projected range — that's the number you'll actually live with on cold mornings.
HVAC load is the single largest variable accessory drain, and resistive heat systems can draw 4–6 kW continuously, directly reducing usable range in a way the EPA cycle does not capture.
On long road trips, set your navigation to charge targets of 80% departure and 15–20% arrival rather than using the auto-routing default. This keeps the battery in its fastest-charging zone throughout the journey.
Charging speed tapers sharply above 80% SOC on virtually all current EVs; optimizing around this curve cuts total trip time more reliably than hunting for the highest-powered charger.
If you drive at sustained highway speeds above 70 mph regularly, apply a 20–25% personal derating factor to any EPA range figure before comparing vehicles — your real-world number will reliably land in that zone.
Aerodynamic drag increases with the square of velocity; the EPA test cycle does not include extended high-speed segments, making highway-heavy drivers the group most consistently disappointed by sticker range.
For buyers in cold climates, prioritize EVs with heat pumps over resistive heaters — the efficiency difference (up to 3x) means significantly less range sacrificed to cabin warmth in winter.
Heat pumps move thermal energy from the ambient air rather than generating it electrically, consuming roughly one-third the power of resistive elements at the same cabin temperature output.
The Real-World Gap: Why You'll See Less Than the Label
Independent testing by organizations including Edmunds, Consumer Reports, and the Norwegian automotive group NAF consistently finds that real-world EV range falls 10–30% short of EPA figures. The gap is not random — it follows predictable patterns tied to how, where, and when a vehicle is driven.
Edmunds' real-world range test, which runs a full charge-to-depletion loop on a fixed highway route at 65 mph, found that the median EV delivered about 87% of its EPA rating under those conditions alone — before factoring in temperature or auxiliary loads. Norwegian testing in sub-zero conditions found deficits exceeding 40% for some vehicles.
“The EPA label is a useful floor for comparison, not a ceiling for expectation. Real-world range is a function of where you live, how you drive, and what the weather is doing — and it will almost always be lower than the sticker.”
— Brian Moody, Executive Editor, Autotrader, frequently cited EV range analyst
Several structural factors widen the gap:
- Higher average speeds: The EPA test tops out below 60 mph; most American highway drivers cruise at 70–80 mph, which increases aerodynamic drag exponentially.
- Accessory loads: Climate control — particularly heat in winter — can draw 3–5 kW continuously, directly consuming range.
- Cargo and passengers: Added weight increases rolling resistance and reduces regenerative braking effectiveness on descents.
- Aggressive acceleration: Unlike ICE vehicles, EVs deliver full torque immediately; frequent hard launches spike energy consumption.
The critical insight is that the EPA gap is not a flaw in the rating system — it is a structural feature of any standardized test. The question is how large your personal gap will be, and that depends almost entirely on your specific driving conditions.
Don't Plan Trips to Zero Range Remaining
Depleting a lithium-ion pack to near zero causes accelerated degradation and, in cold weather, can temporarily reduce charging acceptance rates significantly. Most EV trip planners add a 10–15% buffer automatically, but manually planning to arrive with exactly 0% remaining creates real risk of being stranded — range estimates under stress conditions are less accurate as the pack approaches empty.
Frequent DC Fast Charging Degrades Batteries Faster
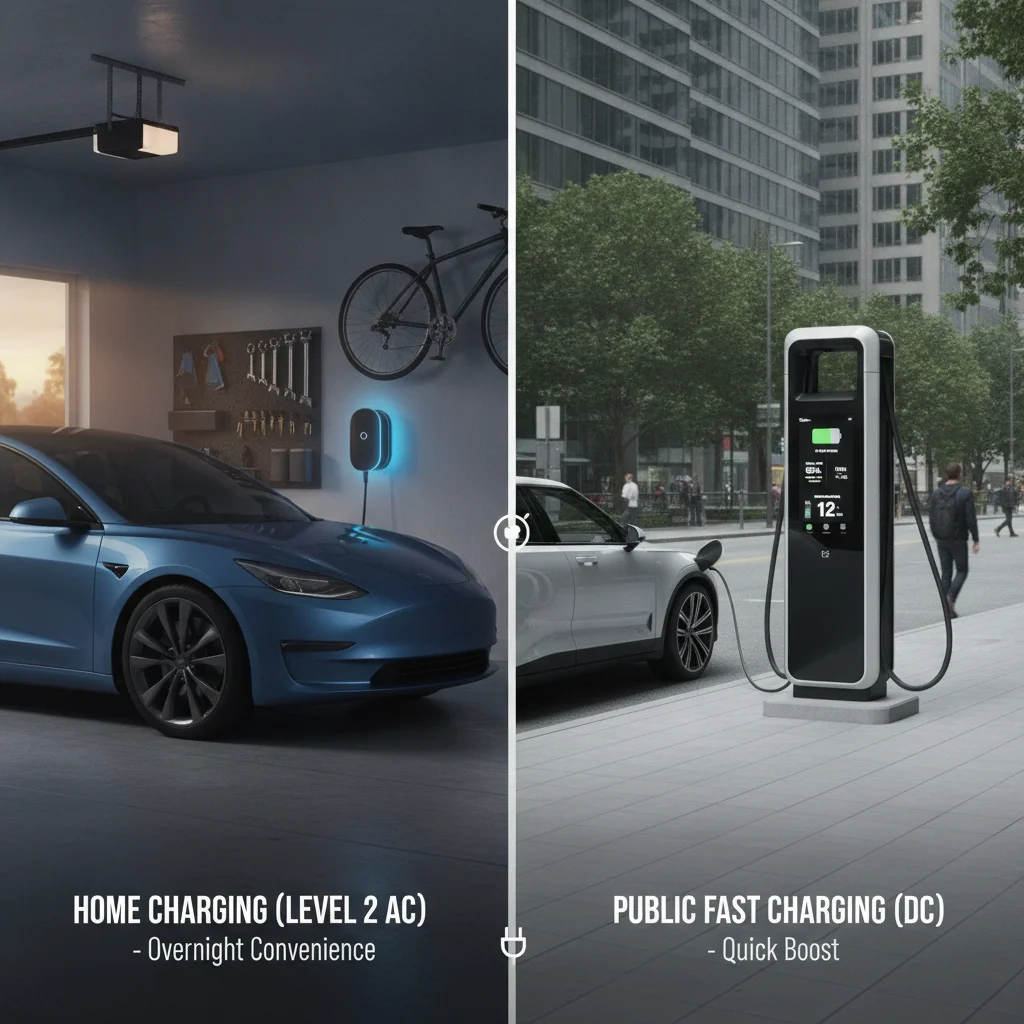
Relying on DC fast charging for the majority of your charge cycles — rather than Level 2 home charging — accelerates battery degradation, particularly on vehicles without active thermal management. Data from Plug In America's battery survey found that vehicles charging primarily via DCFC showed measurably higher degradation rates at equivalent ages compared to Level 2-primary users. Reserve fast charging for road trips when possible.
Beware Overstated Range in Advertising
Manufacturer-quoted range figures in advertising often reference optimal conditions — full charge, ideal temperature, moderate speeds — that represent the vehicle's best-case scenario, not typical daily performance. Some manufacturers have faced regulatory scrutiny and consumer complaints for range overstatement. Always verify the EPA-rated figure independently on fueleconomy.gov rather than relying solely on branded marketing materials.
Temperature, Terrain, and Speed: The Big Three Derating Factors
Of all the variables that erode EV range, three dominate the data: ambient temperature, road grade, and sustained speed. Managing these intelligently is the difference between range anxiety and confident daily driving.
Temperature
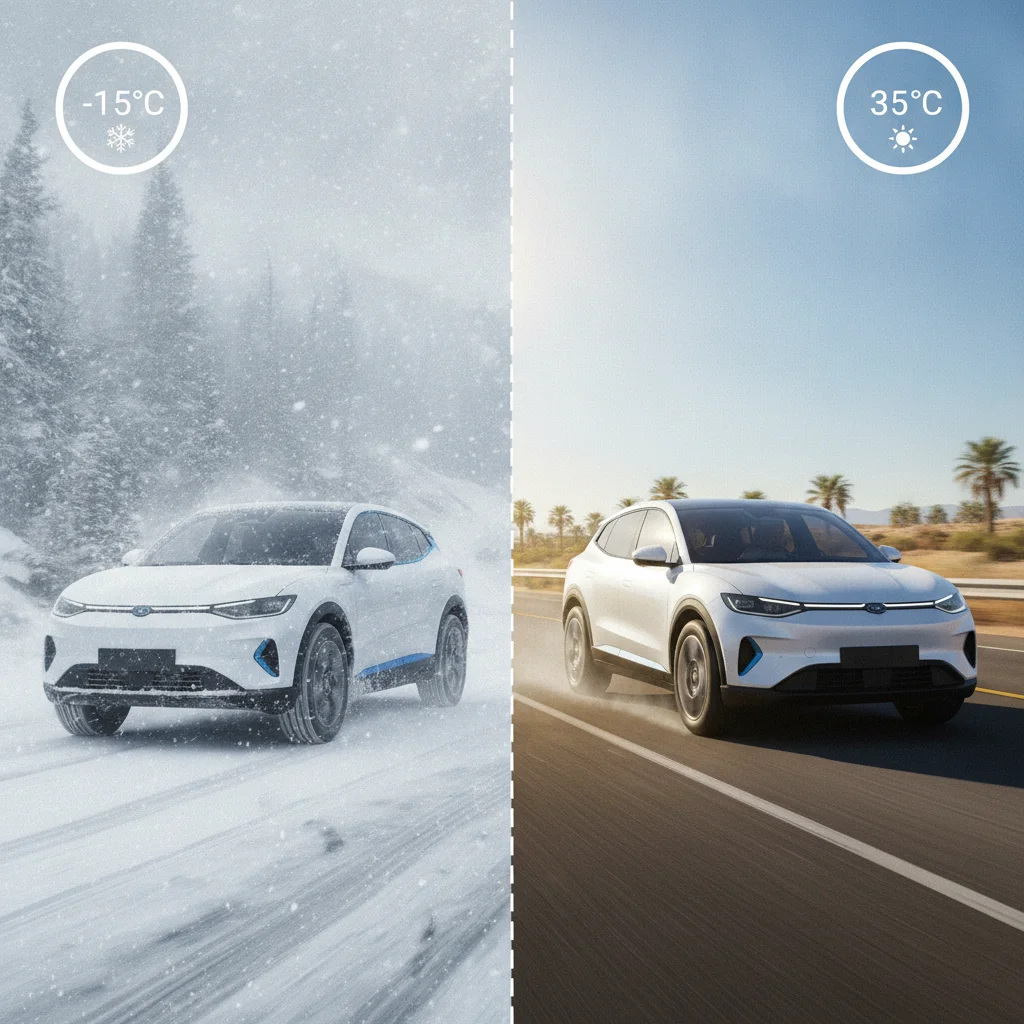
Lithium-ion cells lose electrochemical efficiency in cold weather. Recurrent Auto's analysis of more than 10,000 EVs found range declined by an average of 25% at 20°F (−7°C) compared to performance at 70°F (21°C) — and that figure includes vehicles with heat pumps, which are meaningfully more efficient than resistive heaters. At 0°F (−18°C), some older vehicles without heat pumps lose 40–50% of rated range.
Heat also degrades performance, though less acutely. At temperatures above 95°F (35°C), battery management systems divert energy to cooling, and capacity can decline 5–10%. The sweet spot for lithium-ion efficiency is roughly 60–85°F (15–29°C) — not coincidentally the range covered by the EPA test.
Terrain
Climbing consumes energy; descending recovers it — but not symmetrically. Regenerative braking on modern EVs recaptures 70–80% of the energy expended climbing, meaning net energy cost of elevation change is real but smaller than raw climb numbers suggest. A 1,000-foot elevation gain followed by a 1,000-foot descent results in a net energy cost of roughly 20–30% of the climb energy, depending on regen efficiency and speed.
Speed
Aerodynamic drag increases with the square of velocity, meaning energy consumption rises sharply at highway speeds. An EV rated at 300 miles might deliver that figure at 55 mph but only 220–240 miles at a steady 80 mph — a 20–27% reduction from speed alone. This is the single most controllable derating factor for most drivers.
Before cross-shopping on EPA range, convert every candidate to miles-per-kWh using usable pack size — not gross capacity. This single step filters out misleadingly high figures inflated by oversized packs.
A vehicle with a larger, heavier pack can post a higher EPA number while being fundamentally less efficient, costing more per mile and performing worse when conditions deviate from the test cycle.
When test-driving an EV in winter, ask the dealer to let you sit with the cabin heat running for 10 minutes before noting the projected range — that's the number you'll actually live with on cold mornings.
HVAC load is the single largest variable accessory drain, and resistive heat systems can draw 4–6 kW continuously, directly reducing usable range in a way the EPA cycle does not capture.
On long road trips, set your navigation to charge targets of 80% departure and 15–20% arrival rather than using the auto-routing default. This keeps the battery in its fastest-charging zone throughout the journey.
Charging speed tapers sharply above 80% SOC on virtually all current EVs; optimizing around this curve cuts total trip time more reliably than hunting for the highest-powered charger.
If you drive at sustained highway speeds above 70 mph regularly, apply a 20–25% personal derating factor to any EPA range figure before comparing vehicles — your real-world number will reliably land in that zone.
Aerodynamic drag increases with the square of velocity; the EPA test cycle does not include extended high-speed segments, making highway-heavy drivers the group most consistently disappointed by sticker range.
For buyers in cold climates, prioritize EVs with heat pumps over resistive heaters — the efficiency difference (up to 3x) means significantly less range sacrificed to cabin warmth in winter.
Heat pumps move thermal energy from the ambient air rather than generating it electrically, consuming roughly one-third the power of resistive elements at the same cabin temperature output.
How to Compare EVs on Range Honestly
Raw EPA miles is a poor basis for cross-shopping because it combines efficiency and pack size in a single number. A vehicle with a larger pack but worse efficiency can post a higher EPA number than a more efficient vehicle with a smaller pack — yet cost more to operate and perform worse in cold weather or at highway speeds.
A Framework for Honest Comparison
- Identify usable kWh — not gross capacity — for each vehicle under consideration.
- Calculate miles per kWh from the EPA rating: divide EPA miles by usable kWh. This is the vehicle's rated efficiency.
- Apply a personal derating factor. If you drive primarily at highway speeds in a cold climate, apply a 25–35% deduction. Mild-climate urban drivers might use 10–15%.
- Compare adjusted figures side by side.
This approach reveals, for example, that a vehicle with a 358-mile EPA rating and a 100 kWh pack (3.6 mi/kWh) is less efficient than one with a 300-mile EPA rating and a 75 kWh pack (4.0 mi/kWh). The efficient vehicle will cost less to charge, perform better in cold weather, and maintain a larger usable share of its rated range under real-world conditions.

Third-party testing databases — particularly Edmunds' real-world EV range tracker and the EPA's own fueleconomy.gov comparison tool — provide a useful sanity check. Cross-referencing manufacturer claims against independent data is always worthwhile before signing anything.
Use Edmunds' Real-World Range Tool First
Before relying on EPA figures, check Edmunds' real-world range database at their dedicated EV testing page. Their charge-to-depletion highway test at 65 mph provides a consistent, apples-to-apples comparison across dozens of models. Cross-referencing this with EPA ratings tells you immediately which vehicles have the smallest real-world gaps — a strong indicator of efficient aerodynamics and thermal management.
Plan Long-Distance Stops Between 20% and 80% SOC
On multi-stop road trips, structure your charging sessions to arrive near 15–20% and depart near 80%. This keeps you in the fastest part of the charging curve throughout the trip, minimizing total stop time. Most built-in navigation systems on newer EVs can optimize for this automatically when a destination is entered.
Pre-Condition While Still Plugged In
In cold weather, activate cabin pre-conditioning while the vehicle is still connected to the charger — not after unplugging. This heats the cabin and warms the battery using grid power rather than stored charge, preserving several miles of effective range on cold mornings. Almost every current EV supports this via the companion app.
Efficiency Metrics Every EV Buyer Should Know
The EV equivalent of miles per gallon is MPGe (miles per gallon equivalent), a unit the EPA uses to normalize EV efficiency against gasoline. One gallon of gasoline contains approximately 33.7 kWh of energy, so an EV consuming 33.7 kWh per 100 miles earns an MPGe of 100. Higher MPGe means lower operating costs.
But MPGe can obscure real cost because electricity prices vary enormously by region and time of day. A more actionable metric is cost per mile:
Cost per mile = (local electricity rate in $/kWh) ÷ (vehicle efficiency in mi/kWh)
At a U.S. average residential rate of $0.16/kWh and an efficiency of 4.0 mi/kWh, cost per mile equals $0.04 — compared to roughly $0.14–$0.18 per mile for a 30 mpg gasoline vehicle at $4.50/gallon. The savings are real, but they shrink substantially for drivers who rely heavily on DC fast charging networks, where rates of $0.35–$0.50/kWh are common.
10–30%
Real-world range deficit vs. EPA rating
Independent testing by Edmunds, Consumer Reports, and European automotive groups consistently finds this gap under normal driving conditions.
25%
Average range loss at 20°F vs. 70°F
According to Recurrent Auto's analysis of more than 10,000 EVs tracked over multiple seasons.
2.3%
Median annual battery degradation rate
Recurrent Auto's 2023 fleet study of more than 15,000 EVs across multiple brands and model years.
37 miles
Average U.S. daily driving distance
Based on Federal Highway Administration data, meaning most drivers need far less range than they assume.
$0.04
Approximate cost per mile at average U.S. rates
Calculated at $0.16/kWh residential electricity and 4.0 mi/kWh efficiency — roughly 3–4x cheaper than gasoline per mile.
Understanding these metrics is also directly relevant to insurance and ownership costs. Efficient EVs carry lower per-mile energy costs, which affects the total cost of ownership calculations that smart buyers use to evaluate purchase decisions. For context on how insurance costs fit into the broader EV ownership picture, EV Insurance Guide covers the full premium landscape.
The Real Cost of DC Fast Charging on Your Budget
At public DC fast chargers, electricity costs of $0.35–$0.50/kWh eliminate most of the per-mile cost advantage EVs hold over gasoline vehicles. Drivers without home charging who rely primarily on public DCFC networks may find operating costs comparable to — or exceeding — an efficient gas vehicle. If home or workplace charging isn't available to you, build this into your total cost of ownership calculation before purchase.
Battery Warranty Thresholds Vary — Read the Fine Print
Federal law requires EV manufacturers to warrant battery packs for at least 8 years or 100,000 miles, but the capacity threshold triggering replacement coverage varies by manufacturer — commonly 70%, but some set it as high as 75% or as low as 60%. A battery that degrades below the stated threshold before the warranty period ends qualifies for replacement; one that degrades to 72% under a 70%-threshold warranty does not, even if performance is noticeably diminished. Know your manufacturer's specific threshold before buying.
Charging Strategy and Its Effect on Usable Range
How you charge directly affects how much range you can access — and how long the battery retains capacity over years of use.
The 80% Rule
Most EV manufacturers recommend limiting daily charges to 80% state of charge (SOC) for routine use, reserving full charges for long trips. The recommendation exists because lithium-ion cells experience elevated stress at high SOC, accelerating the micro-structural changes that reduce capacity over time. Charging to 80% daily and departing with roughly 70–75% effective range is a practical operating profile that meaningfully extends pack longevity.
For LFP chemistry — used in base Tesla Model 3, Model Y, and several other mainstream EVs — full charges are not only tolerated but encouraged by manufacturers. LFP cells are chemically stable at 100% SOC, and the BMS in these vehicles actually uses regular full charges to recalibrate the state-of-charge gauge.
DC Fast Charging and Range Planning
On long trips, DC fast charging (DCFC) introduces its own range consideration: charge speed tapers as the battery approaches 80%. Charging from 20% to 80% is dramatically faster than pushing from 80% to 100%. Most trip-planning apps — including those built into the vehicle — route around this by targeting 80% arrival and 80% departure states, which is the correct approach for maximizing charging efficiency on multi-stop journeys.
Use Edmunds' Real-World Range Tool First
Before relying on EPA figures, check Edmunds' real-world range database at their dedicated EV testing page. Their charge-to-depletion highway test at 65 mph provides a consistent, apples-to-apples comparison across dozens of models. Cross-referencing this with EPA ratings tells you immediately which vehicles have the smallest real-world gaps — a strong indicator of efficient aerodynamics and thermal management.
Plan Long-Distance Stops Between 20% and 80% SOC
On multi-stop road trips, structure your charging sessions to arrive near 15–20% and depart near 80%. This keeps you in the fastest part of the charging curve throughout the trip, minimizing total stop time. Most built-in navigation systems on newer EVs can optimize for this automatically when a destination is entered.
Pre-Condition While Still Plugged In
In cold weather, activate cabin pre-conditioning while the vehicle is still connected to the charger — not after unplugging. This heats the cabin and warms the battery using grid power rather than stored charge, preserving several miles of effective range on cold mornings. Almost every current EV supports this via the companion app.
One often-overlooked factor: arriving at a charger with less than 10–15% remaining increases thermal stress risk and may trigger reduced charging rates as the BMS protects a cold or depleted pack. Planning to arrive with 15–20% is a practical buffer, not excessive caution.
Don't Plan Trips to Zero Range Remaining
Depleting a lithium-ion pack to near zero causes accelerated degradation and, in cold weather, can temporarily reduce charging acceptance rates significantly. Most EV trip planners add a 10–15% buffer automatically, but manually planning to arrive with exactly 0% remaining creates real risk of being stranded — range estimates under stress conditions are less accurate as the pack approaches empty.
Frequent DC Fast Charging Degrades Batteries Faster
Relying on DC fast charging for the majority of your charge cycles — rather than Level 2 home charging — accelerates battery degradation, particularly on vehicles without active thermal management. Data from Plug In America's battery survey found that vehicles charging primarily via DCFC showed measurably higher degradation rates at equivalent ages compared to Level 2-primary users. Reserve fast charging for road trips when possible.
Beware Overstated Range in Advertising
Manufacturer-quoted range figures in advertising often reference optimal conditions — full charge, ideal temperature, moderate speeds — that represent the vehicle's best-case scenario, not typical daily performance. Some manufacturers have faced regulatory scrutiny and consumer complaints for range overstatement. Always verify the EPA-rated figure independently on fueleconomy.gov rather than relying solely on branded marketing materials.
Long-Term Range: Battery Degradation Over Time
No EV maintains its original range indefinitely. Battery degradation — the gradual reduction in a pack's ability to hold charge — is an inescapable consequence of electrochemical cycling. The rate, however, varies considerably by chemistry, usage pattern, climate, and charging behavior.
Recurrent Auto's 2023 fleet analysis of more than 15,000 EVs found median degradation of approximately 2.3% per year across a diverse sample of models and ages. A vehicle rated at 300 miles new would, under median conditions, deliver roughly 255 miles at five years old — a 15% reduction.
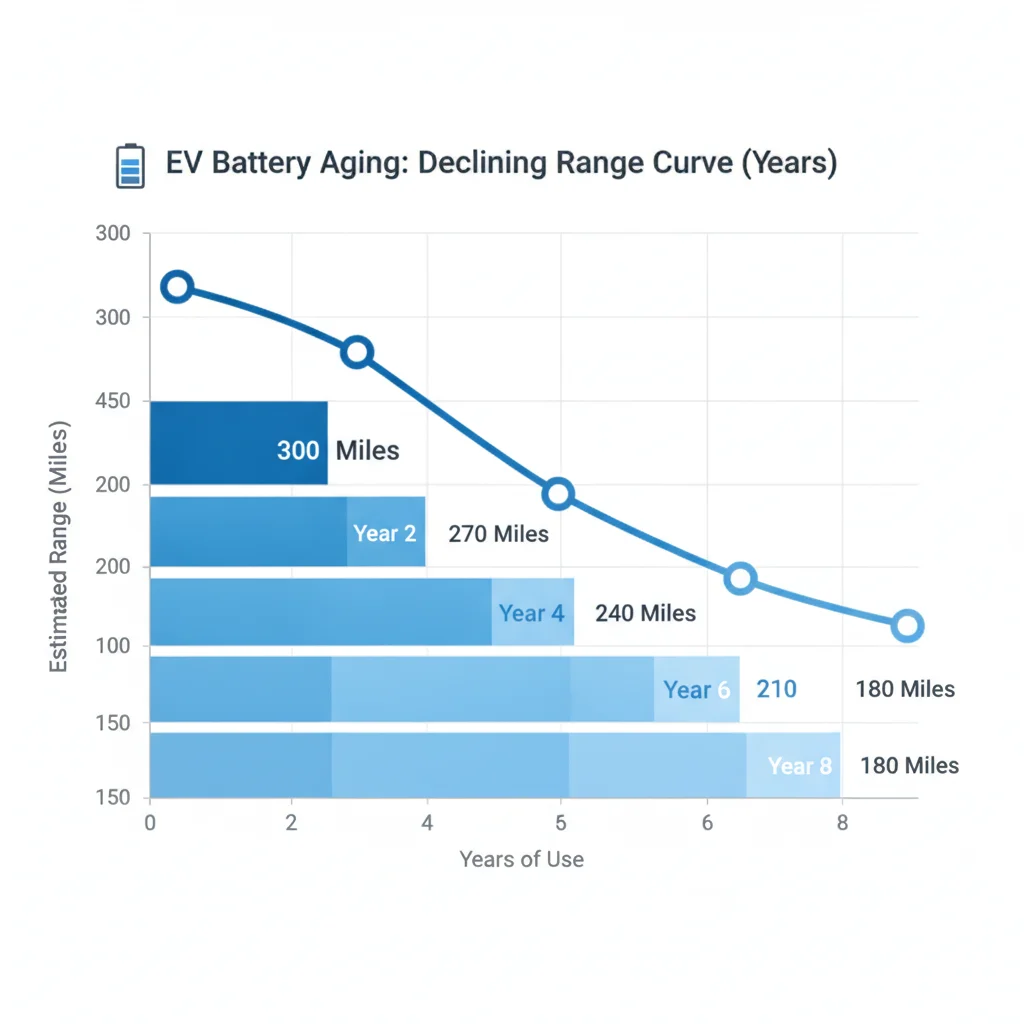
Factors that accelerate degradation include:
- Frequent DC fast charging (particularly at high power levels above 150 kW)
- Regularly charging to 100% and/or discharging below 10%
- Sustained operation in extreme heat without adequate thermal management
- Long periods of storage at high or low SOC
Factors that slow degradation include:
- Active liquid thermal management (standard on most premium EVs, increasingly common on mainstream models)
- Charging primarily on Level 2 AC power
- Operating in mild climates
- Maintaining SOC in the 20–80% band during daily use
Most manufacturers warrant the battery for 8 years or 100,000 miles, with a minimum capacity threshold — typically 70% of original — triggering warranty coverage. Knowing that threshold matters: a 300-mile vehicle whose battery degrades to 69% of original capacity (207 miles) is technically warranty-eligible for replacement before crossing 100,000 miles if covered under an 8-year policy.
The Real Cost of DC Fast Charging on Your Budget
At public DC fast chargers, electricity costs of $0.35–$0.50/kWh eliminate most of the per-mile cost advantage EVs hold over gasoline vehicles. Drivers without home charging who rely primarily on public DCFC networks may find operating costs comparable to — or exceeding — an efficient gas vehicle. If home or workplace charging isn't available to you, build this into your total cost of ownership calculation before purchase.
Battery Warranty Thresholds Vary — Read the Fine Print
Federal law requires EV manufacturers to warrant battery packs for at least 8 years or 100,000 miles, but the capacity threshold triggering replacement coverage varies by manufacturer — commonly 70%, but some set it as high as 75% or as low as 60%. A battery that degrades below the stated threshold before the warranty period ends qualifies for replacement; one that degrades to 72% under a 70%-threshold warranty does not, even if performance is noticeably diminished. Know your manufacturer's specific threshold before buying.
Matching the Right EV Range to Your Lifestyle
Range anxiety is, in most cases, a mismatch between the range you chose and the range you actually need — not an inherent property of electric vehicles. The data consistently shows that U.S. drivers average 37 miles per day, and roughly 95% of trips are under 30 miles. For the vast majority of drivers, virtually any modern EV provides more than adequate range for daily use.
A Practical Sizing Framework
Rather than defaulting to the highest range option available, consider:
- Daily driving radius
- Multiply your average daily mileage by 1.3 to account for real-world derating. This is your minimum comfortable range.
- Charging access
- If you have reliable home or workplace Level 2 charging, you start every day with a full (or target) charge. Range requirements shrink substantially.
- Occasional long trips
- For road trips, the DC fast-charging network matters more than pack size. A vehicle with 250 miles of real-world range and reliable 150 kW DCFC access will complete most long-haul trips faster than a vehicle with 320 miles of range but slower charging.
- Climate penalty
- If you live in a cold-weather region, build a 25–30% cold-weather buffer into your minimum range calculation.
EPA fueleconomy.gov EV Range Tool
The official U.S. government database of EPA-rated range and efficiency figures for every certified EV. Use the side-by-side comparison feature to evaluate up to three vehicles simultaneously on standardized metrics.
Edmunds Real-World EV Range Tracker
Edmunds conducts standardized charge-to-depletion highway range tests on current EVs and publishes the results. Comparing EPA ratings to Edmunds' real-world figures immediately identifies which vehicles have the smallest performance gap.
Recurrent Auto Battery Health Reports
A free tool that aggregates real-world battery degradation data from tens of thousands of EVs by model and year, helping buyers evaluate long-term range retention before purchasing a used EV.
PlugShare Charging Network Map
An interactive map of public charging stations across North America, filterable by connector type and charging speed. Essential for evaluating charging infrastructure along your regular routes before committing to a specific EV.
A Better Route Planner (ABRP)
A trip-planning calculator that accounts for your specific vehicle's efficiency, real-time weather, and elevation changes to produce accurate range estimates and optimal charging stop recommendations for any route.
Plug In America EV Owner Survey
A community-driven annual survey collecting real-world battery health, charging behavior, and range data from thousands of EV owners. Provides useful peer benchmarks for how specific models age in real-world use.
The honest bottom line: for most buyers, a vehicle offering 250–300 miles of EPA-rated range is more than sufficient for daily driving and capable of managing most road trips. Chasing the longest-range option available typically means paying a significant premium for capacity that rarely gets used — and carrying around a heavier, more expensive pack in the process.
For buyers navigating the full financial picture of EV ownership — from acquisition costs to insurance — EV insurance considerations are an important piece of the total cost equation that deserves equal attention alongside range.
Before cross-shopping on EPA range, convert every candidate to miles-per-kWh using usable pack size — not gross capacity. This single step filters out misleadingly high figures inflated by oversized packs.
A vehicle with a larger, heavier pack can post a higher EPA number while being fundamentally less efficient, costing more per mile and performing worse when conditions deviate from the test cycle.
When test-driving an EV in winter, ask the dealer to let you sit with the cabin heat running for 10 minutes before noting the projected range — that's the number you'll actually live with on cold mornings.
HVAC load is the single largest variable accessory drain, and resistive heat systems can draw 4–6 kW continuously, directly reducing usable range in a way the EPA cycle does not capture.
On long road trips, set your navigation to charge targets of 80% departure and 15–20% arrival rather than using the auto-routing default. This keeps the battery in its fastest-charging zone throughout the journey.
Charging speed tapers sharply above 80% SOC on virtually all current EVs; optimizing around this curve cuts total trip time more reliably than hunting for the highest-powered charger.
If you drive at sustained highway speeds above 70 mph regularly, apply a 20–25% personal derating factor to any EPA range figure before comparing vehicles — your real-world number will reliably land in that zone.
Aerodynamic drag increases with the square of velocity; the EPA test cycle does not include extended high-speed segments, making highway-heavy drivers the group most consistently disappointed by sticker range.
For buyers in cold climates, prioritize EVs with heat pumps over resistive heaters — the efficiency difference (up to 3x) means significantly less range sacrificed to cabin warmth in winter.
Heat pumps move thermal energy from the ambient air rather than generating it electrically, consuming roughly one-third the power of resistive elements at the same cabin temperature output.
All claims are backed by peer-reviewed research. Sources on request.