Key Takeaways
Our Verdict
The EPA figure is a useful baseline for comparing EVs on equal footing, but it reliably overstates what highway drivers and cold-weather owners will experience. Third-party testers fill that gap with real-road data, though each brings its own biases and conditions. For the most accurate picture of real-world range, cross-reference at least two independent sources that match your driving style and climate.
| Best for | Recommended |
|---|---|
| Comparing EVs side-by-side on a level playing field | EPA Rating |
| Predominantly highway drivers wanting realistic range expectations | Edmunds Real-World Test |
| Cold-climate owners in northern states or Europe | ADAC / Scandinavian Testing |
| Enthusiasts wanting granular, model-specific deep dives | Björn Nyland / Out of Spec Testing |
Why the Number on the Window Sticker Is Just a Starting Point
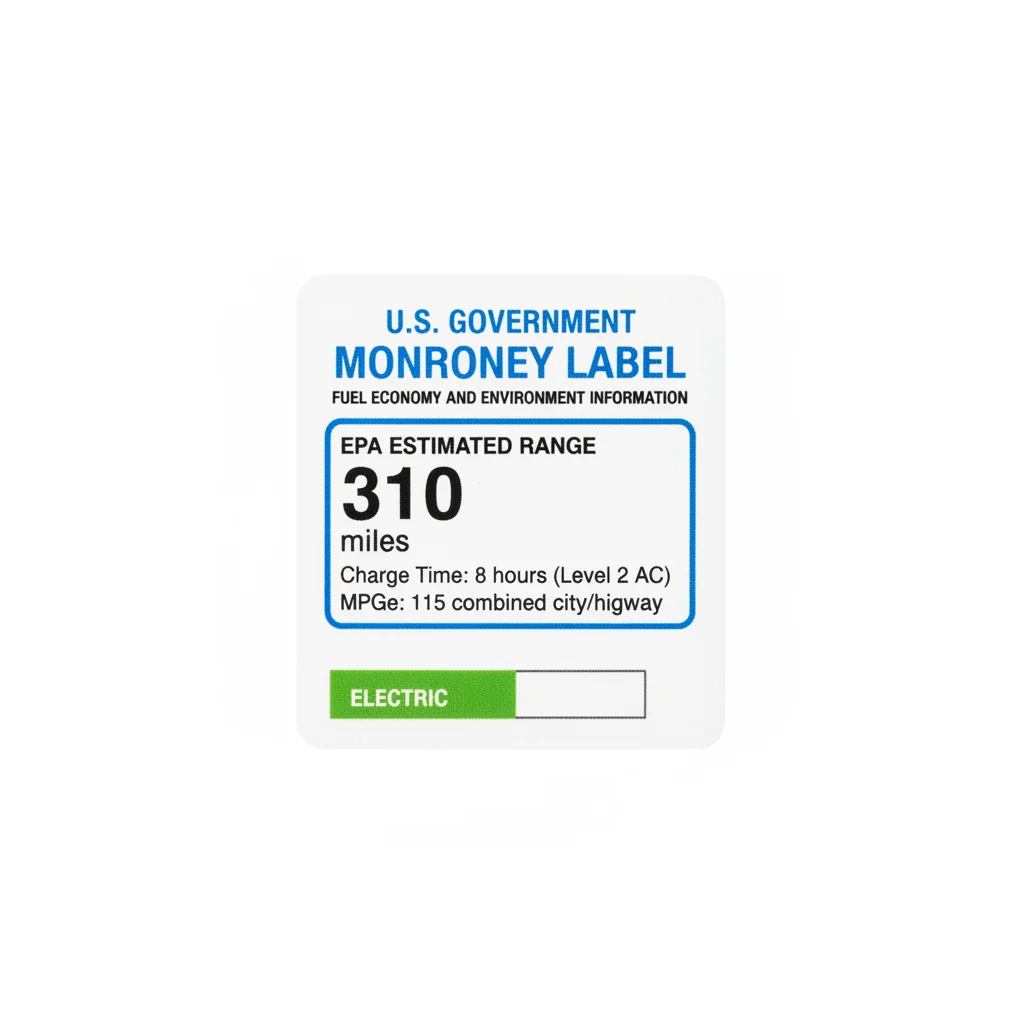
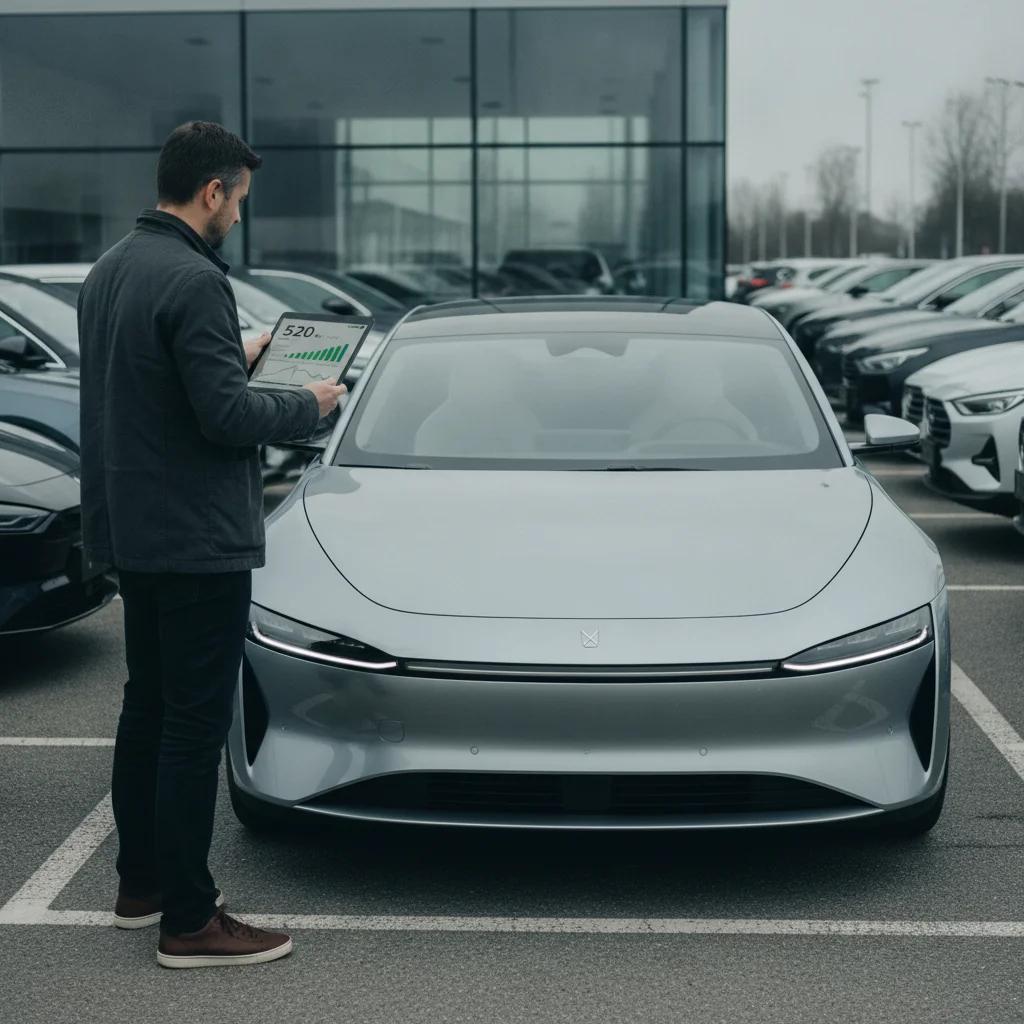
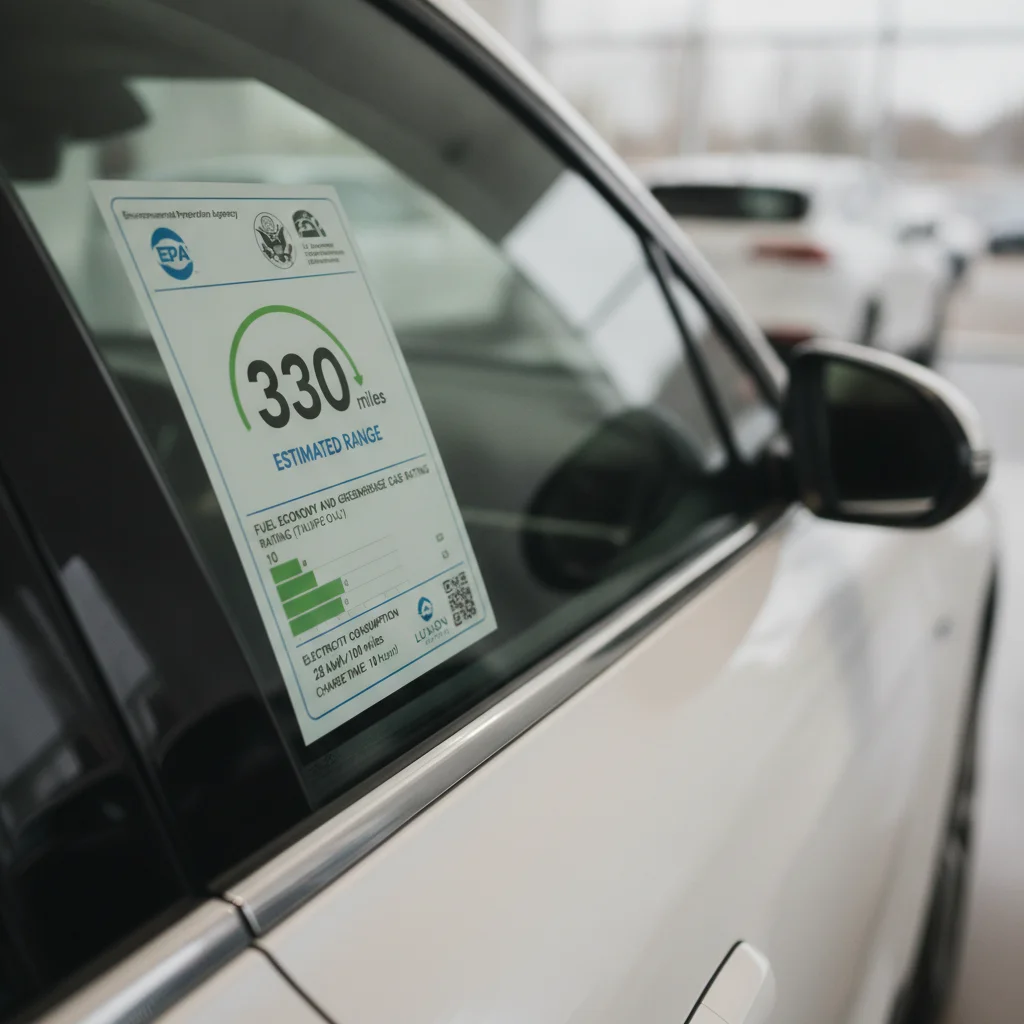
Walk onto any dealership lot and the EPA-estimated range printed on an EV's window sticker looks authoritative — a clean, single number that implies precision. But that figure is the product of a controlled laboratory procedure designed for regulatory consistency, not for predicting what you'll see on your next road trip. As the EPA range ratings explained in depth, the agency's test cycle prioritizes repeatability and cross-brand fairness, not real-world fidelity.
That gap between the sticker and the odometer has spawned an entire ecosystem of independent testing. Organizations ranging from European automotive clubs to American consumer outlets and YouTube-based engineers now run their own structured range evaluations. Each applies a different methodology, targets different use cases, and comes with its own blind spots.
Understanding what each test actually measures — and what it deliberately ignores — is the fastest way to set a realistic range expectation before you buy. Before you buy, checking an EV's real-world range performance from multiple sources is one of the smartest moves a prospective owner can make.
How the EPA Test Actually Works
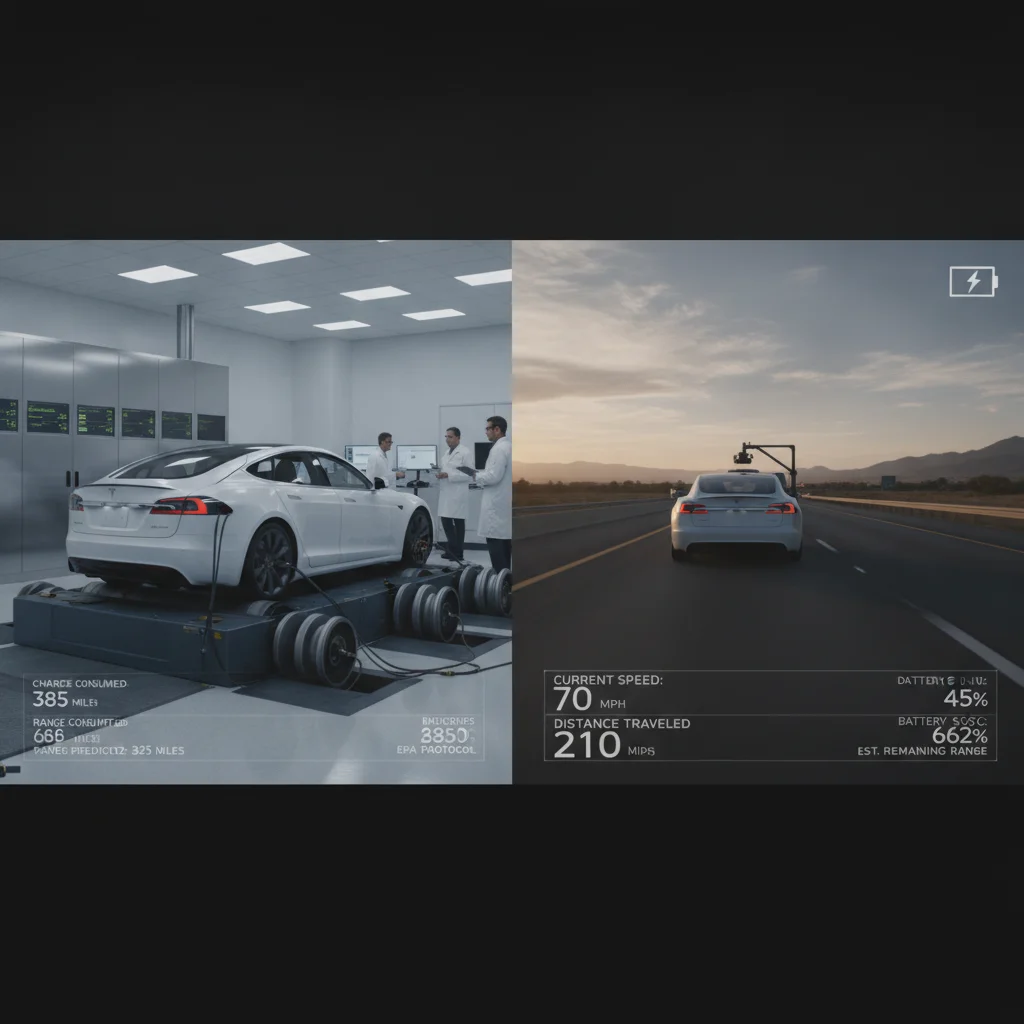
The EPA does not test vehicles itself — it certifies results submitted by automakers, with periodic audits at its Ann Arbor, Michigan facility. Manufacturers run their EVs through two standardized dynamometer cycles: the Urban Dynamometer Driving Schedule (UDDS), which simulates stop-and-go city driving at an average speed of about 21 mph, and the Highway Fuel Economy Test (HWFET), which simulates a 48-mile freeway route averaging roughly 48 mph. These are then blended at a 55/45 city/highway weighting.
Critically, the test is conducted at a controlled ambient temperature of 68–86°F (20–30°C), with climate control systems off. The vehicle charges to 100%, depletes to a cutoff point, and the energy consumed is used to calculate a miles-per-kWh figure that is then converted into a range estimate — with a 30% adjustment factor applied to account for some real-world variation.
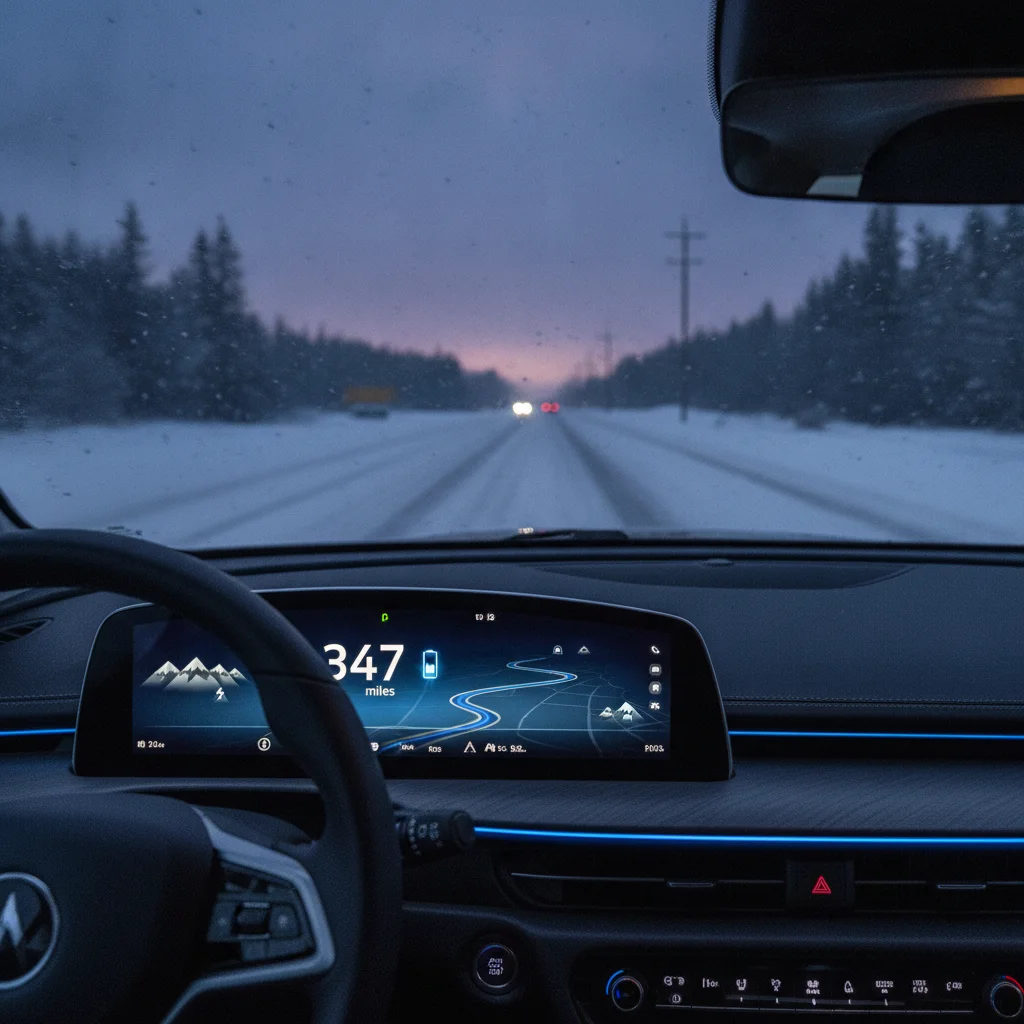
That adjustment factor was itself controversial when introduced. Critics argued it was calibrated for gasoline engine inefficiencies and does not adequately account for the sensitivity of EV batteries to temperature, speed, and auxiliary loads. The result is a number that tends to be most accurate for city driving in mild weather and least accurate for sustained highway cruising or cold-climate operation.
10–30%
Typical EPA overstatement vs. highway reality
Edmunds' structured real-world testing at 70 mph consistently returns figures 10–20% below EPA ratings, with faster speeds widening the gap further.
~50%
Range loss in extreme cold for some EVs
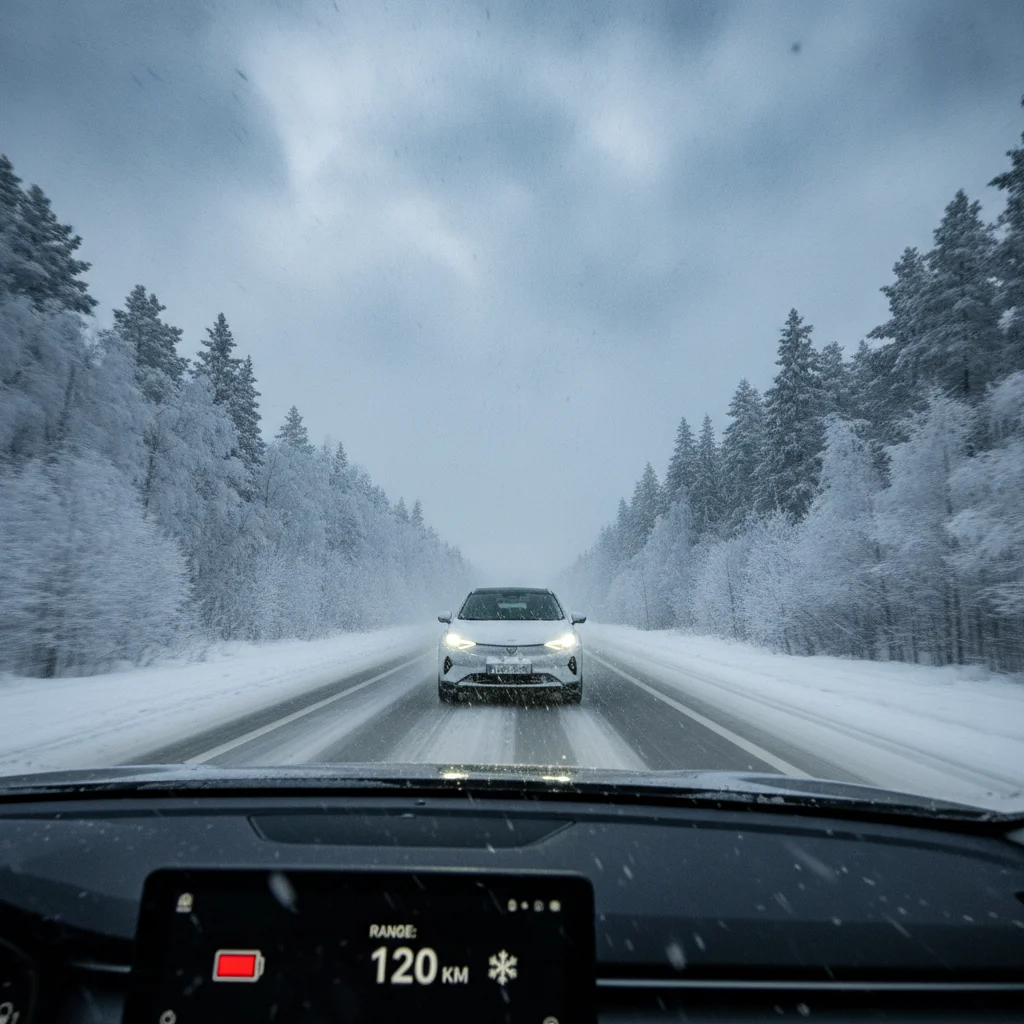
ADAC cold-weather tests at −10°C (14°F) have documented range losses exceeding 40–50% on select models compared to their WLTP ratings.
160 miles
Result spread across tests for one model
The Tesla Model Y Long Range AWD produces a 160-mile spread between its best (Björn Nyland no-HVAC) and worst (ADAC cold) third-party results.
30%
EPA adjustment factor applied to raw test data
The EPA applies a roughly 30% correction factor to raw dynamometer energy consumption data before publishing the official range estimate.
25–35%
Recommended deduction from WLTP for U.S. highway use
European consumer groups and independent testers suggest reducing WLTP figures by 25–35% to approximate real-world sustained U.S. freeway range.
Third-Party Testing Methodologies: A Field Guide
Independent testers have stepped into the gap left by the EPA's laboratory constraints. Their approaches vary widely, which is itself informative — each reveals a different dimension of real-world performance.
Edmunds (United States)
Edmunds operates one of the most structured American third-party programs. Their standard real-world test drives a fixed 162-mile loop on California roads at a steady 70 mph, with climate control set to 72°F. Starting from 100% charge and stopping at 0%, the test is highly repeatable and directly comparable across models. Because it is conducted at a consistent highway speed with HVAC active, Edmunds results typically come in 10–20% below EPA figures — a useful correction for the large share of American drivers who spend significant time on interstates.
ADAC (Germany)
The Allgemeiner Deutscher Automobil-Club, Europe's largest automotive organization, uses the ECOTEST protocol, which runs vehicles on a real road (not a dynamometer) through a mix of urban and rural routes. ADAC also publishes cold-weather results at 15°F (−10°C), making it arguably the most complete data set available for evaluating thermal vulnerability. ADAC figures are expressed in the WLTP framework, which is already more demanding than the EPA cycle, and cold-weather derating from ADAC data can reveal range losses of 30–50% on some vehicles.
Björn Nyland (Scandinavia)
Norwegian EV influencer and engineer Björn Nyland has conducted hundreds of standardized range tests across virtually every EV sold globally. His methodology: drive at exactly 90 km/h (56 mph) on a set route with no climate control, from 100% to 0%, recording ambient temperature throughout. The consistency across hundreds of tests makes cross-model comparisons highly reliable. The tradeoff is that disabling HVAC produces optimistic figures relative to real-world winter use, and 56 mph is below typical American highway speeds.
Out of Spec (United States)
Kyle Conner's Out of Spec Studios runs tests at 70 mph and 82 mph, with HVAC active, capturing both a realistic American highway scenario and a stress-test scenario mimicking faster Interstate travel. The dual-speed approach is particularly valuable because it quantifies the aerodynamic penalty of speed on range — data the EPA test does not generate. Out of Spec also tests at cold temperatures on occasion, adding another dimension for northern-state buyers.
| EPA | Edmunds | ADAC | Björn Nyland | Out of Spec | |
|---|---|---|---|---|---|
| Test environment | Laboratory dynamometer | Real road, California | Real road, Germany | Real road, Scandinavia | Real road, United States |
| Speed profile | ~21–48 mph blended | Constant 70 mph | Mixed urban/rural | Constant 56 mph | 70 mph and 82 mph |
| HVAC active | No | Yes (72°F) | Yes | No | Yes |
| Cold-weather data | None | None | Yes (−10°C) | Partial | Occasional |
| Models covered per year | All U.S. market EVs | Select new models | European market focus | Very broad globally | Select new models |
| Typical gap vs. EPA | Baseline | 10–20% lower | Similar to WLTP | Varies (no HVAC) | 15–30% lower at 82 mph |
| Best use case | Level comparison | Highway commuters | Cold-climate owners | Cross-model benchmarking | Speed-sensitivity analysis |
Range anxiety versus reality is heavily shaped by which test you read first — a point worth keeping in mind as you evaluate these numbers.
Where Each Methodology Falls Short
No test is a perfect proxy for your driving life. Each methodology optimizes for something and inevitably sacrifices something else.
Don't Trust a Single Source Blindly
Every third-party test, however rigorous, reflects specific conditions that may not match your driving life. A California highway test in October tells you little about January range in Chicago. Always check whether the testing conditions — speed, temperature, HVAC state — align with your actual use before treating a result as your personal range expectation.
Manufacturer-Provided 'Real-World' Claims Require Scrutiny
Some automakers publish their own 'real-world range' figures derived from internal testing or fleet data. These are not independently verified and have historically trended optimistic. Treat them with the same skepticism you'd apply to the EPA sticker — and seek third-party confirmation before making a purchase decision.
EPA Limitations
The 68–86°F testing band means cold-weather performance is entirely invisible. Running climate control off removes one of the biggest real-world energy draws. The 55/45 city/highway blend is skewed toward urban driving, which flatters EVs relative to their highway behavior. And because automakers self-report with selective auditing, there is a historical record of overstated figures — the EPA required several manufacturers to revise ratings downward after independent testing exposed discrepancies.
Edmunds Limitations
The fixed California route means consistent mild weather. Owners in Minnesota or Maine will not find cold-weather data here. Additionally, a 70-mph constant-speed highway loop doesn't capture urban regenerative braking, which benefits city-heavy drivers.
ADAC Limitations
The WLTP base and European road network mean direct numeric comparisons to EPA figures require conversion. Additionally, ADAC tests relatively few North American-market vehicles promptly, so results for some models arrive months after U.S. launch.
Björn Nyland Limitations
No HVAC is the biggest caveat. In real northern European winters, cabin heating can consume 3–7 kW, a load that does not appear in his standard results. The 56 mph speed also understates the aerodynamic drag experienced at U.S. highway speeds.
Out of Spec Limitations
Cold-weather testing is infrequent and inconsistent across models, so comparison data at low temperatures is sparse. The program also covers fewer vehicles per year than ADAC or Björn Nyland.

Reading the Data: A Practical Example
Take the Tesla Model Y Long Range AWD as a reference point, since it has been tested by virtually every methodology. The EPA rates it at 330 miles. Edmunds' 70-mph constant-speed test returned approximately 280 miles. Björn Nyland's 56-mph no-HVAC test produced around 360 miles. ADAC's cold-weather test at −10°C brought the figure to roughly 200 miles. Out of Spec at 82 mph recorded about 240 miles.
That single vehicle produces a 160-mile spread across legitimate tests — from 200 to 360 miles — depending entirely on the conditions modeled. None of those numbers is wrong. They are each accurate answers to different questions.
For an owner who drives 75 miles of interstate per day in a mid-Atlantic state with typical winters, the Edmunds figure and a mental 10–15% cold-weather deduction is probably the most useful single number. For a Phoenix-based retiree who rarely exceeds 55 mph in mild heat, the EPA figure is a reasonable ceiling. For someone in Minneapolis, ADAC's cold data is the non-negotiable anchor.
Build Your Own Range Estimate
Start with the Edmunds figure as your highway baseline. If your local winters regularly drop below 20°F, apply a 20–30% cold-weather deduction on top. If you carry heavy cargo or drive above 75 mph frequently, add another 5–10% penalty. The resulting range bracket — not a single number — is what you should plan your charging stops around.
Use Owner Communities as a Sanity Check
Model-specific forums and apps like Teslamate, Recurrent, or ABRP aggregate real anonymous owner data across thousands of miles and conditions. Cross-referencing formal third-party tests with crowd-sourced owner data is the closest most buyers will get to a real-world sample from their own climate and driving profile.
The full picture on EV range requires layering multiple data points, not selecting a single authoritative number. And for the many factors that no laboratory captures at all — cargo weight, roof racks, individual driving aggression — why your EV's rated range and real-world range never match covers the full list.
WLTP vs. EPA: A Note for International Buyers
European buyers and Americans cross-shopping imported models encounter the Worldwide Harmonized Light Vehicles Test Procedure (WLTP), which replaced the older NEDC standard in 2017. WLTP is meaningfully more demanding than NEDC — it uses a higher average speed (46 km/h vs. 34 km/h), a longer test duration, and accounts for optional equipment weight — but it is still laboratory-based and still conducted in mild temperatures.
WLTP figures typically come in 10–20% above what Edmunds or Out of Spec will record at real highway speeds. They are consistently more optimistic than real-world data from ADAC's on-road tests. The gap between WLTP ratings and real-world results has been a persistent criticism from European consumer groups, much as the EPA-to-reality gap has been in the United States.
If you are evaluating a vehicle using WLTP numbers and need to mentally convert to real-world U.S. highway expectations, a 25–35% reduction from the WLTP figure is a reasonable rough adjustment for sustained freeway driving. This is not a precise formula — it depends heavily on speed, temperature, and vehicle aerodynamics — but it prevents the sticker shock of discovering the WLTP number behaves like the EPA number's optimistic cousin.
Which Test Should You Actually Trust?
The honest answer is that trust should be conditional on your use case, not allocated to a single source. Here is a practical framework:
- City and suburban drivers in mild climates: The EPA figure is a reasonable upper bound. Real-world results will often approach it because urban speeds favor EV efficiency and regenerative braking helps recoup energy.
- Highway-heavy drivers: Use Edmunds (70 mph) as your baseline and subtract an additional 5–10% if you routinely drive above 75 mph.
- Cold-climate owners (below 20°F regularly): ADAC cold-weather data or Björn Nyland cold-condition addenda are essential inputs. Pair with any available owner community data from forums specific to your model.
- Buyers wanting model-to-model comparisons: Björn Nyland's standardized 90 km/h protocol offers the widest model coverage in a controlled format, even if the absolute number needs adjustment for real conditions.
- Aggressive highway drivers or frequent road-trippers: Out of Spec's 82-mph results reveal the true cost of speed and are the most stress-realistic American test available.
Cross-referencing at least two independent sources — ideally one that matches your climate and one that matches your speed profile — narrows the uncertainty considerably. The goal is not to find the one true number but to bracket your realistic range so that no outcome surprises you.

Understanding range testing context also matters when evaluating an EV's long-term value. How an EV's real range performance holds up over time can affect resale value — something worth checking with valuation tools when you're ready to trade or sell. And as range performance intersects with risk assessment, it's worth noting that insurers are increasingly factoring EV-specific data into premiums — see the EV insurance guide for how coverage decisions are evolving.
All claims are backed by peer-reviewed research. Sources on request.