Key Takeaways
Before signing up for a TOU plan, pull three months of your utility billing data and identify what hour the majority of your energy use falls. Some households are peak-heavy in ways that make TOU plans a net cost increase despite cheap overnight EV charging.
TOU savings are only realized if you genuinely shift consumption to off-peak windows. Fixed loads like refrigerators, water heaters, and always-on devices continue drawing power at whatever rate applies during those hours.
When evaluating a public charging network membership, calculate your break-even in sessions. Divide the monthly membership fee by the per-session discount to find how many charges per month are required to justify the subscription cost.
Most drivers overestimate how often they'll use public charging regularly enough to benefit from a membership fee, especially if they have reliable home charging access.
Set your EV's daily charge limit to 80% for routine driving, and only schedule a full charge the night before a long road trip. This single habit extends battery longevity and keeps your vehicle charging in the most efficient portion of the charge curve.
Lithium-ion cells degrade faster at high states of charge, and charging rates slow significantly above 80% SOC—meaning that last 20% costs more in time and generates more heat than the first 80%.
Why EV Charging Costs Are More Complex Than They Appear
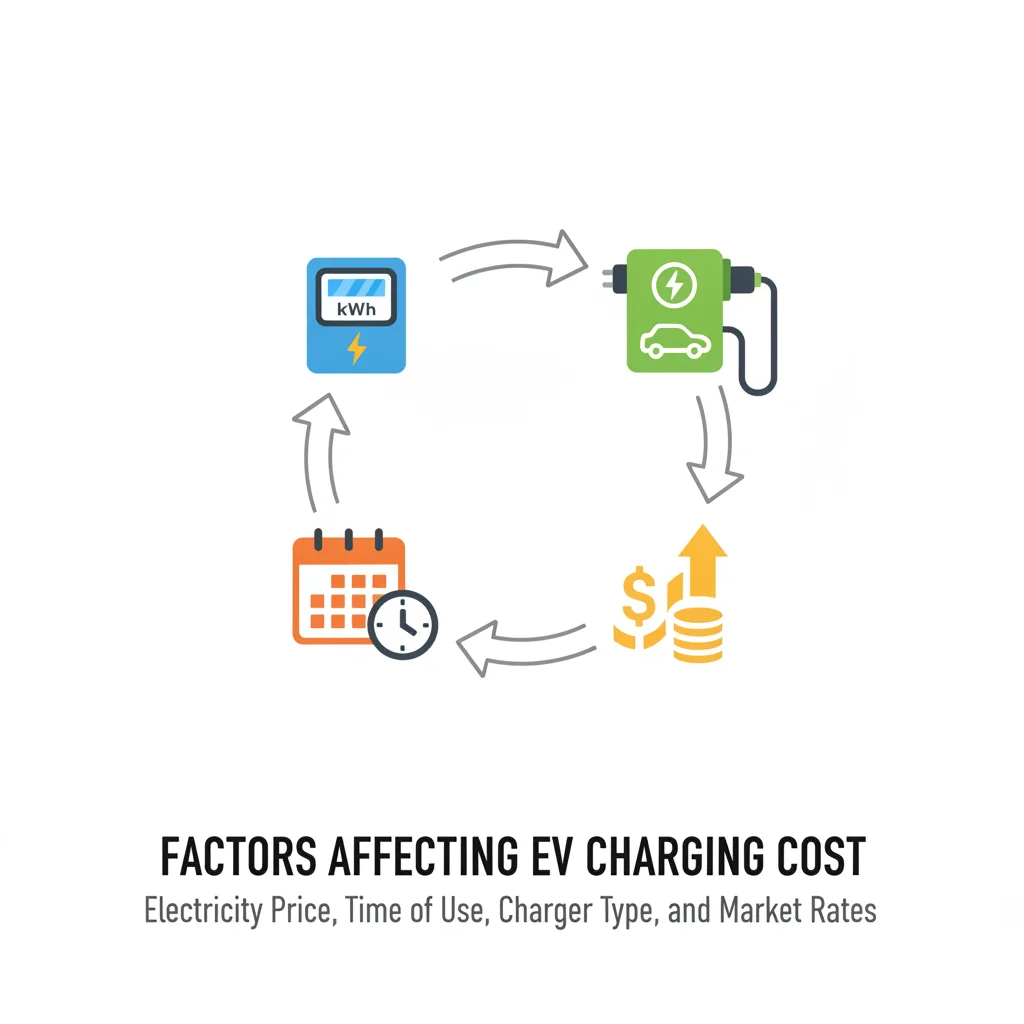
Ask ten EV owners what they pay to charge their car and you'll get ten different answers—and all of them will be correct. That's because EV charging costs aren't a single number. They're the product of at least a half-dozen interacting variables: your electricity rate, your vehicle's efficiency rating, what level of charger you use, how often you rely on public networks, the climate where you live, and even how aggressively you drive.
The promise of cheap EV fueling is real, but it's not automatic. Drivers who understand the inputs can optimize ruthlessly. Those who don't may find their monthly energy savings smaller than expected—or occasionally nonexistent compared to a fuel-efficient gas vehicle.
This guide treats EV charging cost as a financial system rather than a single price tag. We'll break down every factor, quantify where possible, and give you the tools to calculate your own true cost. For a quick-reference breakdown of the core math, see our analysis of what EV charging math actually shows. For a plain-English glossary of the terms used throughout this guide, start with key EV charging cost terms every owner should know.
Your Electricity Rate: The Foundation of Home Charging Costs
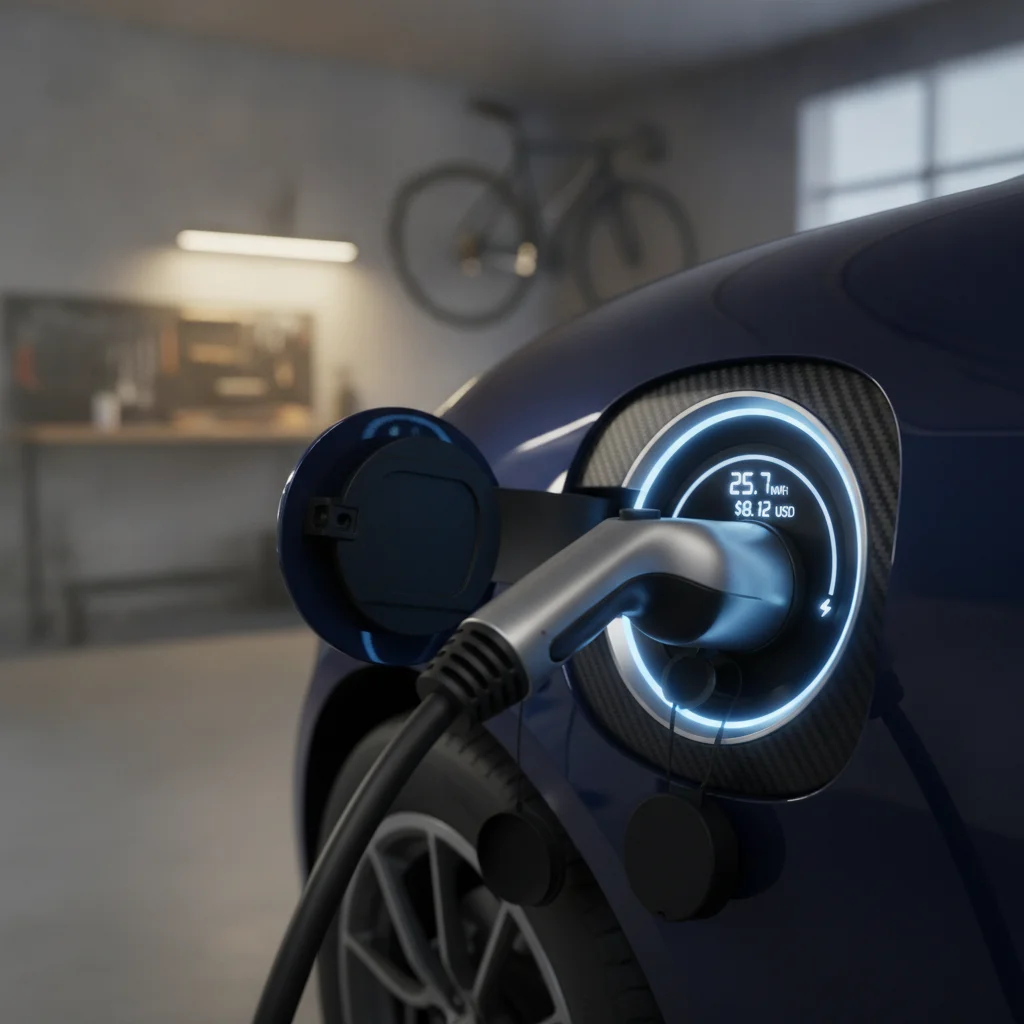
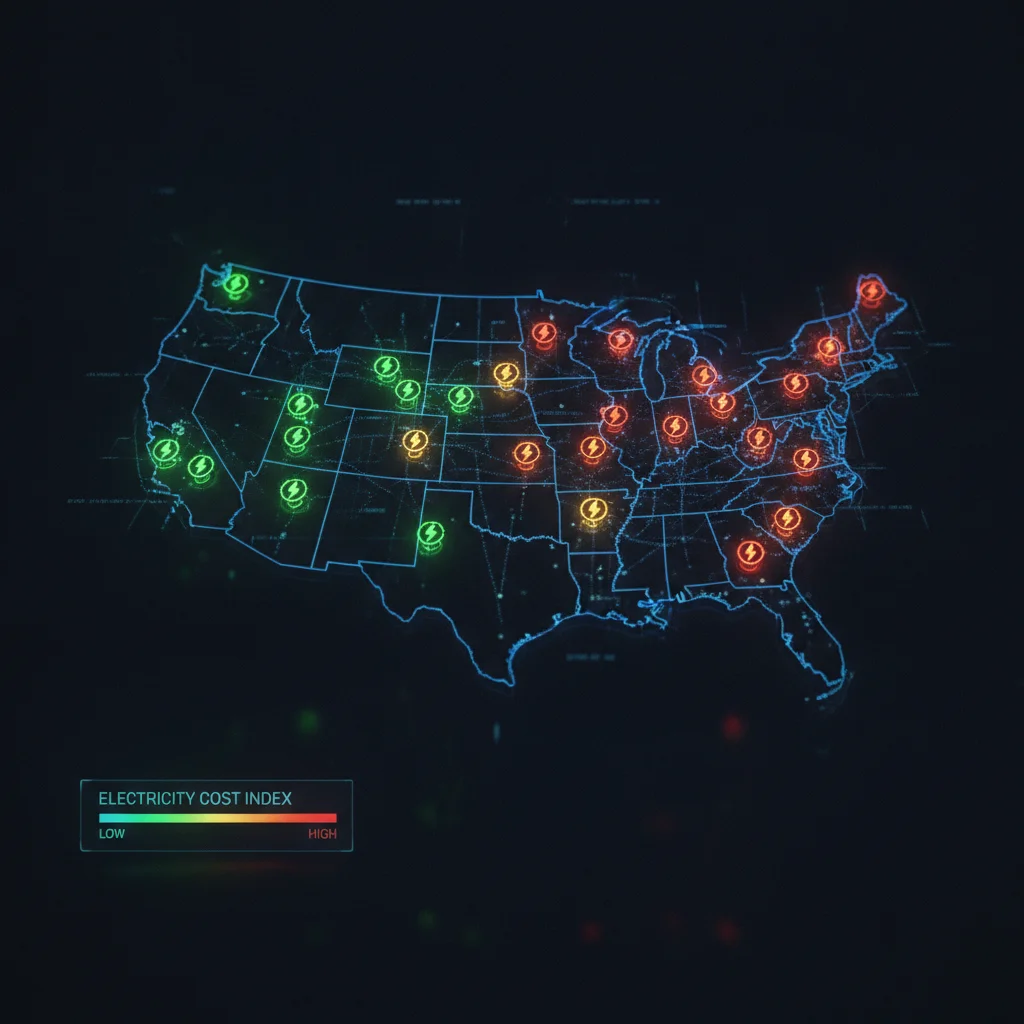
For the roughly 80% of EV charging that happens at home, the electricity rate you pay your utility is the dominant cost factor. The U.S. average residential electricity rate in 2024 hovers around 16–17 cents per kilowatt-hour (kWh), but this figure masks enormous geographic variation. Louisiana residents may pay under 11 cents/kWh while California drivers in certain utility territories pay over 30 cents/kWh.
16.5¢
U.S. average residential electricity rate per kWh
According to the U.S. Energy Information Administration's 2024 residential electricity data, the national average is approximately 16–17 cents per kWh, with wide state-level variation.
80%
Share of EV charging that happens at home
The U.S. Department of Energy's Alternative Fuels Data Center consistently finds that roughly 80% of electric vehicle charging occurs at home overnight.
40%
Potential range reduction in subfreezing temperatures
Real-world testing and DOE data show EV range can drop 20–40% in very cold conditions due to battery thermal effects and cabin heating demands.
2x–4x
Cost premium of public fast charging vs. home charging
Effective per-kWh costs at public DC fast chargers typically run two to four times higher than off-peak home electricity rates, depending on the network and pricing model.
$800–$2,000
Typical Level 2 home charger hardware and installation cost
Industry estimates and installer data from 2023–2024 put the combined hardware and professional installation cost of a residential Level 2 EVSE in the $800–$2,000 range before any incentives.
To see how location shapes your monthly tab, our state-by-state EV charging cost comparison puts the regional spread in concrete dollar terms. At a national average of 16.5 cents/kWh and a vehicle consuming 3.5 miles per kWh, you'd pay roughly $0.047 per mile—about $47 per 1,000 miles driven. But in California at 30 cents/kWh, that same driver pays $0.086 per mile, nearly double.
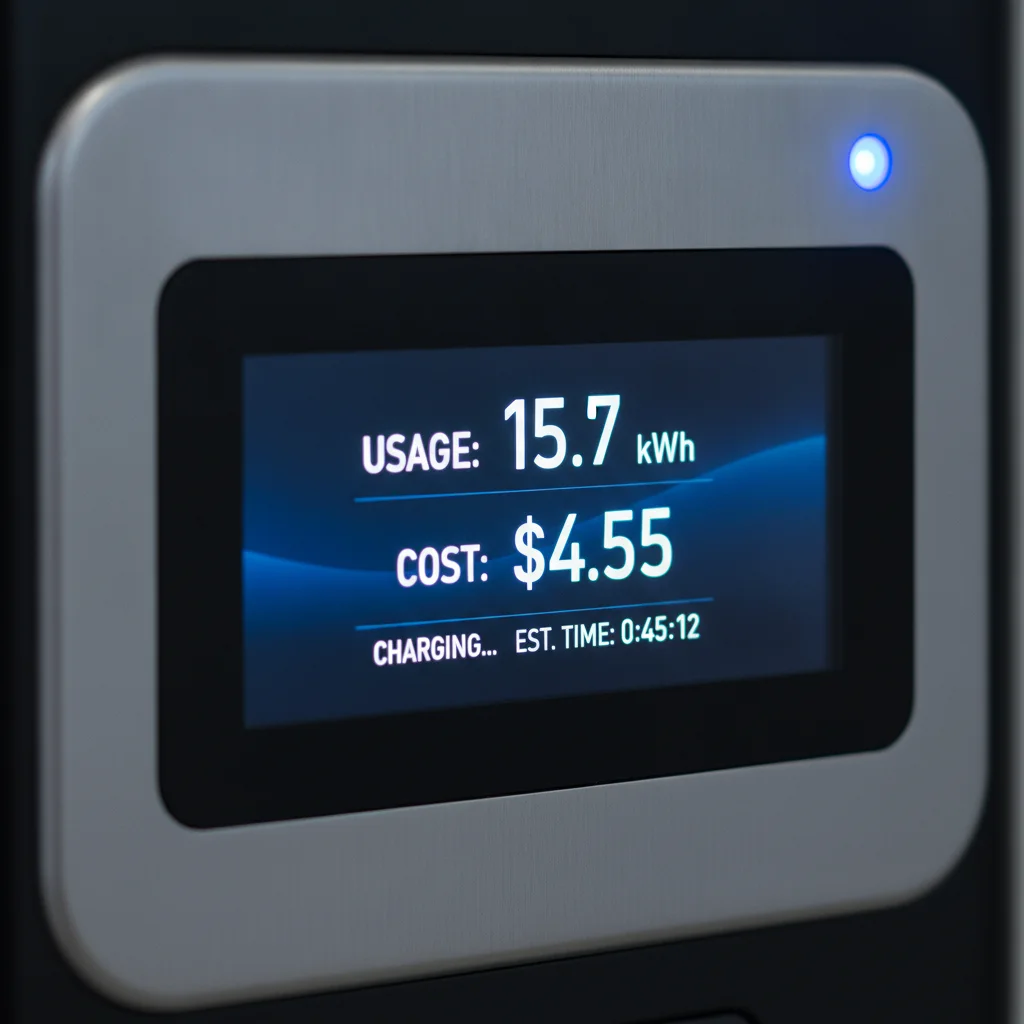
Your electricity bill contains more than just an energy rate, however. Delivery charges, distribution fees, and fixed monthly customer charges all factor into your effective cost per kWh. If you pay $15/month in fixed fees and use 500 kWh, those fees add 3 cents/kWh to your effective rate before you charge a single mile. Our guide to reading your electricity bill as an EV owner walks through every line item that affects what you actually pay.
Before signing up for a TOU plan, pull three months of your utility billing data and identify what hour the majority of your energy use falls. Some households are peak-heavy in ways that make TOU plans a net cost increase despite cheap overnight EV charging.
TOU savings are only realized if you genuinely shift consumption to off-peak windows. Fixed loads like refrigerators, water heaters, and always-on devices continue drawing power at whatever rate applies during those hours.
When evaluating a public charging network membership, calculate your break-even in sessions. Divide the monthly membership fee by the per-session discount to find how many charges per month are required to justify the subscription cost.
Most drivers overestimate how often they'll use public charging regularly enough to benefit from a membership fee, especially if they have reliable home charging access.
Set your EV's daily charge limit to 80% for routine driving, and only schedule a full charge the night before a long road trip. This single habit extends battery longevity and keeps your vehicle charging in the most efficient portion of the charge curve.
Lithium-ion cells degrade faster at high states of charge, and charging rates slow significantly above 80% SOC—meaning that last 20% costs more in time and generates more heat than the first 80%.
Time-of-Use Plans, Demand Charges, and Rate Structures
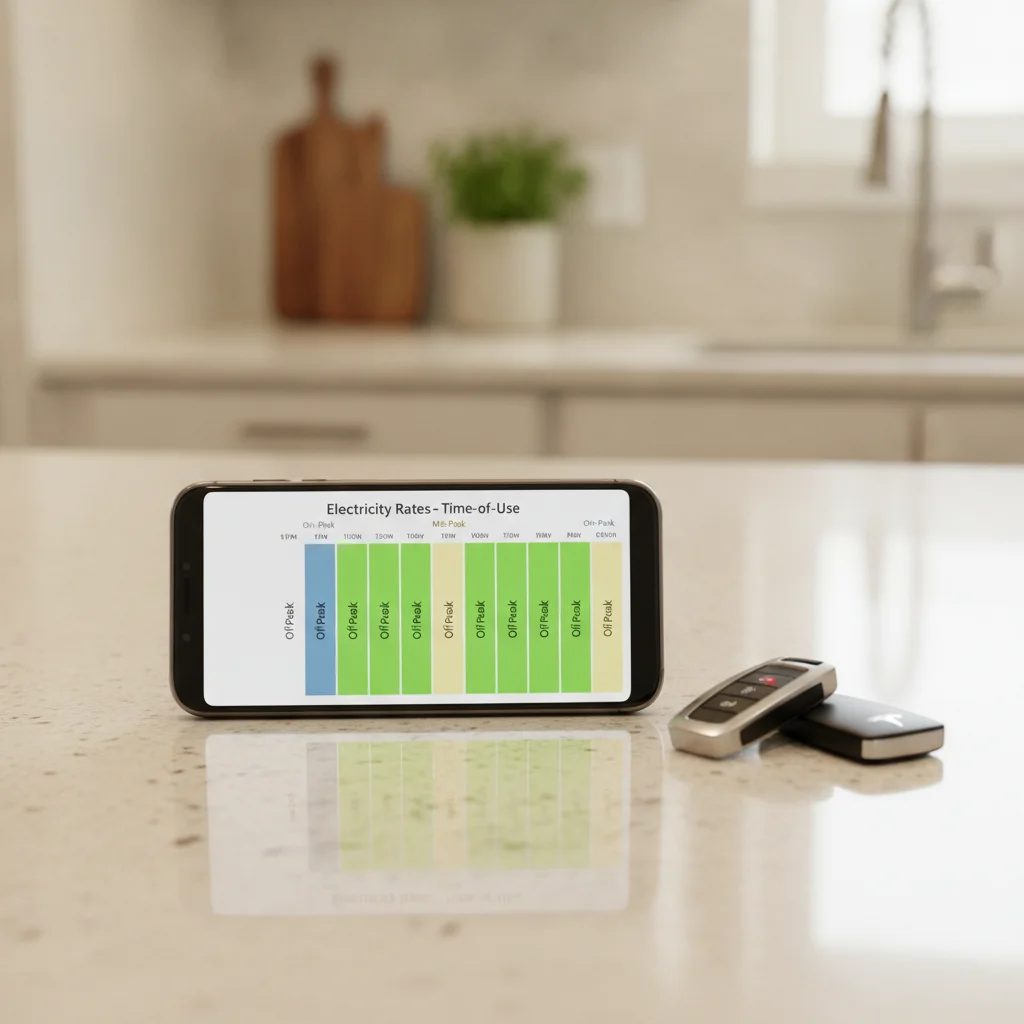
Flat-rate electricity pricing—a single cents-per-kWh charge regardless of when you use power—is the most common residential structure in the U.S., but it's not the cheapest option available to most EV owners. Time-of-use (TOU) rate plans, offered by a growing number of utilities, charge different rates depending on the hour of day and sometimes the season. Off-peak rates—typically midnight to 6 a.m.—can be 40–60% lower than peak-period rates.
For EV owners who can schedule overnight charging, TOU plans represent one of the highest-leverage cost-reduction tools available. Most modern EVs and Level 2 home chargers support scheduled charging, allowing you to program a departure time and let the car or charger decide when to draw power.
Schedule Charging for Off-Peak Hours
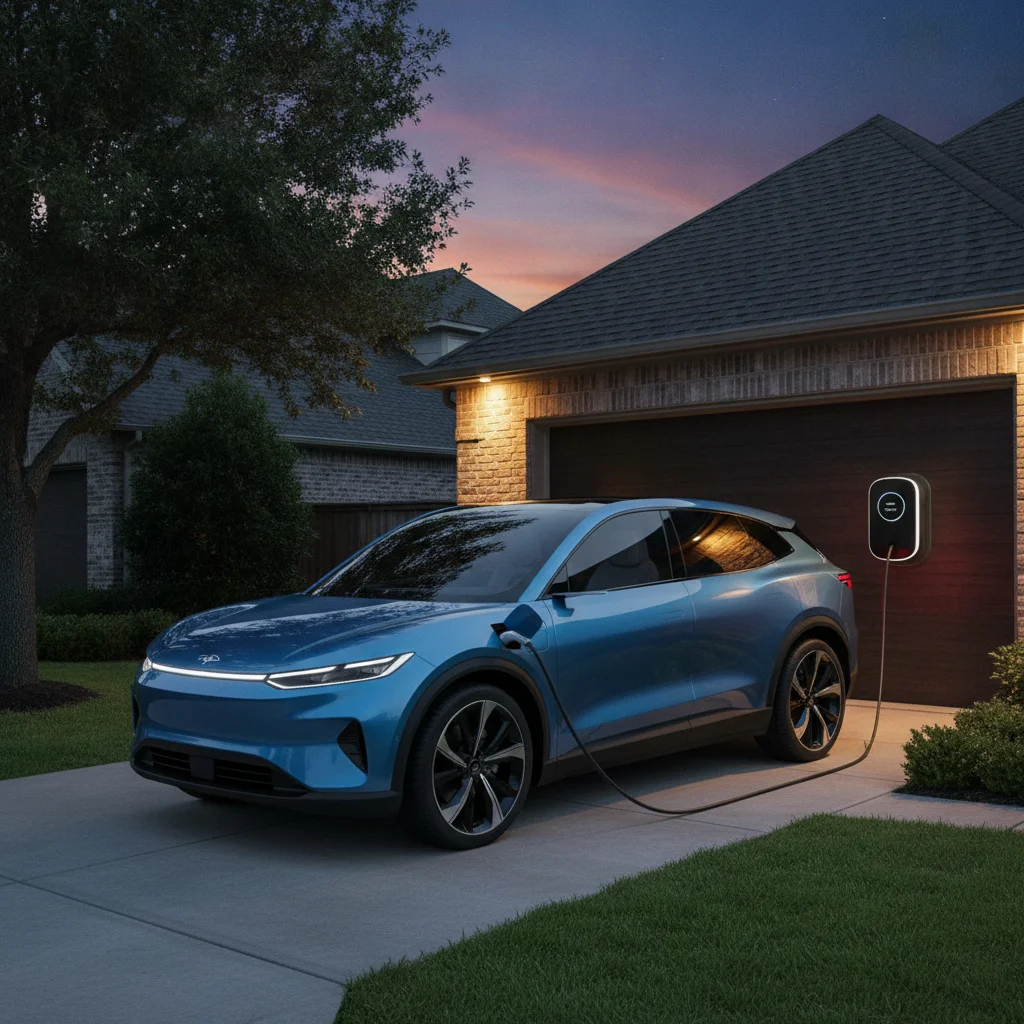
Most EVs and Level 2 home chargers include a scheduling feature. Set your vehicle or charger app to begin charging at midnight or later and finish by 6 a.m. This single change can reduce your electricity cost per charge session by 30–50% on a TOU plan, without any change to your driving habits.
Build Your Personal Charging Cost Estimate
Use your utility's online rate comparison tool—most now offer them—to model what your bill would look like under different rate structures with your actual usage data. Many utilities will even retroactively apply a TOU rate to your last 12 months of usage so you can see the projected savings before you commit.
Demand charges are a separate rate structure primarily applied to commercial accounts, though some utilities have extended them to high-consumption residential customers. A demand charge bills you based on your highest 15- or 30-minute power draw during the billing period, not just total energy consumed. A single DC fast-charging session at home—drawing 50+ kW—could trigger a demand charge that inflates your bill for the entire month. Residential demand charges remain uncommon but are worth verifying with your utility before installing high-power equipment.
EV-specific rate plans are another option some utilities now offer. These plans, such as SDG&E's EV-TOU rate in California or Duke Energy's EV pricing in the Carolinas, are designed around charging behavior and often bundle lower overnight rates with higher peak rates. Understanding which structure best fits your schedule is the core of how electricity rates affect what you pay to charge.
Vehicle Efficiency: How Far Each kWh Actually Takes You
Electricity rates set the price of the fuel; vehicle efficiency determines how much of that fuel you consume. EV efficiency is measured in miles per kWh (or equivalently, kWh per 100 miles). The EPA rates most current EVs between 2.5 and 4.5 miles per kWh under standardized test conditions. The real-world spread is significant and directly affects your per-mile charging cost.
| Vehicle Class | Typical EPA Efficiency | Cost/Mile at $0.165/kWh |
|---|---|---|
| Compact/midsize sedan (e.g., Tesla Model 3 RWD) | ~4.2 mi/kWh | ~$0.039 |
| Midsize SUV (e.g., Ford Mustang Mach-E) | ~3.2 mi/kWh | ~$0.052 |
| Full-size truck (e.g., Ford F-150 Lightning) | ~2.3 mi/kWh | ~$0.072 |
| Performance EV (e.g., Porsche Taycan Turbo) | ~2.5 mi/kWh | ~$0.066 |
The gap between the most and least efficient EVs on the market is large enough to double your effective charging cost. A driver choosing a full-size electric truck over a compact EV sedan will pay roughly 85% more per mile in electricity—before accounting for any rate differences.
Beyond the vehicle's EPA rating, real-world efficiency varies with load, tire pressure, regenerative braking usage, and HVAC operation. Running the cabin heater in an electric vehicle draws from the same battery pack that powers the drivetrain, reducing range and increasing effective cost per mile more than most drivers anticipate.
Cold Weather Inflates Your True Charging Cost
If you live in a northern state and use EPA efficiency figures to estimate winter charging costs, you will significantly underestimate what you'll actually spend. Apply a 20–35% range reduction factor to cold-month calculations. Budget for higher electricity consumption and plan public charging stops more conservatively on winter road trips.
Per-Minute Public Charging Pricing Can Be Deceptive
If a public network charges by the minute rather than by the kWh, your effective cost per unit of energy depends entirely on how fast your vehicle accepts charge. A slower-charging EV at a per-minute rate can pay significantly more per kWh than a faster-charging model at the same station. Always calculate effective cost per kWh when comparing network options.
Charging Level and Hardware Costs
The charger level you use affects both the speed of charging and, in some cases, the cost. There are three standard levels in the U.S.:
- Level 1 (120V, ~1.4 kW): Uses a standard household outlet. Adds roughly 3–5 miles of range per hour. No hardware cost beyond the EVSE (Electric Vehicle Supply Equipment) cord included with most vehicles. Suitable for plug-in hybrids or low-mileage EV drivers.
- Level 2 (240V, 7–19 kW): Requires a dedicated 240V circuit and a wall-mounted or portable EVSE unit. Adds 15–40 miles of range per hour depending on the charger and the vehicle's onboard AC charger capacity. Hardware costs $200–$900; professional installation adds $300–$1,500 depending on panel proximity and local permit fees.
- DC Fast Charging / Level 3 (50–350 kW): Commercial infrastructure only. Adds 100–300 miles of range in 20–40 minutes. Costs significantly more per kWh or per minute than home charging.
The hardware investment for Level 2 home charging is a one-time expense that amortizes quickly. A $1,200 all-in installation cost spread over five years represents $20/month—a modest addition to a charging budget that otherwise runs $40–$80/month for the average driver. Federal tax incentives (the Alternative Fuel Vehicle Refueling Property Credit under IRS Form 8911) may cover 30% of qualified EVSE installation costs up to $1,000 for residential installations, reducing the net outlay further.
Federal Tax Credit for Home Charging Equipment
The Alternative Fuel Vehicle Refueling Property Credit (IRS Form 8911) allows qualifying taxpayers to claim 30% of the cost of purchasing and installing a home EV charger, up to $1,000 for residential installations. This credit applies to equipment placed in service after December 31, 2022, under the Inflation Reduction Act. Consult a tax professional to confirm eligibility, as income limits and property requirements apply.
EV Efficiency Is Reported Two Ways
The EPA expresses EV energy consumption as both miles per kWh and kWh per 100 miles—similar to MPG and gallons per 100 miles for gas vehicles. The kWh/100 miles figure makes cross-vehicle comparisons easier: a vehicle using 25 kWh/100 miles consumes 25% more energy per mile than one using 20 kWh/100 miles. Both figures appear on the Monroney label of new EVs.
One often-overlooked hardware cost factor: onboard charger capacity. The vehicle's built-in AC charger caps how fast it can accept Level 2 power. A vehicle with a 7.2 kW onboard charger won't charge faster even if you install a 19.2 kW EVSE. Match your charger to your vehicle's rated acceptance speed to avoid overspending on hardware that delivers no additional benefit.
Matching Charger Output to Vehicle Capacity Matters
Installing a 48-amp (11.5 kW) Level 2 charger when your vehicle's onboard AC charger maxes out at 7.2 kW wastes hardware dollars without delivering any charging speed benefit. Check your vehicle's maximum AC charging rate before purchasing equipment. Conversely, installing a 24-amp charger on a vehicle capable of 48-amp charging leaves real-world convenience and charging speed on the table.
Routine Public Fast Charging Can Negate Fuel-Cost Savings
Drivers who rely on public DC fast charging for daily or near-daily charging needs should carefully recalculate their fuel-cost advantage over a comparable efficient gas vehicle. At effective public charging rates of $0.45–$0.65/kWh, the per-mile energy cost of an EV can match or exceed that of a 35–40 MPG hybrid. Home charging access is the financial foundation of EV ownership economics.
Public Charging: Network Pricing, Session Fees, and Idle Charges
Public charging networks price electricity in one of three ways: per kWh, per minute, or a flat session fee—and sometimes a hybrid of these. The pricing model matters because it affects both the cost and how you should behave during a session.
Per-kWh pricing is the most transparent: you pay for what you consume, similar to buying gasoline by the gallon. Per-minute pricing, still used by some networks, penalizes vehicles with slower charging speeds because the rate doesn't vary with how fast energy actually flows. A vehicle accepting 50 kW pays the same per-minute rate as one accepting 150 kW, but gets far less energy per dollar spent.
“The economics of EV ownership are fundamentally local. Two identical cars, two identical drivers—if one has a favorable utility rate and home charging access and the other doesn't, their annual fuel costs can differ by thousands of dollars.”
— Jessie Lund, Transportation Electrification Researcher, Rocky Mountain Institute
Membership models add another layer. Electrify America, ChargePoint, EVgo, and Tesla's Supercharger network (now open to non-Tesla EVs under the NACS standard) all offer some form of subscription or membership that reduces per-session costs. Electrify America Pass+, for example, charges a $4/month membership fee but reduces the per-kWh rate substantially for frequent users. Evaluating whether a membership pays off requires estimating your monthly public charging frequency and session size.
For a detailed comparison of how major networks structure their pricing and where they provide coverage, our public charging networks hub is an essential companion resource.
Idle fees—charges applied when a vehicle remains plugged in after reaching full charge—are standard across most public networks and range from $0.40 to $1.00 per minute. These fees exist to encourage throughput but can meaningfully inflate a session cost if you forget to move your car. Session fees, typically $1–$2 flat charges applied regardless of energy consumed, disproportionately penalize short top-up sessions.

The practical takeaway: public DC fast charging rarely costs less than $0.35/kWh in effective terms, and frequently exceeds $0.50/kWh once session fees and inefficient pricing structures are accounted for. At those rates, the per-mile cost of public fast charging approaches or exceeds what many drivers pay for gasoline in a comparable efficient vehicle. Road trips and emergency charges make public charging indispensable, but routine reliance on public networks erodes the fuel-cost advantage of EV ownership.
Driving Habits, Climate, and Real-World Range Loss
Two drivers with identical vehicles and identical electricity rates can have meaningfully different effective charging costs based on how and where they drive. These behavioral and environmental factors don't appear on any spec sheet but can shift real-world costs by 20–40%.
Speed and Driving Style
Aerodynamic drag increases with the square of velocity, meaning energy consumption rises steeply at highway speeds. An EV rated at 3.8 miles/kWh under EPA mixed-cycle testing may achieve only 2.8–3.0 miles/kWh sustained at 75–80 mph. Frequent hard acceleration also bypasses regenerative braking opportunities and increases energy draw from the pack.
Temperature Effects
Cold weather imposes two simultaneous penalties on EVs: cabin heating draws directly from the battery (unlike a gas car, which uses waste engine heat), and lithium-ion cells operate less efficiently at low temperatures, reducing both capacity and charging acceptance speed. The U.S. Department of Energy has documented real-world range reductions of 20–40% in subfreezing conditions. This means that if you're calculating monthly charging costs in Minnesota in January, you should apply a correction factor to your EPA efficiency figure—and budget for correspondingly higher electricity consumption.
Heat has a lesser but still real effect: cabin air conditioning draws 1–3 kW continuously and will reduce range, though less dramatically than heating. Preconditioning—warming or cooling the cabin while the vehicle is still plugged in—offloads this cost to grid electricity rather than battery range, which is why most EV manufacturers and charging experts recommend it as a standard winter and summer practice.
Before signing up for a TOU plan, pull three months of your utility billing data and identify what hour the majority of your energy use falls. Some households are peak-heavy in ways that make TOU plans a net cost increase despite cheap overnight EV charging.
TOU savings are only realized if you genuinely shift consumption to off-peak windows. Fixed loads like refrigerators, water heaters, and always-on devices continue drawing power at whatever rate applies during those hours.
When evaluating a public charging network membership, calculate your break-even in sessions. Divide the monthly membership fee by the per-session discount to find how many charges per month are required to justify the subscription cost.
Most drivers overestimate how often they'll use public charging regularly enough to benefit from a membership fee, especially if they have reliable home charging access.
Set your EV's daily charge limit to 80% for routine driving, and only schedule a full charge the night before a long road trip. This single habit extends battery longevity and keeps your vehicle charging in the most efficient portion of the charge curve.
Lithium-ion cells degrade faster at high states of charge, and charging rates slow significantly above 80% SOC—meaning that last 20% costs more in time and generates more heat than the first 80%.
Battery State of Charge Management
Charging to 100% and depleting to 0% regularly accelerates battery degradation, which gradually reduces effective range and increases your charging frequency over the vehicle's life. Most manufacturers recommend keeping state of charge between 20% and 80% for daily driving. Operating within this window also tends to optimize charging speed, particularly for DC fast charging, where charge rates slow substantially above 80% SOC. This degradation factor doesn't affect today's charging bill but represents a long-term cost worth understanding.

How to Calculate and Minimize Your Total Charging Cost
Pulling all the variables together into a single monthly cost estimate requires a straightforward formula, applied in layers:
- Establish your monthly miles driven. Use your odometer or a 12-month average if available.
- Determine your vehicle's real-world efficiency. Start with the EPA figure and apply corrections for your typical speed, climate, and driving style. A 10–20% reduction from EPA is realistic for most drivers; 30–40% in severe winter conditions.
- Calculate your monthly kWh consumption. Divide monthly miles by your adjusted efficiency figure (miles/kWh).
- Split consumption between home and public charging. Most drivers use public charging for 10–25% of sessions. Apply your home electricity rate to the home portion and your best estimate of public network costs to the remainder.
- Add fixed costs amortized monthly. Hardware installation cost divided by months of expected use. Don't forget applicable subscription fees for public networks.
Example: A driver covering 1,200 miles/month in a midsize EV with a 3.2 mi/kWh real-world efficiency, paying $0.12/kWh off-peak at home, and using public fast charging for 15% of miles at an effective $0.45/kWh:
- Home charging: 1,020 miles ÷ 3.2 mi/kWh × $0.12 = $38.25
- Public charging: 180 miles ÷ 3.2 mi/kWh × $0.45 = $25.31
- Monthly hardware amortization ($1,200 over 60 months): $20.00
- Total estimated monthly cost: ~$83.56, or roughly $0.070/mile
Schedule Charging for Off-Peak Hours
Most EVs and Level 2 home chargers include a scheduling feature. Set your vehicle or charger app to begin charging at midnight or later and finish by 6 a.m. This single change can reduce your electricity cost per charge session by 30–50% on a TOU plan, without any change to your driving habits.
Build Your Personal Charging Cost Estimate
Use your utility's online rate comparison tool—most now offer them—to model what your bill would look like under different rate structures with your actual usage data. Many utilities will even retroactively apply a TOU rate to your last 12 months of usage so you can see the projected savings before you commit.
To minimize total charging cost, the highest-impact actions in priority order are: (1) enroll in a TOU or EV-specific rate plan if your utility offers one and shift charging to off-peak hours; (2) choose a vehicle with strong EPA efficiency relative to your use case; (3) limit public DC fast charging to road trips and emergencies; (4) precondition your vehicle while plugged in during temperature extremes; and (5) maintain tire pressure at the manufacturer's recommended level year-round (underinflation measurably reduces efficiency).
Matching Charger Output to Vehicle Capacity Matters
Installing a 48-amp (11.5 kW) Level 2 charger when your vehicle's onboard AC charger maxes out at 7.2 kW wastes hardware dollars without delivering any charging speed benefit. Check your vehicle's maximum AC charging rate before purchasing equipment. Conversely, installing a 24-amp charger on a vehicle capable of 48-amp charging leaves real-world convenience and charging speed on the table.
Routine Public Fast Charging Can Negate Fuel-Cost Savings
Drivers who rely on public DC fast charging for daily or near-daily charging needs should carefully recalculate their fuel-cost advantage over a comparable efficient gas vehicle. At effective public charging rates of $0.45–$0.65/kWh, the per-mile energy cost of an EV can match or exceed that of a 35–40 MPG hybrid. Home charging access is the financial foundation of EV ownership economics.
EV charging costs also interact with the broader cost of ownership picture. Insurance for electric vehicles tends to carry different premium dynamics than gas cars—our EV insurance guide covers what to expect. And if you're financing a new EV purchase, the monthly loan payment is part of the same budget equation as your charging costs.
U.S. DOE Alternative Fuels Station Locator
The Department of Energy's free tool maps every public EV charging station in the U.S. by level, network, and connector type—essential for planning public charging costs on road trips.
EPA fueleconomy.gov EV Efficiency Ratings
The official EPA source for every EV's rated efficiency in miles per kWh and kWh per 100 miles, with side-by-side comparison tools for evaluating models before purchase.
IRS Form 8911: Alternative Fuel Vehicle Refueling Property Credit
The official IRS form and instructions for claiming the 30% federal tax credit on residential EV charger hardware and installation costs.
PlugShare Community Charging Map
A crowdsourced map of public and shared private charging locations with real-time user check-ins, pricing reports, and reliability ratings—useful for validating network costs before a trip.
EV Charging Cost Calculator (AFDC)
The Alternative Fuels Data Center's online calculator lets you input your vehicle, electricity rate, and mileage to estimate annual home charging costs versus gasoline.
All claims are backed by peer-reviewed research. Sources on request.