| Average First-Year Depreciation | 15%–25% of MSRP (Industry average across mainstream vehicle segments) |
| Average 5-Year Depreciation | 50%–60% of original MSRP (Varies by brand, model, and condition) |
| Average 10-Year Retained Value | 10%–20% of original MSRP (Broad average; trucks and collectibles may retain more) |
| Slowest-Depreciating Segment | Compact pickups and hybrid SUVs (iSeeCars Depreciation Study, 2023) |
| Fastest-Depreciating Segment | Luxury sedans and mass-market EVs (iSeeCars Depreciation Study, 2023) |
| Typical Annual Loss (Years 1–5) | 10%–15% of remaining value per year |
| Typical Annual Loss (Years 5–10) | 5%–10% of remaining value per year |
| Value Floor (Most Vehicles) | $2,000–$6,000 (Dependent on mechanical condition and collector demand) |
Why the Depreciation Curve Matters to Sellers
When you list a used car for sale, you're essentially competing against every other seller in your market who has the same make, model, and year. Buyers come armed with Kelley Blue Book printouts and Edmunds estimates. If your asking price ignores the reality of your car's depreciation curve, you'll sit on the listing for weeks — or worse, take an unexpected hit when negotiating.
Depreciation isn't a mystery. It follows a predictable pattern shaped by age, mileage, market demand, and the reputation of the brand. Once you understand that pattern, you can set a price that's defensible, data-backed, and realistic.
This reference guide walks through what the depreciation curve actually looks like across a vehicle's lifetime — from the first-year cliff to the decade-long plateau — with the numbers you need to anchor your expectations. For a deeper dive into what those year-by-year numbers mean for your cost of ownership, see our year-by-year depreciation breakdown.
| Average First-Year Depreciation | 15%–25% of MSRP (Industry average across mainstream vehicle segments) |
| Average 5-Year Depreciation | 50%–60% of original MSRP (Varies by brand, model, and condition) |
| Average 10-Year Retained Value | 10%–20% of original MSRP (Broad average; trucks and collectibles may retain more) |
| Slowest-Depreciating Segment | Compact pickups and hybrid SUVs (iSeeCars Depreciation Study, 2023) |
| Fastest-Depreciating Segment | Luxury sedans and mass-market EVs (iSeeCars Depreciation Study, 2023) |
| Typical Annual Loss (Years 1–5) | 10%–15% of remaining value per year |
| Typical Annual Loss (Years 5–10) | 5%–10% of remaining value per year |
| Value Floor (Most Vehicles) | $2,000–$6,000 (Dependent on mechanical condition and collector demand) |
The Four Phases of the Depreciation Curve
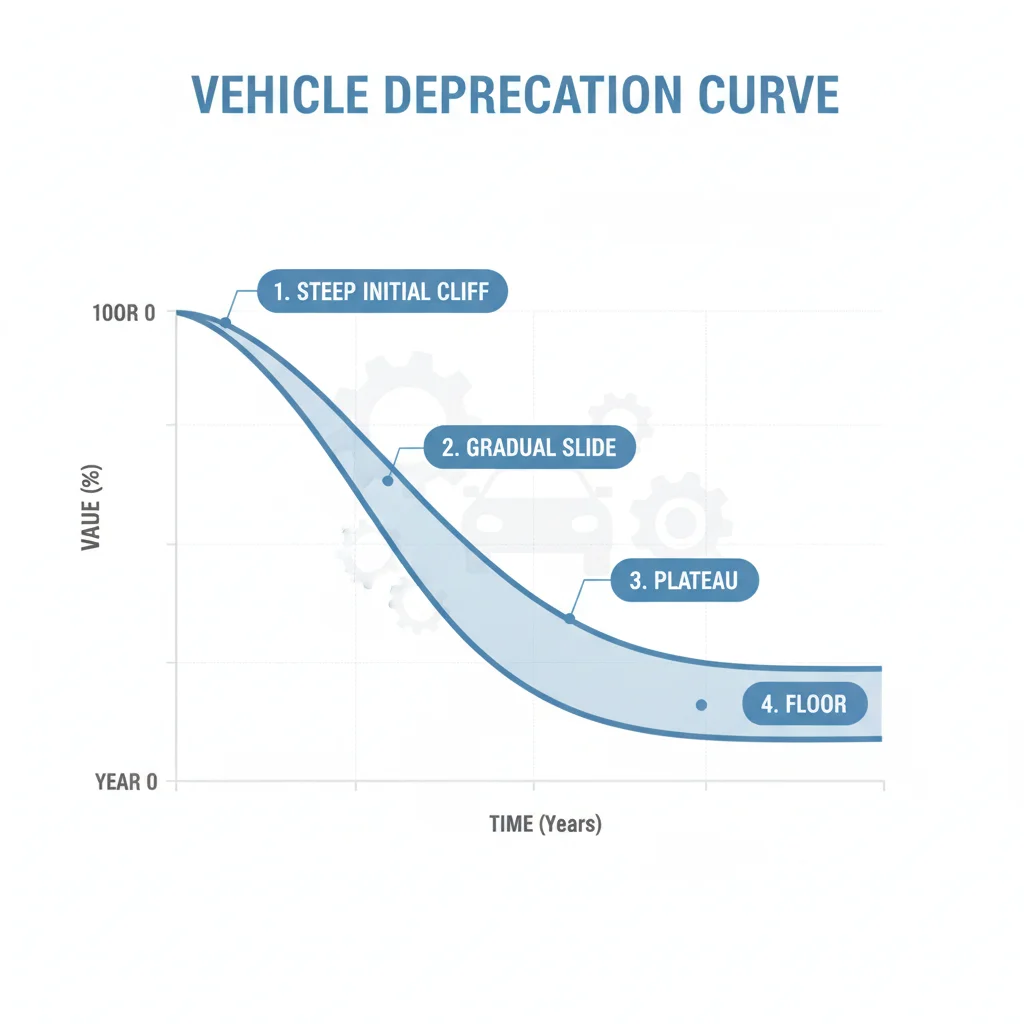
Think of a car's depreciation not as a single steady slope but as a curve with four distinct phases. Each phase has its own rate of loss and its own implications for sellers.
Phase 1: The First-Year Cliff (0–12 Months)
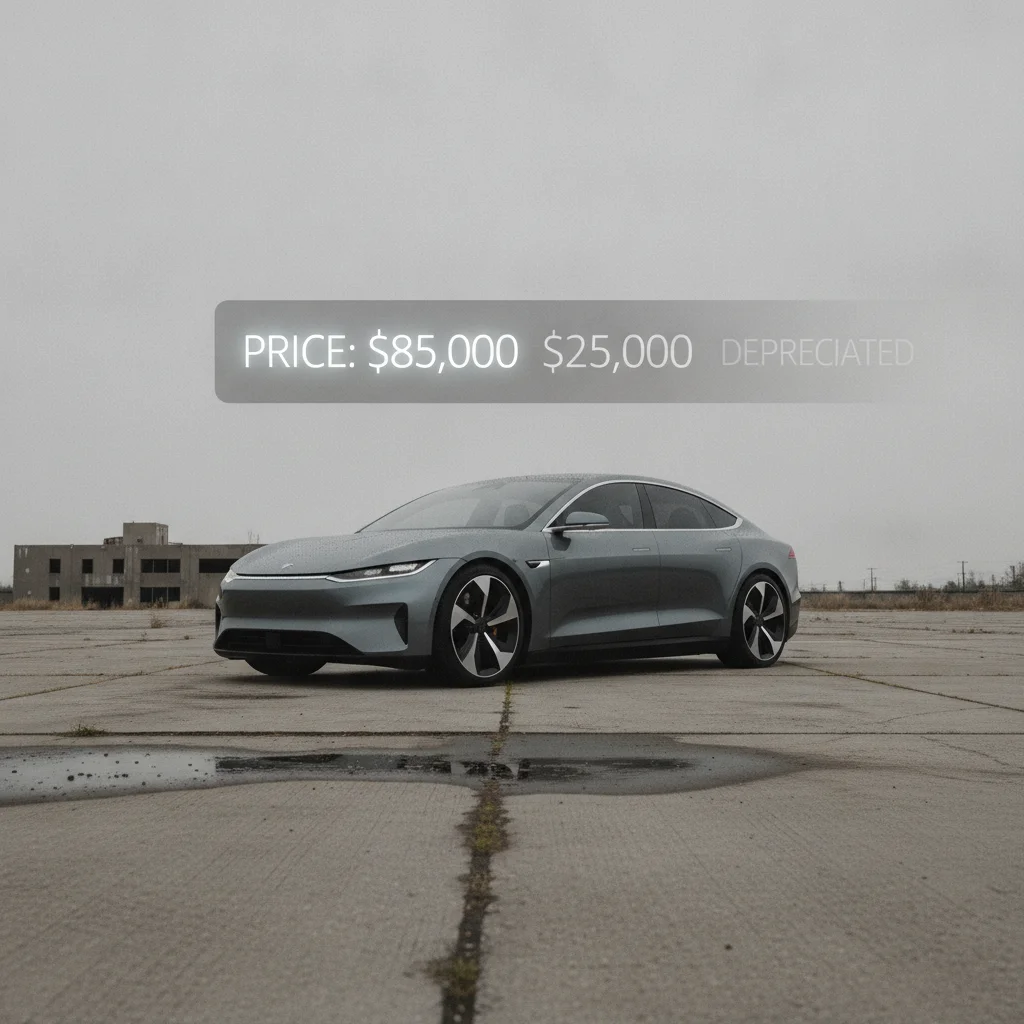
This is the most dramatic drop most car owners ever experience. Drive a brand-new vehicle off the lot and it immediately loses its "new" premium. The moment it becomes a used car — even with zero miles beyond the dealership drive — it's worth less than what you paid. Industry averages put the first-year loss at roughly 15% to 25% of the purchase price. On a $40,000 new vehicle, that's $6,000 to $10,000 gone in twelve months.
Why so steep? Several forces converge at once. First, buyers can still purchase the same model new from a dealer, so your used car needs to be discounted enough to compete. Second, any manufacturer incentives or dealer cash that existed when you bought it may still be available, undercutting your private-sale price. Third, the psychological premium of being the first owner evaporates the second you drive away.
Phase 2: The Steep Slide (Years 1–5)
After the first-year cliff, the curve stays steep but becomes more gradual. Years two through five typically see losses of 10% to 15% per year on the remaining value. By the end of year five, the average car has lost somewhere between 50% and 60% of its original MSRP.
This phase is critical for sellers because it's where the bulk of total depreciation occurs. A car that cost $40,000 new is likely worth $16,000 to $20,000 after five years. The exact number depends heavily on brand, segment, and condition — factors covered in our companion piece on why not all cars depreciate at the same rate.
20%
Average value lost in year one alone
Industry data consistently shows new vehicles lose roughly one-fifth of their purchase price in the first twelve months.
57%
Average depreciation after five years
According to iSeeCars analysis of millions of used car transactions, the typical vehicle retains just 43 cents on the dollar after five years.
65%+
Five-year retained value for top-performing trucks
Vehicles like the Toyota Tacoma consistently outperform the average depreciation curve, per Kelley Blue Book and Edmunds data.
$8,000
Avg. dollar loss in years 1–3 on a $40K vehicle
Represents a rough annual average across the steepest portion of the depreciation curve for a mainstream vehicle.
Phase 3: The Gradual Plateau (Years 5–10)
Something interesting happens around year five or six: the rate of depreciation slows meaningfully. The car has already shed most of its "new" premium, and what's left is closer to pure utility value. Annual losses in this phase typically run 5% to 10% of remaining value — smaller in absolute dollar terms even if the percentage doesn't look dramatically different.
By year ten, the average car retains about 10% to 20% of its original MSRP. At that level, the annual dollar loss is modest — a $40,000 car worth $5,000 at year ten might only lose a few hundred dollars a year going forward.
Phase 4: The Floor (Year 10 and Beyond)
Most vehicles reach a value floor somewhere between $2,000 and $6,000, depending on condition and demand. At this point, depreciation has largely run its course. The car's value is driven less by age and more by mechanical condition, mileage, and whether there's a collector or enthusiast market for the model. Some vehicles — particularly well-maintained trucks, SUVs, and certain sports cars — actually hold or gain value after this floor is reached.
Year-by-Year Depreciation at a Glance
The table below shows the typical depreciation trajectory for an average vehicle purchased new at $40,000. These figures represent broad industry averages and will vary based on brand, model, and market conditions.
| Year | Approx. Retained Value (%) | Approx. Market Value ($40K MSRP) | Annual Loss (Approx.) |
|---|---|---|---|
| New (Day 1) | 100% | $40,000 | — |
| Year 1 | 75–85% | $30,000–$34,000 | $6,000–$10,000 |
| Year 2 | 65–75% | $26,000–$30,000 | $3,000–$5,000 |
| Year 3 | 55–65% | $22,000–$26,000 | $2,500–$4,500 |
| Year 5 | 40–55% | $16,000–$22,000 | $2,000–$3,500 |
| Year 7 | 30–40% | $12,000–$16,000 | $1,500–$2,500 |
| Year 10 | 10–20% | $4,000–$8,000 | $800–$1,500 |
Use this table as a starting benchmark. For the actual market value of your specific vehicle right now, pair this data with real-time tools covered in our valuation tools guide.
These Figures Are Averages — Yours May Differ
The percentages in this table represent industry-wide averages based on millions of transaction data points. Your specific vehicle's depreciation will depend on its brand reputation, mileage relative to the annual average, regional market demand, and condition. Always cross-reference these benchmarks with a real-time valuation from Kelley Blue Book, Edmunds, or a similar tool before finalizing your asking price.
Dealer Trade-In vs. Private Sale Values
Dealer trade-in offers typically land 10%–20% below private-party market value because the dealer needs room to recondition and resell the vehicle at a profit. When comparing your car's position on the depreciation curve, make sure you're using the private-party value estimate, not the trade-in estimate, as your reference point for setting a private sale price.
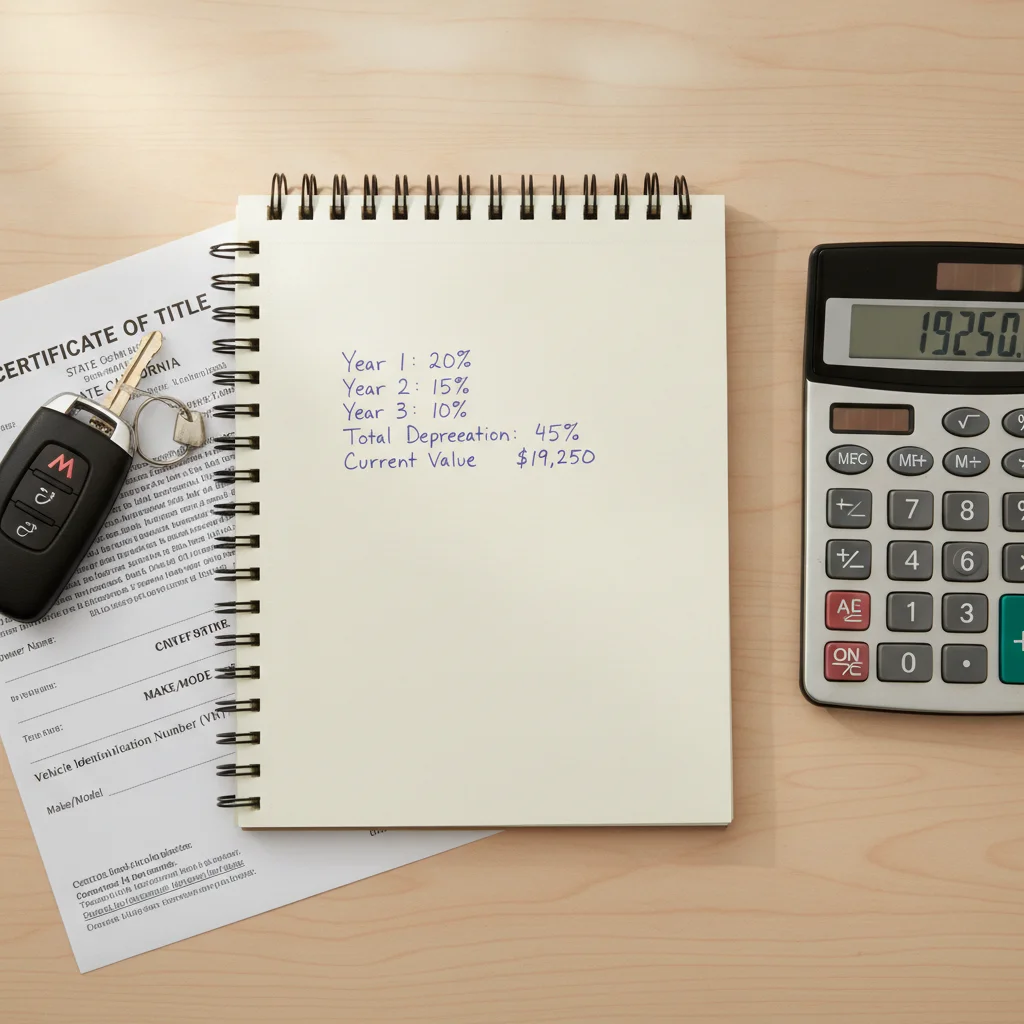
To understand how to calculate your car's exact depreciation using its original purchase price and current estimated value, see our practical depreciation walkthrough.
Key Factors That Shift the Curve
The curve described above is the average. Your specific vehicle will land somewhere different based on several variables that pull the curve steeper or flatter.
Brand and Model Reputation
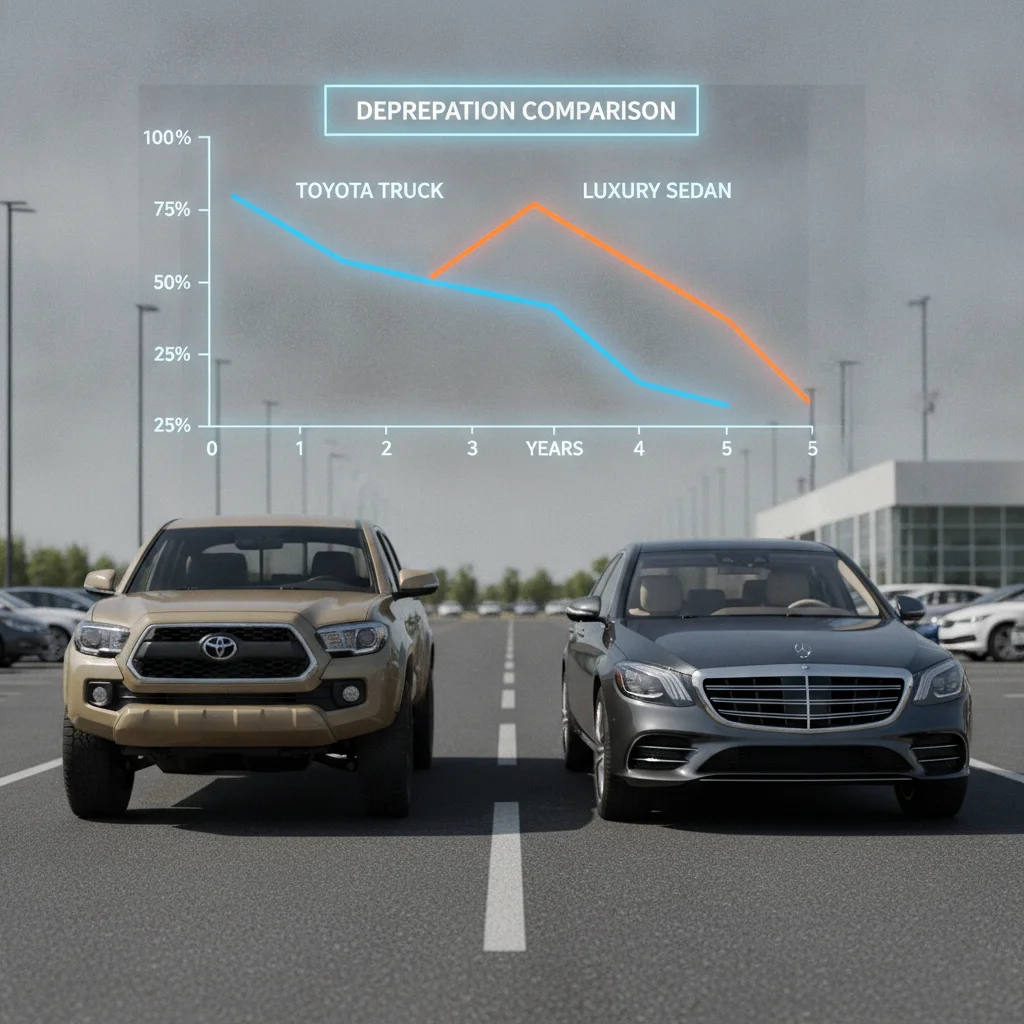
Vehicles with strong reliability reputations — Toyota, Honda, Subaru — consistently depreciate slower than average. A Toyota Tacoma can retain 65% or more of its MSRP after five years, while a comparable domestic pickup might retain 45–50%. On the other end, luxury brands often depreciate faster because the replacement cost for a new version remains accessible, keeping pressure on used prices.
Mileage
The industry benchmark is roughly 12,000–15,000 miles per year. Every mile above that average accelerates your position down the depreciation curve. A car at 90,000 miles in year five will be valued closer to where an average car sits at year six or seven. Conversely, a low-mileage vehicle can command a premium that pushes its value above the average curve for its age.
Condition and Maintenance Records
Buyers pay more for confidence. A clean vehicle history report and documented service records are worth real money — often $500 to $2,000 above a comparable car without that paper trail. Cosmetic damage, particularly if unrepaired, can knock a vehicle below the average curve even when mechanically sound.
Market Timing and Fuel Prices
Segment demand shifts with fuel prices and economic conditions. When gas prices spike, large SUVs and trucks depreciate faster while hybrids and compact cars hold value better. When fuel is cheap, trucks and SUVs often outperform the average curve. Sellers who track these macro trends can time their listings accordingly.
Depreciation
The loss in a vehicle's monetary value over time due to age, mileage, wear, and market conditions. It's the single largest cost of car ownership for most buyers.
Depreciation Curve
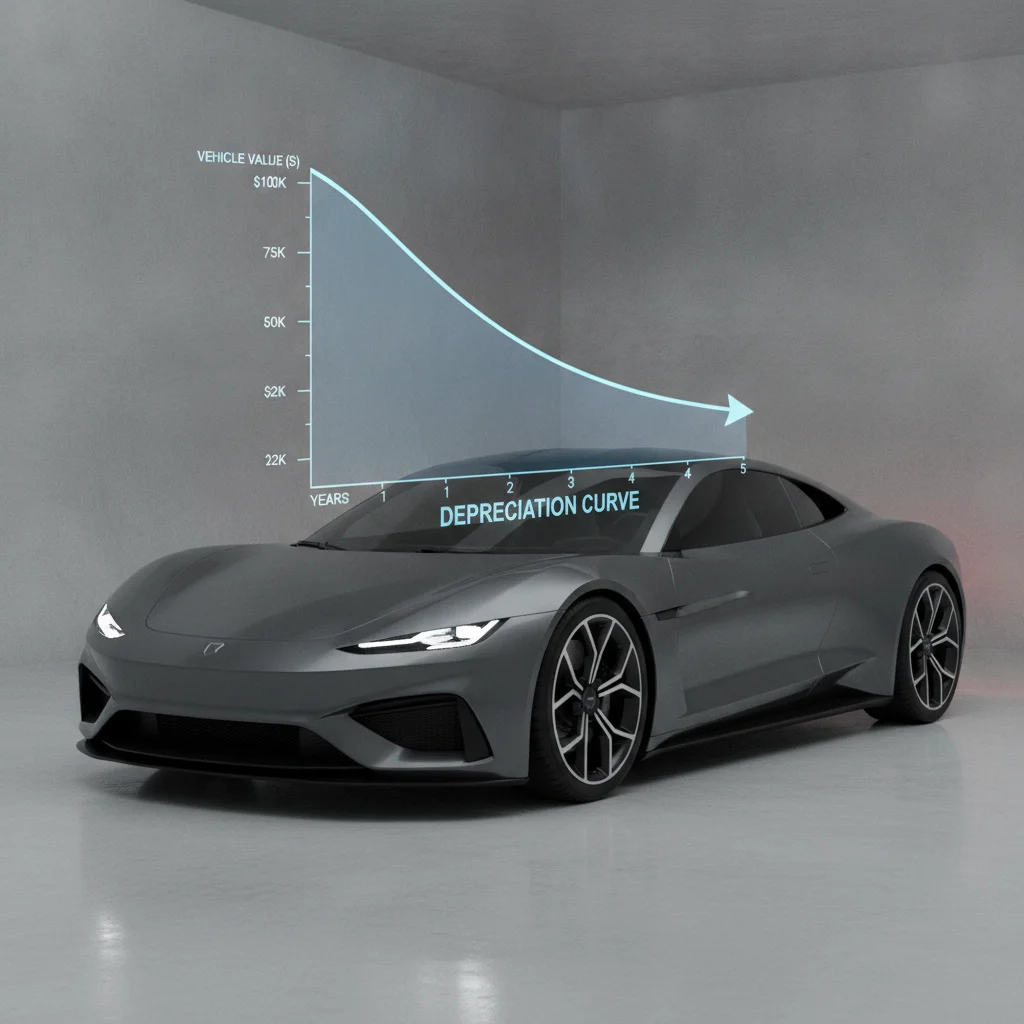
The graphical representation of how a car's value declines over its lifetime. It typically shows a steep initial drop that gradually flattens into a slow, steady decline.
Retained Value
The percentage of a vehicle's original MSRP that it still holds at a given point in time. A car with 60% retained value after three years is worth 60% of what it cost new.
Value Floor
The approximate minimum market value a vehicle reaches once depreciation has largely run its course. At this point, age matters less than mechanical condition and demand.
MSRP
Manufacturer's Suggested Retail Price — the sticker price on a new car before any dealer discounts, incentives, or negotiations. Used as the baseline for calculating depreciation percentages.
Private-Party Value
The estimated market value of a used vehicle when sold directly from one individual to another, as opposed to a dealer trade-in or auction. Typically higher than trade-in value and the most relevant figure for private sellers.
Practical Takeaways for Sellers
Understanding the shape of the depreciation curve gives you three concrete advantages when you're ready to sell.
Price from Data, Not Emotion
It's natural to remember what you paid for your car and anchor your asking price to that number. But buyers don't care what you paid — they care what the market says the car is worth today. Use the phase benchmarks above alongside a current Kelley Blue Book or Edmunds private-party estimate to set a defensible asking price. Our article on car depreciation from day one to year ten provides additional data benchmarks to cross-reference your own estimate.
Time Your Sale Around Phase Transitions
Selling just before a major phase transition can preserve thousands of dollars. If your car is approaching the end of year one, selling before the twelve-month mark — even as a very-low-mileage used vehicle — can sometimes capture more of the "like new" premium. Similarly, selling in years three to four, before the cumulative mid-curve losses compound further, often yields a better return than waiting until year five or six.
Know Where You Are on the Curve
A seller with a ten-year-old car who prices it as though it retained 40% of MSRP will be ignored. A seller with a two-year-old car in pristine condition with low miles who prices it at the low end of the curve will leave money on the table. Knowing your phase — and where your specific vehicle sits within that phase based on mileage and condition — lets you price with precision rather than guesswork.
For a fuller picture of how the first five years specifically affect your finances as both a buyer and a seller, see our guide to the first five years of depreciation costs.
Kelley Blue Book (KBB)
Enter your car's details to get a real-time private-party value estimate. Use it alongside the depreciation benchmarks in this guide to set a data-backed asking price.
Edmunds True Market Value
Edmunds aggregates actual transaction data to show what buyers in your local market are really paying for vehicles like yours — a useful cross-check against KBB estimates.
iSeeCars Depreciation Report
An annual analysis of depreciation rates by make, model, and segment based on millions of used car transactions. Useful for identifying how your vehicle compares to segment averages.
Depreciation Basics Hub
Our full resource center on how vehicles lose value over time — covering depreciation mechanics, year-by-year benchmarks, and what the numbers mean for buyers and sellers alike.

All claims are backed by peer-reviewed research. Sources on request.