Key Takeaways
How the EPA Actually Tests Fuel Economy
Before you can use EPA ratings intelligently, you need to know where they come from. The process is more controlled — and more artificial — than most buyers realize.
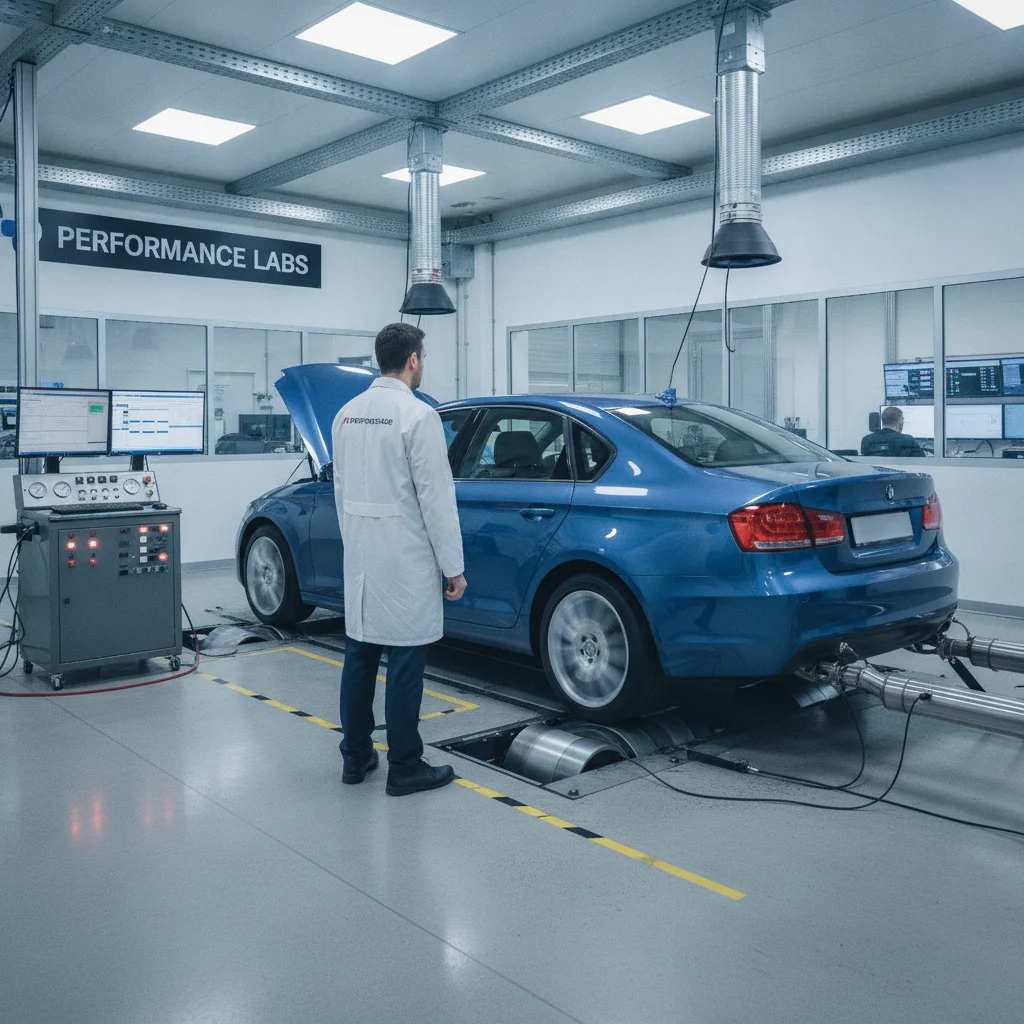
Manufacturers conduct fuel economy testing on a dynamometer, essentially a treadmill for cars. The vehicle sits stationary while rollers simulate road resistance. A lab technician follows a prescribed speed trace — a scripted sequence of accelerations, cruises, and decelerations — while exhaust emissions are measured. The EPA then uses carbon content in the exhaust to calculate how much fuel was consumed.
There are five separate test cycles used to generate the numbers on your window sticker:
- City cycle (FTP-75): Simulates urban stop-and-go driving, averaging about 21 mph with frequent stops. Duration: roughly 31 minutes.
- Highway cycle (HWFET): Simulates a smooth freeway run, averaging 48 mph with a top speed of 60 mph. No stops.
- High-speed cycle (US06): More aggressive driving up to 80 mph. Added in 2008 to address the old test's underestimation of highway fuel use.
- Air conditioning cycle (SC03): Tests efficiency with A/C running at 95°F.
- Cold temperature cycle (Cold FTP): Repeats the city test at 20°F to capture cold-start penalties.
The city and highway numbers on the sticker are weighted blends of these five cycles. The combined rating is a further blend: 55% city, 45% highway.
Critically, the EPA does not test every vehicle itself. Manufacturers run their own tests and submit results. The EPA audits roughly 15–20% of models each year. This system works reasonably well — manufacturers face stiff penalties for false submissions — but it means the numbers reflect the manufacturer's best execution of a standardized script, not your actual commute.
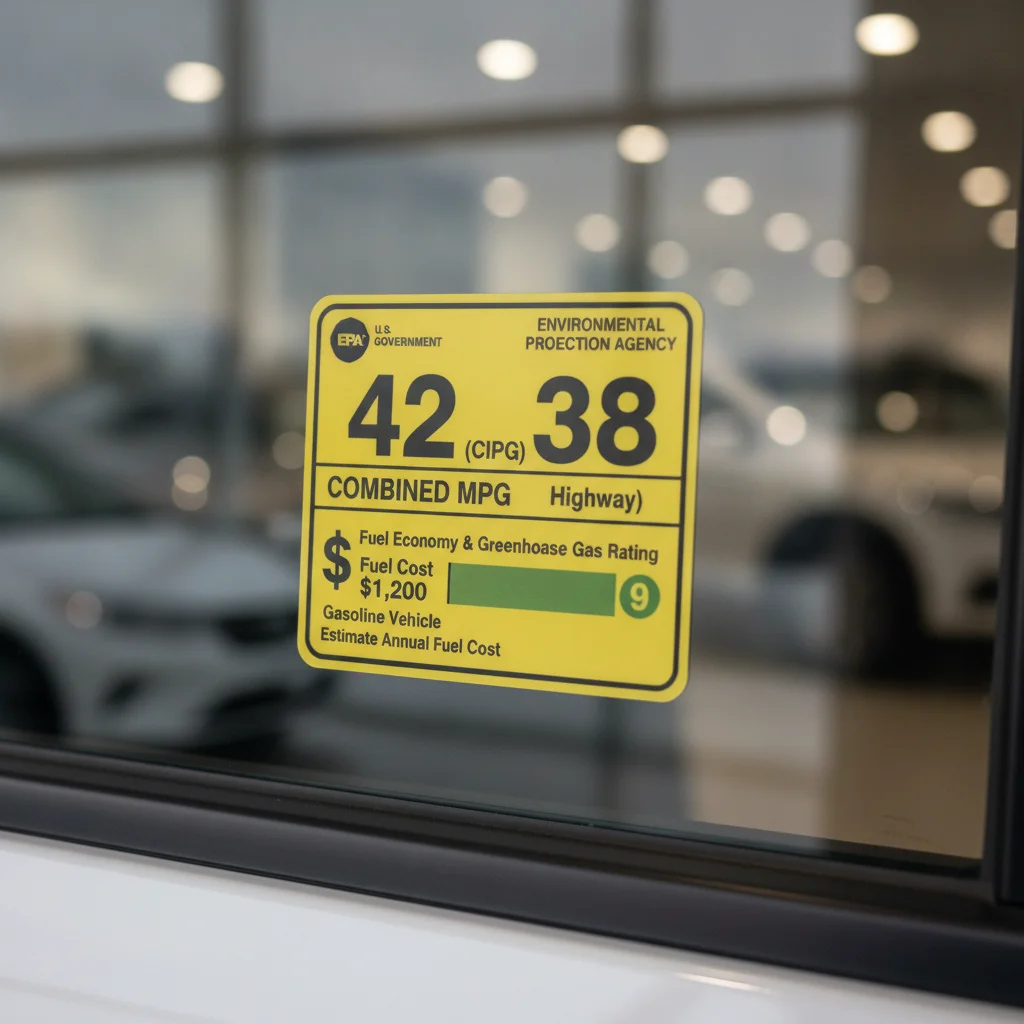
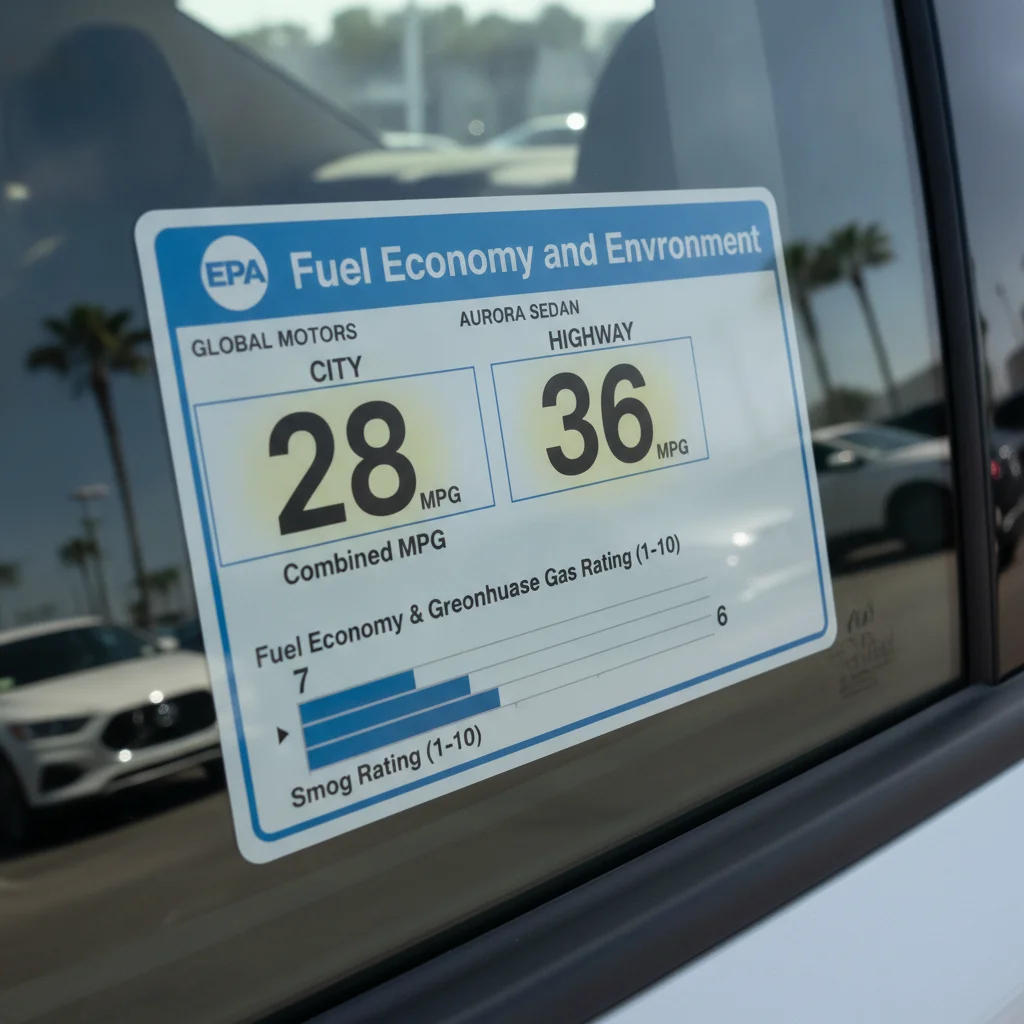
The window sticker carries more information than most buyers notice, including five-year fuel cost estimates and a comparison range for similar vehicles. Worth a close read before you sign anything.
Common Myths About EPA Ratings — Debunked
The misunderstandings around fuel economy ratings are consistent across car buyers at every experience level. Some myths favor the EPA process; others dismiss it entirely. Both extremes cost you money.
Myth
The EPA number on the window sticker is what I should expect to get in normal driving.
Fact
EPA estimates are a standardized lab benchmark, not a real-world prediction. Most drivers see 10–20% lower MPG in everyday use.
The EPA test cycles average around 21 mph for city and 48 mph for highway — speeds and conditions that don't reflect most people's actual commutes. There are no traffic lights in the highway test. The city test doesn't capture the efficiency penalty of very short trips where the engine never reaches operating temperature. The air conditioning test is run separately and only partially weighted into the final number.
Fueleconomy.gov's user-submitted data consistently shows real-world MPG trailing EPA estimates. For a vehicle rated 30 combined, 25–27 MPG in actual use is typical. For trucks and SUVs with larger gaps between city and highway ratings, the combined figure can be even more misleading if your driving skews heavily toward one or the other.
Use the EPA number as a comparison tool, not a fuel cost forecast. Then apply a 10–15% haircut to the combined figure for your personal driving estimate.
Myth
Highway MPG is always the most relevant number for long-distance or commute driving.
Fact
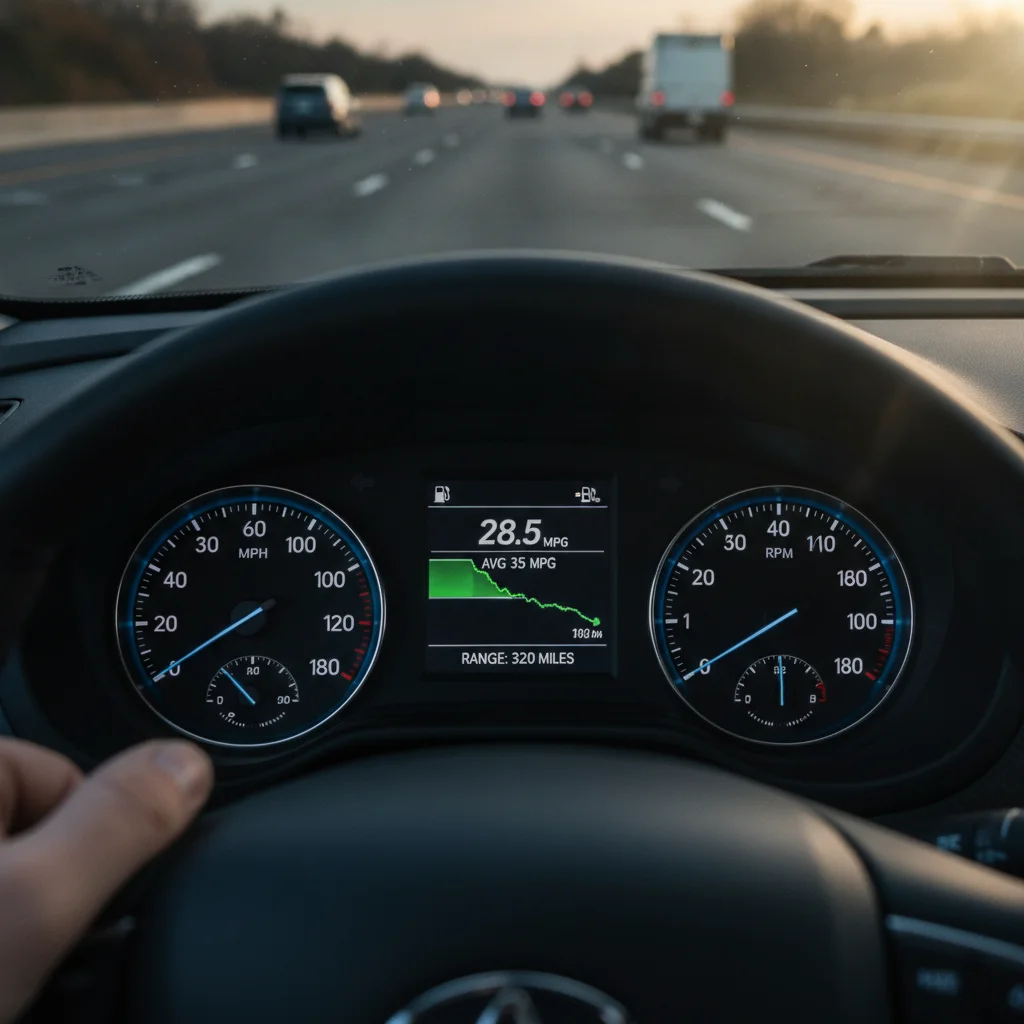
The EPA highway test averages 48 mph with a 60 mph ceiling — if you drive at 70–80 mph, your actual highway MPG will be noticeably lower than the sticker rating.
Aerodynamic drag — the force your engine must overcome to push the car through air — scales with the square of speed. Increasing from 60 to 75 mph doesn't add 25% more drag; it adds roughly 56% more drag. Your engine works proportionally harder, burning more fuel per mile.
The EPA introduced the US06 high-speed test cycle in 2008 specifically because earlier highway testing was too slow to reflect real driving. But even with the update, the weighted result still assumes a gentler cruise than most interstate drivers actually maintain.
If your commute involves sustained 75+ mph cruising, expect to lose 3–7 MPG versus the highway sticker. A vehicle rated 38 highway might deliver 32–34 MPG at your typical pace. Factor that into any fuel cost comparison you run between vehicles.
Myth
All vehicles of the same model get the same fuel economy, regardless of options or trim.
Fact
Trim level, drivetrain, wheel size, and optional packages can produce meaningfully different MPG figures for what looks like the same vehicle.
This trips up buyers constantly. A midsize SUV might be rated 26 combined in front-wheel-drive trim and 24 combined with all-wheel drive — a difference that costs roughly $130–$175 per year at 15,000 miles and $3.50 per gallon. Add larger wheels and tires, and you add rolling resistance. Add a towing package, and you've likely changed the axle ratio, which affects highway cruising efficiency.
Turbocharged engines add another layer of complexity. A 2.0T that delivers excellent EPA numbers under light-load test conditions can see significantly higher fuel consumption under real-world load — highway passing, carrying passengers, towing light loads. Engine displacement and technology interact with real-world driving conditions in ways the EPA test doesn't fully capture.
Always pull the EPA rating for the exact trim, drivetrain, and engine configuration you're purchasing — not the base model used in ads.
Myth
A car rated at 40 MPG will always be cheaper to fuel than one rated at 30 MPG.
Fact
Fuel type, engine octane requirements, and real-world driving gaps can close the cost difference significantly — and sometimes reverse it.
Imagine comparing a 40 MPG vehicle that requires premium fuel versus a 30 MPG vehicle that runs on regular. At current average prices — say $3.20 for regular and $3.70 for premium — the math shifts considerably. At 15,000 annual miles:
- 40 MPG premium car: 375 gallons × $3.70 = $1,387/year
- 30 MPG regular car: 500 gallons × $3.20 = $1,600/year
That's still a meaningful gap — but if real-world MPG on the premium car drops to 34 (15% below sticker) while the regular car holds 27, the numbers get much closer: $1,632 versus $1,778. Under some regional fuel pricing scenarios, the advantage nearly disappears.
Ethanol content further complicates comparisons. Higher ethanol blends reduce energy content per gallon, which means the MPG you'll see at a regional pump selling E15 will trail what you'd get from a station selling standard E10.
Run the full fuel cost calculation — adjusted MPG, fuel grade, local prices — before declaring a winner on efficiency.
Myth
New fuel economy improvements from the manufacturer will automatically show up as better real-world MPG.
Fact
Manufacturer efficiency improvements often optimize for test-cycle performance; real-world gains can be smaller than the year-over-year EPA improvement suggests.
Automakers are sophisticated at designing powertrains that perform well on the specific EPA drive cycles. Cylinder deactivation systems, for example, might seamlessly drop from eight cylinders to four during the steady-state portions of the highway test — reducing recorded fuel consumption — but reactivate frequently in real-world driving with load variations.
Start-stop systems (engine-off at traffic lights) earn significant credits in city testing because the city cycle includes many stops. In real urban traffic with irregular light timing and AC demands, the fuel savings are real but smaller than the test implies.
This doesn't mean new efficiency technologies aren't valuable — they are. But a 2 MPG improvement in the EPA rating might translate to a 1 MPG improvement in your driveway. Verify real-world data from owner forums and sites like fueleconomy.gov before assuming you'll capture the full advertised gain.
Myth
The combined MPG rating is the most useful single number for comparing vehicles.
Fact
The most useful number depends on your actual driving split — combined is a reasonable default, but heavy city or highway commuters should weight accordingly.
The EPA's combined rating uses a 55% city / 45% highway weighting. If your actual driving is 80% highway — a long interstate commute — the combined number overrepresents city performance. For someone driving 30 miles of freeway each way, the highway rating is far more predictive.
Conversely, urban drivers who rarely exceed 35 mph should pay close attention to the city rating, especially for hybrids where city performance often exceeds highway performance due to regenerative braking.
A practical approach: estimate your personal city/highway split and calculate your own weighted average. If you drive 70% highway and 30% city on a vehicle rated 25 city / 35 highway, your expected combined is (0.30 × 25) + (0.70 × 35) = 32 MPG — higher than the EPA's 29 combined for the same car. That extra 3 MPG over 15,000 miles saves you roughly $60–$70 per year at current gas prices. Small, but worth knowing accurately.
Don't Buy on the Sticker Number Alone
Dealers and manufacturers have no obligation to tell you that real-world MPG will differ from the EPA estimate. The responsibility is yours. Before committing to a vehicle based on fuel economy, pull user-reported data from fueleconomy.gov for that specific model, trim, and drivetrain. A 5–8 MPG real-world gap is common and can cost you hundreds of dollars annually that no one at the dealership will mention.
AWD and Trim Upgrades Change the Rating
If you're comparing the base FWD model's EPA rating against an AWD-equipped version you actually intend to purchase, you're comparing the wrong numbers. Always verify the EPA rating for the exact trim, drivetrain, and engine you're buying. Dealers sometimes advertise the most flattering configuration's MPG without specifying which trim it applies to.
The Real Variables That Drive the Gap
Understanding the myth-fact divide is one thing. Knowing exactly which factors create the gap between sticker and pump gives you something actionable.
Speed
Aerodynamic drag increases with the square of velocity. Going from 65 to 75 mph doesn't cost you a little extra fuel — it costs you roughly 10–15% more fuel per mile. The EPA highway test maxes out at 60 mph. If you routinely cruise at 75 or 80, your highway MPG will be measurably lower than the sticker.
Temperature
Cold air is denser, which actually helps combustion slightly — but the cold-start penalty far outweighs that benefit. Engine oil thickens, tire pressure drops (roughly 1 PSI per 10°F decrease), and the drivetrain needs more time to reach operating temperature. The EPA's cold-temperature cycle partially accounts for this, but only at 20°F. If you live somewhere that sees -10°F winters, expect worse results. Temperature extremes hit your gas mileage harder than most drivers expect — summer heat and A/C load add another layer of complexity.
Tire Pressure
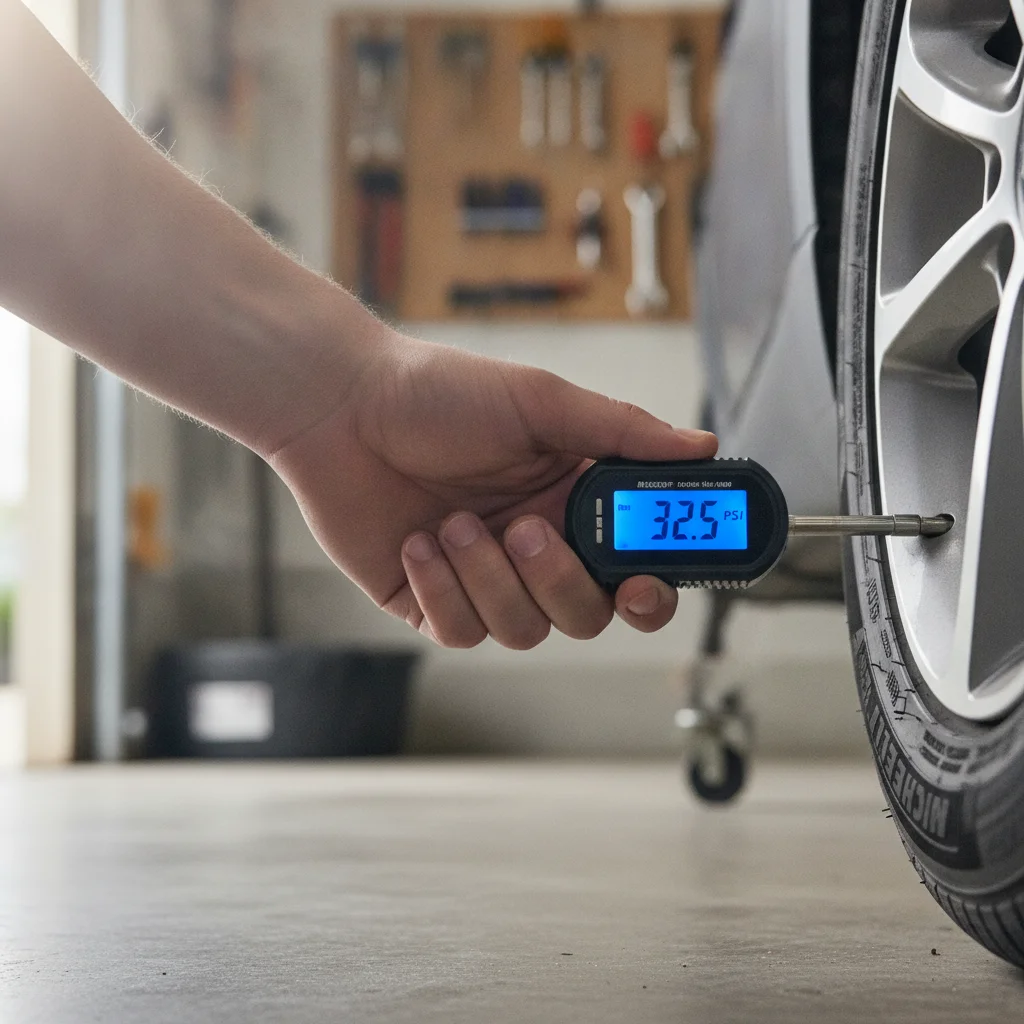
Every 1 PSI below the recommended pressure adds roughly 0.2% to rolling resistance. That sounds trivial until you realize most people drive 5–7 PSI underinflated without noticing. Underinflated tires quietly drain your MPG in ways that compound over thousands of miles.
Fuel Blend
Most pump gasoline in the U.S. is E10 — 10% ethanol. Ethanol contains about 33% less energy per gallon than pure gasoline. The impact on a tank of E10 is modest (roughly 3–4% MPG reduction), but it's real and rarely mentioned on stickers. The MPG drop scales up with ethanol concentration, with E85 flex-fuel vehicles seeing drops of 25–30%.
Transmission and Drivetrain
The EPA tests a specific transmission configuration. If your vehicle has all-wheel drive and the tested vehicle was front-wheel drive, you're already starting behind the sticker. AWD adds mechanical drag; the penalty varies by system but typically runs 1–3 MPG on combined ratings. How your transmission type handles efficiency in real-world driving matters more than most buyers factor in.
10–20%
Typical real-world MPG shortfall vs. EPA estimate
According to fueleconomy.gov user-submitted data aggregated across thousands of vehicle models and model years.
48 mph
Average speed in EPA highway test cycle
The EPA's HWFET highway test averages 48 mph with a 60 mph maximum — well below typical U.S. interstate speeds.
~25%
Cold-weather MPG drop for short trips
The U.S. Department of Energy estimates fuel economy can drop 15–24% for short trips in cold weather (below 20°F) vs. optimal conditions.
$1,750
Five-year fuel cost difference per 5 MPG gap
Based on 15,000 annual miles, $3.50/gallon gas, and a 5 MPG real-world difference between two comparable vehicles.
15–20%
EPA vehicles tested annually by the EPA itself
The EPA audits roughly 15–20% of new vehicle models each year; manufacturers self-test and submit the remaining results.
How to Use EPA Ratings the Right Way
None of the above means EPA ratings are useless. They're genuinely valuable — when used for the right purpose.
Use Them for Comparison, Not Prediction
The EPA tests every vehicle under the same standardized conditions. That makes the numbers excellent for comparing two cars against each other. If Vehicle A is rated 32 combined and Vehicle B is rated 28 combined, A will almost certainly use less fuel in your hands too — even if both fall short of their sticker numbers in practice.
Apply a Personal Discount Factor
A conservative approach: assume you'll see 10–15% below the combined rating in mixed daily driving. If you have a long highway commute at moderate speeds, you might beat the highway rating. If you do short urban trips in cold weather, assume 20% or more below the city rating during winter months.
Run the math with those adjusted numbers before you buy. At $3.50 per gallon, the difference between 25 real-world MPG and 30 real-world MPG over 15,000 annual miles is roughly $350 per year — $1,750 over a five-year ownership period. That's real money worth factoring into your payment comparison.
Check Crowdsourced Real-World Data
The EPA's fueleconomy.gov lets users submit their actual MPG. For popular models with thousands of submissions, the aggregated data is remarkably reliable. Search for the specific model year, trim, and drivetrain configuration you're considering. The user average will usually land 5–12% below the EPA estimate — and sometimes very close to it for efficient highway vehicles.
The gap between sticker and pump exists for specific, documentable reasons — understanding them lets you predict your real fuel costs with reasonable accuracy.
Track It After You Buy
Once you own the vehicle, track your actual MPG. Fill the tank full, reset the trip odometer, drive normally, fill up again. Divide miles driven by gallons added. That's your real number. Do it a few times to establish a baseline. OBD apps and built-in displays can automate this tracking with more granularity than manual fill-ups.
The EPA Number Is a Benchmark, Not a Guarantee
No federal law requires a car to achieve its EPA-rated fuel economy. The rating is a standardized estimate generated under specific test conditions that differ from real-world driving. If your car consistently delivers significantly lower MPG than the EPA estimate, the manufacturer is not legally liable — provided the vehicle is operating normally. Your only recourse is to be informed before you buy. Verify real-world data, apply a personal discount to the estimate, and factor adjusted fuel costs into your total cost of ownership calculation before signing.
EPA Ratings for Electrified and Alternative-Fuel Vehicles
The gap between rated and real-world efficiency gets more complicated — and more consequential — with electrified vehicles.
For plug-in hybrids and EVs, the EPA uses MPGe (miles per gallon equivalent) as a common unit, translating kilowatt-hours of electricity into a gasoline-equivalent figure. The baseline: 33.7 kWh equals one gallon of gasoline in energy terms. This lets you compare a 100 MPGe EV against a 35 MPG conventional car on the same scale.
But real-world EV range diverges from EPA estimates even more sharply than gasoline MPG does, particularly in cold weather. Battery chemistry is temperature-sensitive in ways that engine combustion is not. A rated 300-mile EV might deliver 200 miles on a 10°F morning — a 33% reduction — while a rated 35 MPG gas car might only drop to 30 MPG.
The EPA's EV range estimate follows a specific test cycle with its own limitations. If you're cross-shopping gas and electric options, understanding how the EPA labels different electrified vehicle types keeps you from making apples-to-oranges comparisons.
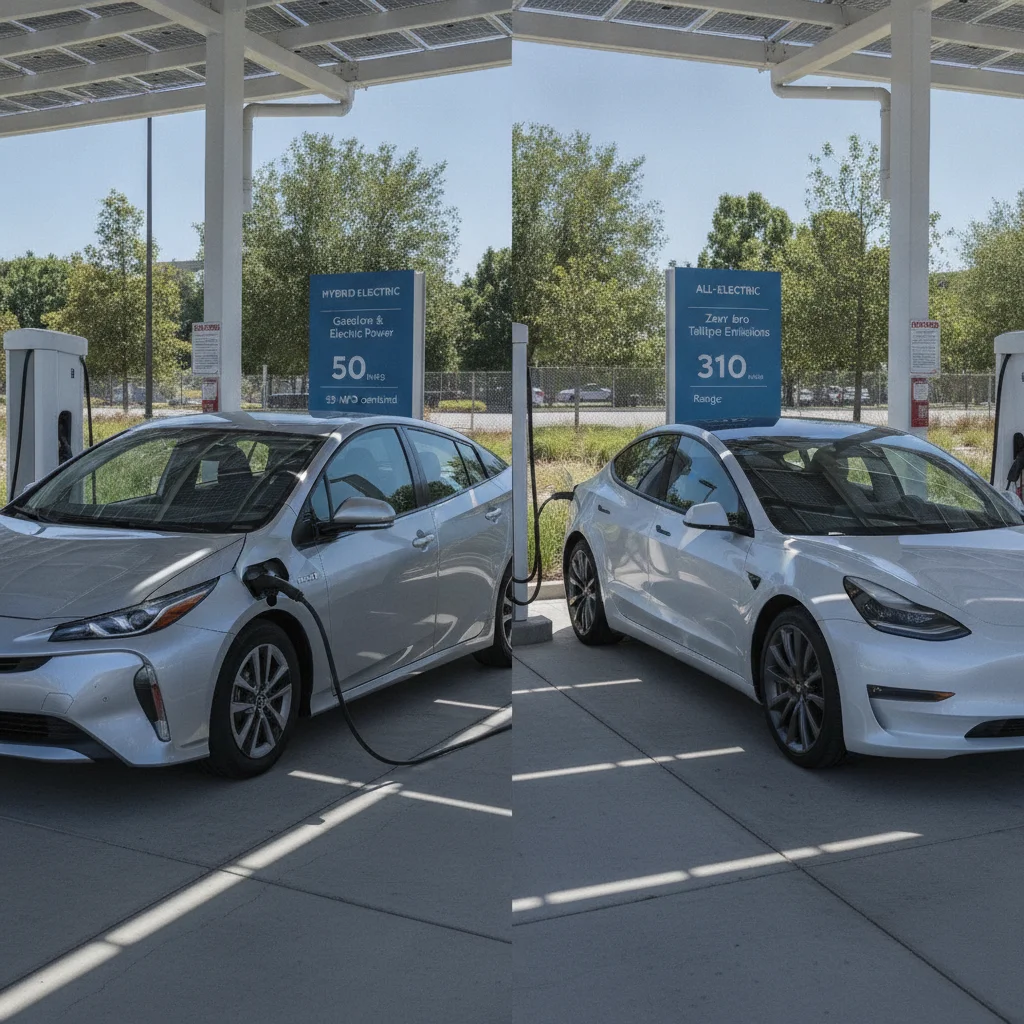
For conventional hybrids, the city/highway split often reverses compared to gas-only vehicles. Hybrids recover energy through regenerative braking, which works best in stop-and-go traffic. A Toyota Camry Hybrid is rated 51 city / 53 highway — nearly the same, and the city number is actually more reliable than the highway rating because EPA city testing captures more braking events.
Bottom line: the same skepticism applies across all fuel types. Use ratings for comparison, apply a discount for real-world prediction, and verify against user data before you commit.
Making Fuel Economy Work in Your Buying Decision
Here's how to turn everything above into a practical checklist at the dealership or while shopping online.
- Pull the window sticker for every vehicle you're seriously considering. Get the combined MPG figure and note the drivetrain configuration — FWD, AWD, or 4WD ratings differ.
- Apply your personal discount. Use 15% below combined as a conservative real-world estimate for mixed driving. Adjust up if you do mostly steady highway miles; adjust down if you're in a cold climate or do primarily short city trips.
- Check fueleconomy.gov user data. Filter by your model year, trim, and engine. Compare the user average to your discounted estimate.
- Calculate five-year fuel cost difference. Even a 3 MPG difference adds up. Use the EPA's cost calculator or do it manually: (annual miles ÷ real-world MPG) × price per gallon × 5.
- Factor in the fuel type. A vehicle rated for premium fuel costs more per mile to run than the sticker comparison suggests if you're comparing it to a regular-fuel vehicle. Run the math on the fuel grade, not just the MPG.
- Don't over-weight fuel economy against reliability and use case. A vehicle you use correctly — right size, right drivetrain for your geography — will serve you better than one purchased primarily for a MPG number you may never approach.
The EPA rating system, for all its limitations, gives you something no other single source does: a standardized benchmark across every new car sold in the U.S. Use it as that, and you'll make a better decision than buyers who either ignore it or trust it blindly.
For a deeper look at how engine size interacts with real-world fuel economy — including why a turbocharged four-cylinder doesn't always beat a V6 in practice — that's worth reading before you narrow down your shortlist.

All claims are backed by peer-reviewed research. Sources on request.