Key Takeaways
EPA Fuel Economy Gap
The EPA fuel economy gap is the difference between the miles-per-gallon figure printed on a new car's window sticker and the MPG you actually get during real-world driving. EPA ratings are produced under controlled laboratory conditions that don't fully replicate the variety of roads, speeds, temperatures, and driving habits most people encounter every day. As a result, nearly every driver experiences some gap — usually between 10% and 25% below the sticker number.
EPA testing uses standardized drive cycles (City, Highway, and Combined) conducted on a dynamometer, not actual roads. Since 2008, the EPA has applied adjustment factors to bring lab numbers closer to real-world results, but significant variation remains due to individual driving conditions.
The Promise on the Sticker vs. the Reality at the Pump
You bought the car partly because it was rated at 32 MPG combined. A few months in, your actual fill-up math keeps coming out around 26 or 27. You're not imagining it, and your car probably isn't broken. This is one of the most common frustrations in car ownership — and it has a clear explanation.
The number on the EPA window sticker is a starting point, not a contract. It's generated under specific, repeatable laboratory conditions designed to allow fair comparison between vehicles. What it can't do is predict how you specifically drive, where you live, or what the weather is doing. Those variables matter enormously, and they're the main reason almost every driver ends up below the sticker.
Understanding why the gap exists puts you in a better position — not just to manage your expectations, but to actually recover some of that lost fuel economy through practical changes. The gap isn't entirely out of your control.
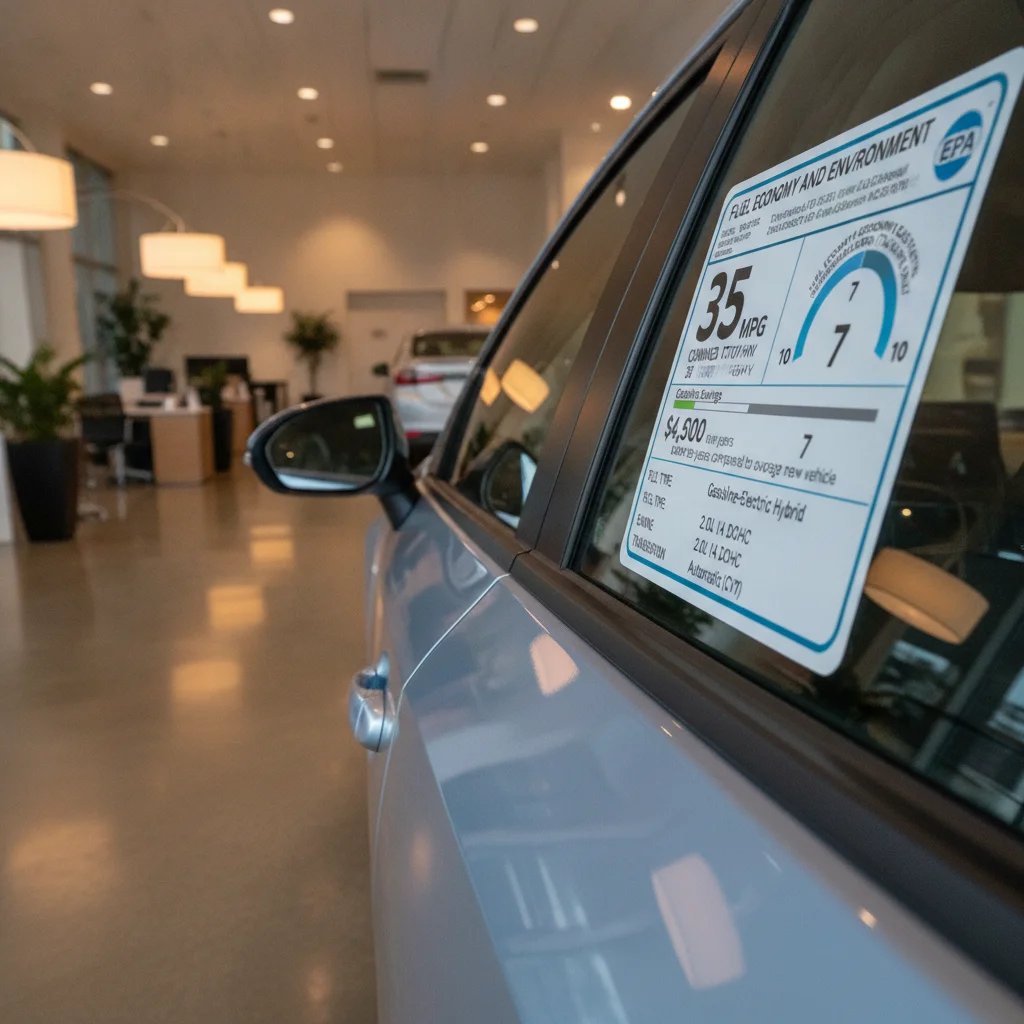
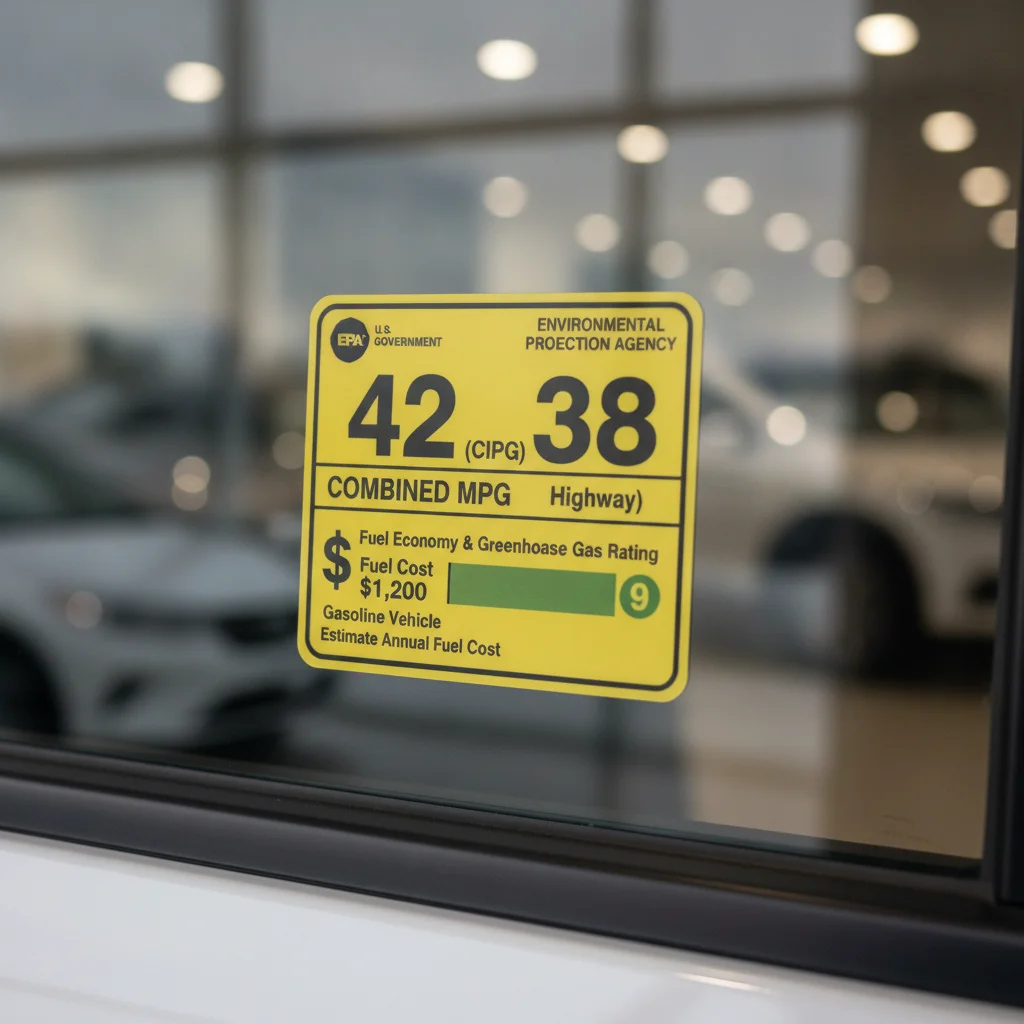
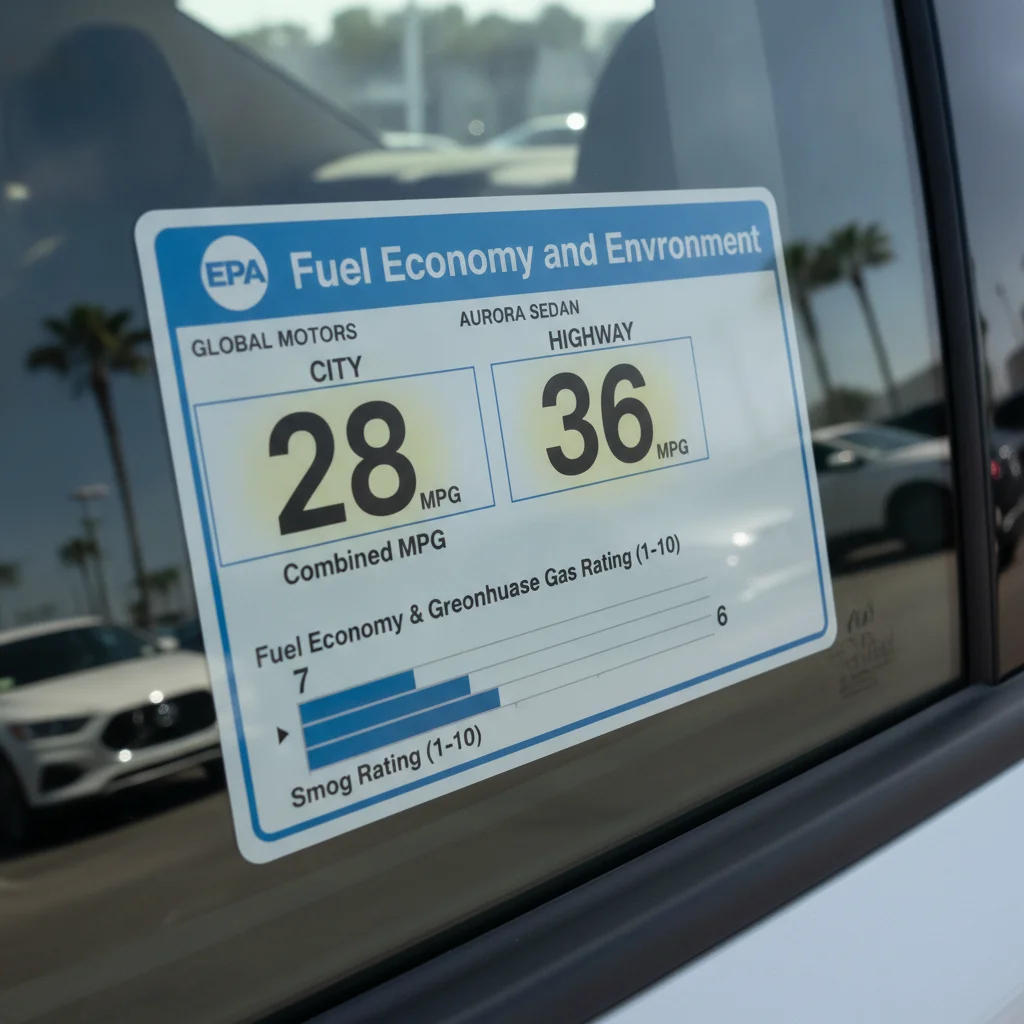
Reading a fuel economy label in full detail can help you understand every number on the sticker — including the estimated annual fuel cost that's often more useful than the raw MPG figure.
How the EPA Actually Tests Fuel Economy
The EPA doesn't take cars out on public roads and measure how they do in traffic. Instead, vehicles are tested on a machine called a dynamometer — essentially a sophisticated treadmill for cars — inside a temperature-controlled laboratory. A trained technician follows a scripted drive cycle: a sequence of speed targets, stops, and accelerations that simulate city and highway driving patterns.
There are five test cycles in total, added or refined over the years:
- City cycle: Simulates urban stop-and-go driving at an average speed of about 21 mph
- Highway cycle: Simulates faster, steadier driving averaging around 48 mph
- High-speed cycle: Added in 2008, this reaches speeds up to 80 mph to better represent actual highway travel
- Air conditioning cycle: Measures the fuel cost of running climate control
- Cold temperature cycle: Tests performance at 20°F to account for winter conditions
The results from these cycles are mathematically combined and adjusted to produce the City, Highway, and Combined MPG figures you see on the sticker. The adjustments are designed to correct for the fact that lab conditions are still not identical to the road — but they can only go so far.
How EPA Combined MPG Is Weighted
The EPA's combined MPG figure is a weighted average: 55% city driving and 45% highway driving. If your daily routine is almost entirely highway miles or almost entirely city stop-and-go, the combined rating will be a less accurate predictor for you. Look at the separate city and highway figures and weight them to match your actual driving split for a more realistic estimate.
Winter-Blend Fuel and Energy Content
In colder months, fuel refiners are required to produce winter-blend gasoline that evaporates more readily in cold air, reducing air pollution. However, winter-blend fuel contains slightly less energy per gallon than summer-blend fuel. This means even with identical driving conditions, winter fuel will produce marginally fewer miles per gallon — a small but real contributor to the seasonal MPG dip many drivers notice.
The EPA's combined MPG figure is weighted 55% city and 45% highway. If your daily driving skews more heavily toward either extreme, the combined number will be less predictive for you specifically. Understanding what EPA numbers mean for your purchase decision can help you pick the right vehicle for your actual commute.
The Biggest Reasons Your MPG Falls Short
The lab-to-road gap isn't random. There are well-understood, predictable reasons why real-world fuel economy underperforms the sticker. Here are the most significant ones:
Speed Above 50 mph
Aerodynamic drag increases with the square of speed. That means going from 55 mph to 75 mph doesn't just add 36% more drag — it more than doubles it. The EPA's highway test cycle averages about 48 mph, but most American highway driving happens between 65 and 80 mph. That alone can cost you 7–14% in fuel economy compared to what the test cycle measures.
Air Conditioning
Running the A/C is essentially running an additional appliance off your engine. In city driving, this can reduce MPG by 5–25% depending on the outside temperature and how aggressively the system is working. The EPA does include an A/C test cycle, but the degree to which A/C is used varies enormously by region and season.
Short Trips and Cold Starts
A cold engine is an inefficient engine. Modern gasoline engines operate most efficiently at their normal operating temperature, which typically takes 5–10 minutes to reach. If your typical trip is only a mile or two, your engine spends most of that trip in a less efficient warm-up state. The EPA test assumes the engine is already at operating temperature.
Stop-and-Go Traffic
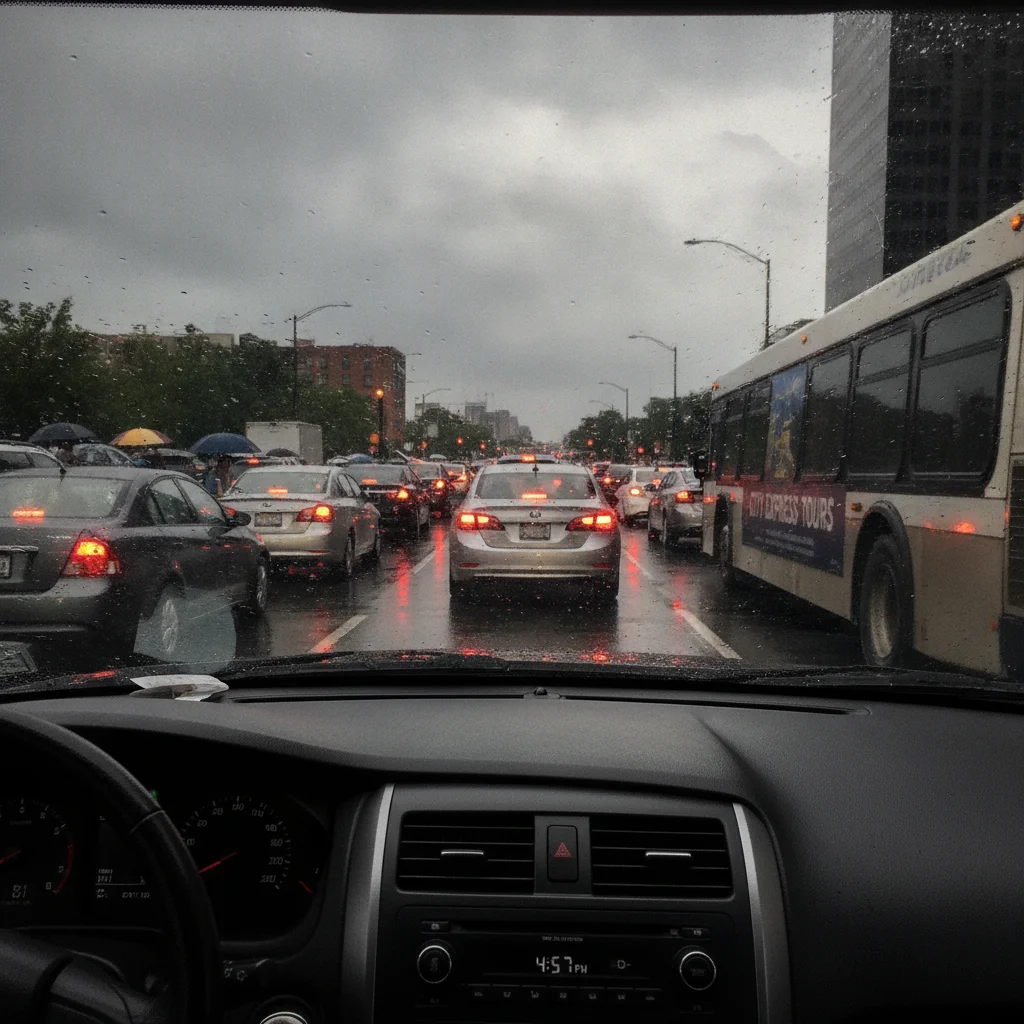
The city test cycle includes stops, but the real world can be far more stop-heavy than the test assumes. Every time you brake, you convert kinetic energy to heat and waste it. In genuinely congested urban driving — long red lights, school zones, construction — real city MPG can fall well below the rated city estimate.
Cargo and Passengers
The EPA tests vehicles at a standardized curb weight with no additional load. Every extra 100 pounds reduces fuel economy by roughly 1–2%. A family of four with luggage on a road trip is carrying meaningfully more weight than the test vehicle, which adds up over hundreds of miles.
Tire Inflation and Condition
Underinflated tires increase rolling resistance — the friction your drivetrain has to overcome just to keep the car moving at a steady speed. This is one of the most overlooked and easily corrected contributors to poor fuel economy. Old, worn tires can also increase rolling resistance even when properly inflated.
10–25%
Typical shortfall below EPA combined rating
U.S. Department of Energy data shows most drivers experience real-world MPG 10–25% below the EPA sticker under normal driving conditions.
15–24%
MPG reduction in cold weather (20°F vs. 77°F)
According to the U.S. Department of Energy, conventional gasoline vehicles lose 15–24% fuel economy in cold temperatures compared to mild conditions.
Up to 40%
MPG penalty from aggressive city driving
The U.S. Department of Energy estimates aggressive driving — hard acceleration and braking — can reduce fuel economy by up to 40% in city conditions.
~1–2%
MPG lost per 100 lbs of extra vehicle weight
The U.S. EPA estimates that every additional 100 pounds of load reduces fuel economy by approximately 1–2%, depending on vehicle size.
5–25%
Fuel economy penalty from air conditioning use
The U.S. Department of Energy reports A/C use reduces fuel economy by 5–25% in city driving, with the largest impact in hot weather and short trips.
Track Your Real MPG Simply
The easiest way to measure your actual fuel economy is the fill-up method: fill the tank completely, reset your trip odometer, drive normally, then fill the tank again. Divide the miles driven by the gallons it took to refill. Doing this over several fill-ups gives you a reliable average that accounts for your specific driving conditions — far more useful than your dashboard's instant MPG display.
Compare Real-World Data Before You Buy
Before purchasing any vehicle, check the owner-reported fuel economy data at fueleconomy.gov. Drivers who own the exact vehicle you're considering have submitted real-world MPG numbers from their actual commutes and driving conditions. Filtering by your region can give you a realistic preview of what to expect, especially if you live in an area with extreme weather or significant elevation changes.
Weather and Geography Play a Bigger Role Than Most Drivers Realize
Where you live and what season it is can have a surprisingly large impact on your fuel economy — in ways that have nothing to do with how you drive.
Cold weather is particularly costly. Engine oil thickens when cold, increasing internal friction. Tire pressure drops roughly 1 PSI for every 10°F decrease in temperature. Battery performance in vehicles with start-stop systems or mild hybrids degrades in cold. And the fuel itself — winter-blend gasoline, which is required in cold regions to reduce smog — contains slightly less energy per gallon than summer-blend fuel. The EPA estimates that a conventional gasoline car can get 15–24% lower MPG at 20°F compared to 77°F conditions.
Elevation also matters. At higher altitudes, thinner air reduces aerodynamic drag slightly, but naturally aspirated engines produce less power because there's less oxygen for combustion. Turbocharged engines partially compensate, but mountain roads also mean more climbing, which costs fuel regardless of engine type.
Road surface and terrain add another layer. Gravel roads, rough pavement, and hilly terrain all increase fuel consumption compared to smooth, flat interstate driving. The EPA's test cycles assume flat, smooth surfaces.
This is one reason it helps to look at community-sourced real-world fuel economy data — which you can find for most vehicles at fueleconomy.gov — rather than relying solely on the sticker number. Drivers in your region, with your climate, often report numbers that are far more predictive than the lab results.
“The EPA fuel economy label gives you a reliable way to compare vehicles, but your actual mileage will depend on how you drive, where you drive, and how well you maintain your vehicle. The gap between the label and reality is normal — and partly within your control.”
— U.S. Department of Energy, Office of Energy Efficiency and Renewable Energy, fueleconomy.gov
What You Can Actually Do to Close the Gap
Here's the reassuring part: while you can't replicate lab conditions on public roads, you can make real choices that meaningfully improve your fuel economy. Some of these are habits; some are maintenance items. None of them require significant expense.
Slow Down on the Highway
This is the single highest-impact change most drivers can make. Dropping from 75 mph to 65 mph on a highway trip can improve fuel economy by 10–15%. It's not always practical, but on longer drives it adds up — in fuel savings and, depending on your state, in peace of mind about speed limits.
Anticipate Traffic Flow
Smooth, gradual acceleration and coasting to stops rather than braking hard are the hallmarks of fuel-efficient driving. Think ahead. If the light ahead is red, ease off the gas early and let the car decelerate on its own. You're converting momentum into forward motion rather than brake heat.
Keep Tires Properly Inflated
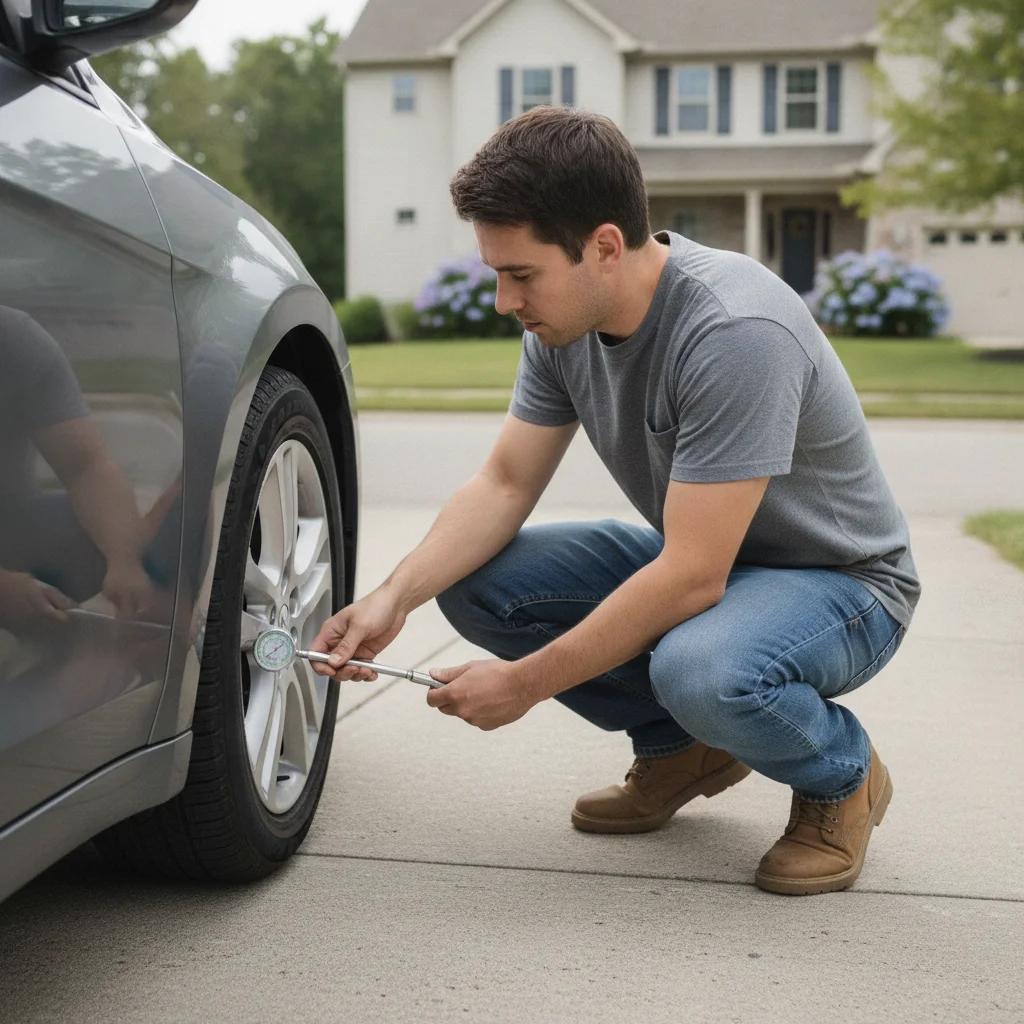
Check tire pressure monthly and before any long trip. The correct pressure for your car is on a sticker inside the driver's door jamb — not on the sidewall of the tire (that number is the tire's maximum, not your car's recommended pressure). A few minutes with a gauge and an air compressor is one of the cheapest fuel economy improvements available to you.
Use A/C Strategically
At low speeds in mild weather, opening windows is more efficient. At highway speeds above 45–50 mph, open windows create enough drag that A/C becomes comparably efficient or better. In hot weather, parking in the shade or using a sunshade reduces the initial cabin heat load, so your A/C doesn't have to work as hard at startup.
Reduce Unnecessary Weight
If you've been hauling a full set of tools, sports equipment, or other gear in your trunk for months, removing it helps. Roof racks and cargo boxes create significant aerodynamic drag even when empty — remove them when you don't need them.
Keep Up With Basic Maintenance
A clogged air filter, worn spark plugs, or contaminated oxygen sensors all degrade combustion efficiency. Staying current on manufacturer-recommended maintenance intervals keeps your engine running the way it was designed to. If your MPG has dropped suddenly rather than gradually, that's often a sign of a specific mechanical issue worth diagnosing. A systematic fuel economy audit can help you work through the most common culprits.
Using the EPA Sticker Correctly — Even If It's Not Perfectly Accurate
None of this means the EPA sticker is useless. It's one of the most useful tools available when you're comparing vehicles at the dealership — as long as you understand what it's measuring and what it isn't.
The sticker's value lies in its consistency. Because every vehicle is tested the same way, the relative rankings are meaningful even if the absolute numbers are optimistic. A car rated at 38 MPG combined will almost certainly be more fuel efficient in your hands than one rated at 28 MPG combined, even if neither hits its sticker number in real-world driving.
The annual fuel cost estimate on the sticker is often more directly useful than the raw MPG figure. It translates fuel economy into dollars based on assumed mileage and average fuel prices — and while those assumptions may not match your exact situation, they give you a practical cost comparison between vehicles in consistent terms.
Every number on the EPA fuel economy label tells a story about the vehicle's efficiency — from the city/highway split to the range of MPG reported by actual owners. Learning to read all of it makes you a better-informed buyer.
And if you're cross-shopping a hybrid or electric vehicle, the same principle of relative comparison applies — the sticker tells you which option is more efficient, even if neither hits its rated number every day. EV range estimates face the same real-world gap for the same underlying reasons as gasoline MPG figures.

All claims are backed by peer-reviewed research. Sources on request.