| Label required by | Federal law (Energy Policy and Conservation Act) (U.S. Department of Energy) |
| Current label design introduced | 2013 model year (EPA) |
| Assumed annual mileage for estimates | 15,000 miles per year (EPA fuel economy label methodology) |
| City/Highway split used for combined MPG | 55% city, 45% highway (EPA) |
| Environmental rating scale | 1 (worst) to 10 (best) (EPA Smog and GHG ratings) |
| Energy equivalent used for MPGe | 33.7 kWh per gallon of gasoline (EPA) |
| Where to find your vehicle's label data online | fueleconomy.gov (U.S. Department of Energy / EPA) |
| Number of EPA test cycles used | 5 driving cycles (city, highway, high speed, AC use, cold temp) (EPA testing methodology, post-2008) |
What the Fuel Economy Label Actually Is
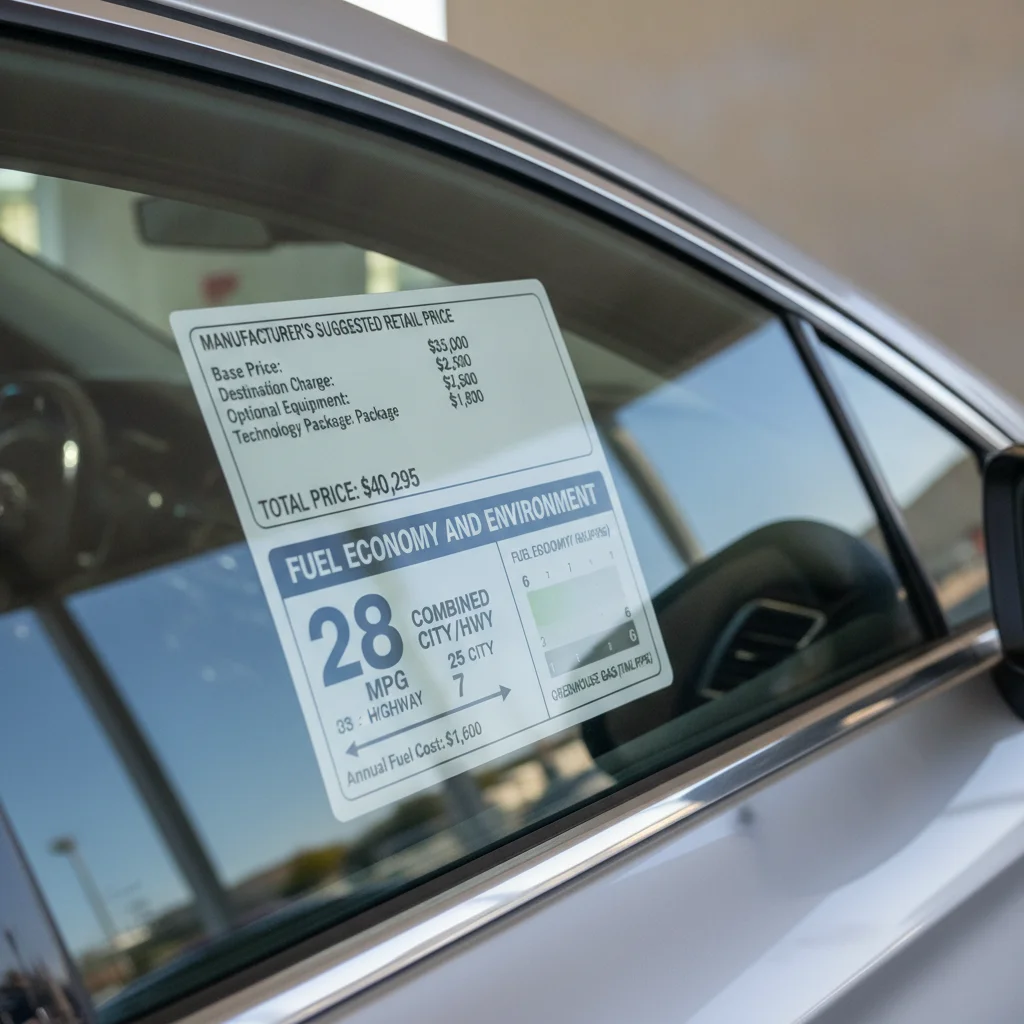
Every new car sold in the United States is required by federal law to display a fuel economy label — commonly called the EPA sticker or Monroney sticker — on the window. The National Highway Traffic Safety Administration (NHTSA) and the Environmental Protection Agency (EPA) jointly govern what appears on it. While most buyers glance at the big MPG number and move on, the label is genuinely packed with useful data if you know where to look.
The current label design, introduced in 2013, was overhauled specifically to give buyers better comparison tools. It added a fuel cost estimate, a carbon emissions score, and a smog score alongside the traditional city and highway figures. For electric and plug-in hybrid vehicles, there's a separate label format that shows miles per gallon equivalent (MPGe) and electric range.
Understanding every section of the label helps you make a smarter buying decision — not just at the sticker price level, but over the full cost of ownership. See our guide to the full Monroney label for context on everything else the window sticker discloses.
| Label required by | Federal law (Energy Policy and Conservation Act) (U.S. Department of Energy) |
| Current label design introduced | 2013 model year (EPA) |
| Assumed annual mileage for estimates | 15,000 miles per year (EPA fuel economy label methodology) |
| City/Highway split used for combined MPG | 55% city, 45% highway (EPA) |
| Environmental rating scale | 1 (worst) to 10 (best) (EPA Smog and GHG ratings) |
| Energy equivalent used for MPGe | 33.7 kWh per gallon of gasoline (EPA) |
| Where to find your vehicle's label data online | fueleconomy.gov (U.S. Department of Energy / EPA) |
| Number of EPA test cycles used | 5 driving cycles (city, highway, high speed, AC use, cold temp) (EPA testing methodology, post-2008) |
The Big Three: City, Highway, and Combined MPG
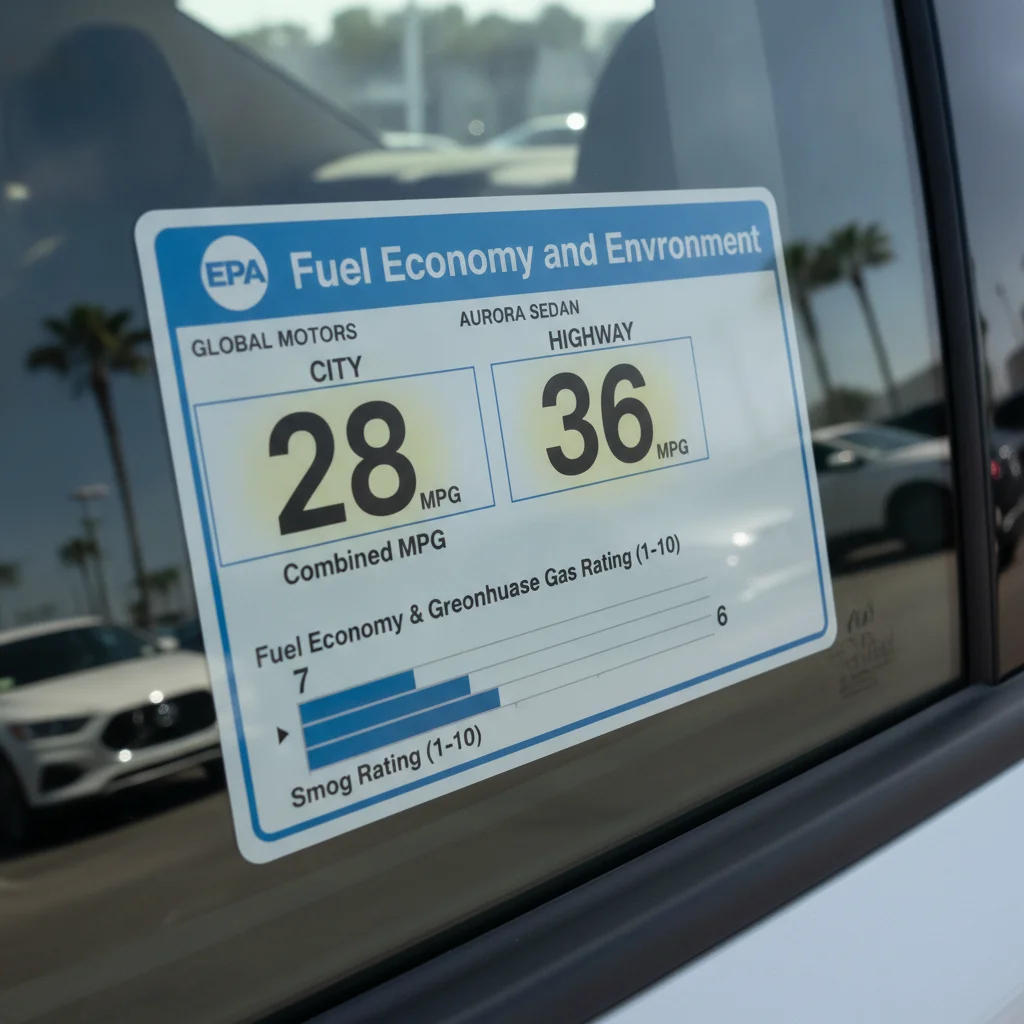
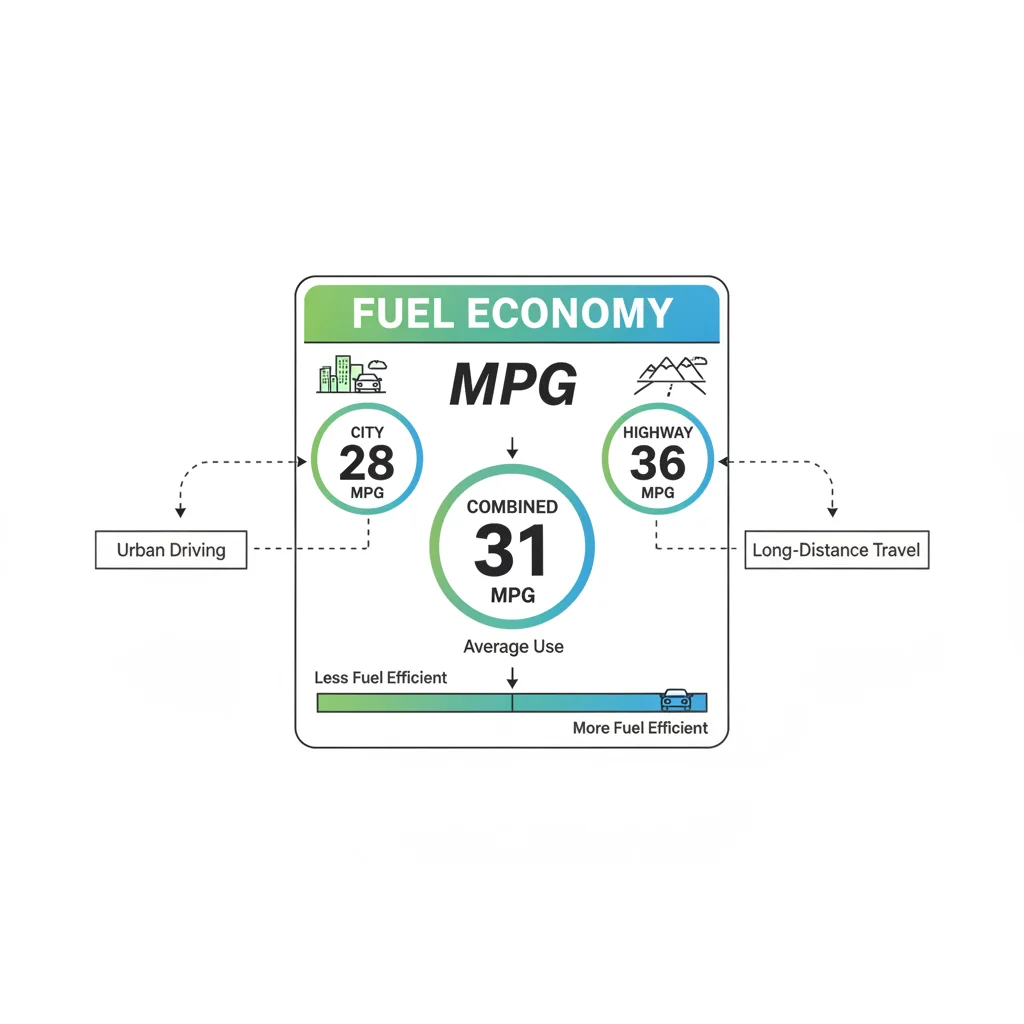
The three largest numbers on the label are city, highway, and combined fuel economy ratings. Here's what each one actually represents:
- City MPG — Derived from a simulated urban driving cycle with frequent stops, idling, and lower average speeds. This is typically the lower of the two figures because stop-and-go driving burns more fuel per mile.
- Highway MPG — Derived from a higher-speed, steadier-pace simulation. Most drivers see their best fuel economy on open roads, which is why this number is higher.
- Combined MPG — A weighted average calculated as 55% city and 45% highway driving. This is the most useful single number for everyday comparisons.
The combined figure is the one the EPA uses when comparing vehicles side by side and when calculating annual fuel cost estimates. If your commute is mostly highway, you can weight the highway number more heavily in your personal math. If you live in a dense urban area, the city number matters more.
One thing worth knowing: these figures come from laboratory dynamometer tests, not from driving an actual car on an actual road. That's why real-world results often differ. Our article on why your MPG is lower than the sticker says explains the gap in detail — it's a normal and expected discrepancy, not a sign something is wrong with your vehicle.
~20%
Typical real-world MPG gap below EPA city estimate
According to EPA data analysis, real-world city driving often falls 15–25% below the label figure due to traffic patterns and driver behavior.
15,000
Annual miles assumed in fuel cost estimates
The EPA uses 15,000 miles per year as its baseline for all annual fuel cost calculations printed on the label.
5
Number of driving test cycles behind modern EPA ratings
Since 2008, the EPA has used five separate driving simulations — including high speed, air conditioning use, and cold weather starts — to calculate label figures.
33.7 kWh
Energy equivalent of one gallon of gasoline (for MPGe)
The EPA established this equivalency to allow meaningful comparison between electric and gasoline vehicle efficiency on the same label.
Annual Fuel Cost and the 5-Year Savings Comparison
Below the MPG figures, you'll find an estimated annual fuel cost. This number is calculated using the EPA's assumed fuel price and a standard driving assumption of 15,000 miles per year, split 55/45 between city and highway. As of the most recent label revision, the EPA updates the assumed fuel price periodically to reflect national averages.
This estimate is a useful ballpark, but it's based on averages. If you drive significantly more or less than 15,000 miles annually, or if fuel prices in your area differ from the national average, your real cost will differ. You can plug your actual numbers into the EPA's fuel cost calculator at fueleconomy.gov for a personalized estimate.
More useful is the 5-year savings or cost comparison shown on the label. It compares the vehicle you're looking at against the average new vehicle sold in the same model year. If the label shows "You save $1,500 over 5 years," that means this vehicle costs $1,500 less to fuel over five years than the average new car — a genuinely helpful data point when comparing two models you're considering.
Fuel Price Assumptions Change Over Time
The annual fuel cost figure on the label is calculated using an EPA-assumed fuel price that is updated periodically — not the price at your local pump. When gas prices are especially high or low, the real annual cost will diverge from the label estimate. Visit fueleconomy.gov to recalculate using current prices in your area.
Used Cars Don't Have the New-Format Label
The redesigned 2013 EPA label applies only to new vehicles. If you're shopping for a used car, the original window sticker may still be present, but it could use an older format with fewer data points. You can look up any vehicle's EPA fuel economy history at fueleconomy.gov using the model year, make, and model.
PHEVs Carry Two Label Sections
Plug-in hybrid vehicles display two distinct efficiency sections: one for electric-only operation (showing MPGe and electric range) and one for gasoline operation (showing standard MPG). When evaluating a PHEV, consider how closely your daily commute matches the electric range — drivers who charge regularly and stay within electric range can far exceed the gasoline MPG figures.
Emissions Scores: Smog and Greenhouse Gas Ratings
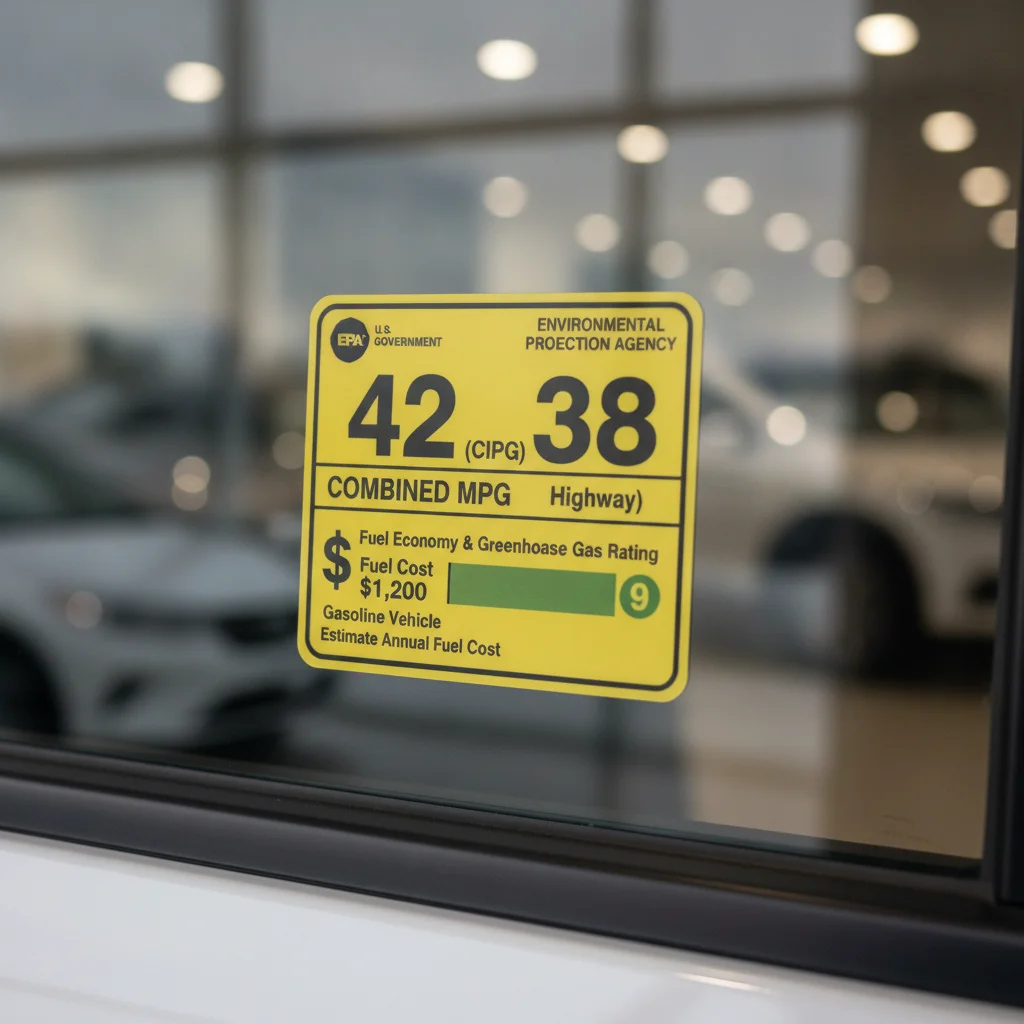
On the right side of the label, you'll find two environmental ratings displayed on 1–10 scales: the Smog Rating and the Greenhouse Gas (GHG) Rating. Both are scored on a scale where 1 is the worst and 10 is the best among all vehicles sold that year.
- Smog Rating — Measures tailpipe emissions of smog-forming pollutants like nitrogen oxides and hydrocarbons. A 7 or higher is solid; a 10 means the vehicle emits the least smog-forming pollution in its class.
- Greenhouse Gas Rating — Tied directly to fuel economy: the less fuel a vehicle burns, the lower its CO₂ emissions per mile, and the higher its GHG score. A vehicle rated 10 in this category produces the fewest greenhouse gas emissions among all vehicles tested.
These scores are more useful than they might appear. If you're comparing two vehicles with similar MPG figures, the smog rating can reveal meaningful differences in how clean each engine actually runs. Electric vehicles typically score 10 in greenhouse gas for tailpipe emissions, though the label may note that emissions from electricity generation vary by region.
For plug-in hybrids and electric vehicles, the label format changes significantly. Instead of city/highway MPG, you'll see MPGe (miles per gallon equivalent) for electric operation and a separate range figure. The label also displays the estimated cost to drive 25 miles on electricity, making it easy to compare against a gasoline-powered alternative.
MPG (Miles Per Gallon)
A measure of how far a vehicle travels on one gallon of fuel. Higher MPG means greater fuel efficiency and lower fuel costs per mile driven.
MPGe (Miles Per Gallon Equivalent)
A rating used for electric and plug-in hybrid vehicles that expresses efficiency in terms of how far the vehicle travels on the energy equivalent of one gallon of gasoline (33.7 kWh).
Combined MPG
A weighted average of city and highway fuel economy ratings, calculated as 55% city driving and 45% highway driving. It is the most commonly cited single efficiency figure for comparison purposes.
Smog Rating
An EPA score from 1 to 10 measuring a vehicle's tailpipe emissions of smog-forming pollutants like nitrogen oxides and hydrocarbons. A score of 10 represents the cleanest vehicles tested.
Greenhouse Gas (GHG) Rating
An EPA score from 1 to 10 reflecting a vehicle's carbon dioxide emissions per mile. Since CO₂ output is directly tied to fuel consumption, this score closely mirrors fuel economy performance.
Monroney Label
The federally mandated window sticker on new vehicles, named after Senator Mike Monroney who sponsored the Auto Information Disclosure Act. It includes the fuel economy label as well as pricing and features information.
Vehicle Class (EPA)
A category assigned by the EPA based on interior passenger and cargo volume for cars, or gross vehicle weight rating for trucks. The fuel economy range bar on the label compares vehicles only within the same class.
Dynamometer Test
A laboratory test in which a vehicle is driven on a stationary roller system that simulates road conditions. All EPA fuel economy ratings are derived from dynamometer tests rather than on-road driving.
The Range Bar and How to Use It for Real Decisions
At the bottom of the label, there's a horizontal bar graph that shows where this vehicle's fuel economy falls within the range of all vehicles in its class. The scale runs from worst to best, and an arrow or marker shows exactly where this model lands.
This is one of the most underused parts of the label. Here's how to read it practically:
- Note the class designation printed just above the bar (e.g., "Small SUV," "Compact Car," "Standard Pickup Truck"). The comparison is within that specific class.
- See how far left or right the marker falls. A vehicle sitting near the right end of the bar is among the most efficient in its category, even if its raw MPG isn't impressive compared to a smaller car.
- Use the range numbers printed at each end of the bar to understand the spread. A class where the worst vehicle gets 18 MPG and the best gets 32 MPG has significant variation — choosing wisely within that class matters.
This context matters especially when you're comparing within a segment. A midsize truck getting 22 MPG combined might look modest on its own, but if it's at the top of the midsize truck range bar, it's the fuel-efficient choice in that category.
If you want to dig deeper into how these ratings translate to real driving conditions, our article on what EPA fuel economy ratings mean in real-world driving walks through the methodology and its limits.
Once you own the vehicle, tracking whether you're hitting the label estimates is worth doing. The fuel economy tracking tools guide covers everything from manual tank calculations to OBD-II apps that give you live data.
EPA Fuel Economy Guide (fueleconomy.gov)
The official U.S. government database lets you look up EPA fuel economy ratings for any vehicle by year, make, and model — and calculate personalized fuel costs based on your actual driving and local gas prices.
EPA Fuel Cost Calculator
Input your annual mileage and local fuel price to get a personalized annual fuel cost estimate for any vehicle, going well beyond the standard 15,000-mile assumption printed on the label.
Fuel Economy Tracking: Tools and Methods That Give You Real Insight
Once you own a vehicle, tracking your actual MPG against the label estimate reveals a lot. This guide covers manual calculations, OBD-II apps, and built-in displays for accurate real-world monitoring.
PlugStar EV Comparison Tool
For shoppers evaluating electric or plug-in hybrid vehicles, this tool helps translate MPGe ratings and electric range into real cost comparisons based on your local electricity rates.
Common Misreads and What to Keep in Mind
Even informed buyers misinterpret parts of the fuel economy label. A few things worth keeping straight:
The label is an estimate, not a guarantee
The EPA figures represent what the vehicle is capable of under standardized conditions — not what you'll necessarily achieve. Driving behavior, climate, load, tire pressure, and dozens of other factors affect real-world efficiency. The label itself carries a disclaimer: "Actual results will vary." For more on the legal weight of window sticker disclosures, see what the Monroney label does and doesn't guarantee.
The MPGe figure for EVs and PHEVs isn't directly comparable to gasoline MPG
MPGe tells you how far the vehicle travels on the electrical energy equivalent of one gallon of gasoline (33.7 kWh). It's useful for comparison between electrified vehicles, but comparing an EV's 100 MPGe to a sedan's 35 MPG on cost requires factoring in local electricity prices versus local gas prices — the label's annual cost estimate does this math for you.
The "average vehicle" comparison uses the current model year
The 5-year cost comparison on the label compares against the current model year average, which changes annually. A car labeled as "saving $900 over 5 years" in one model year might show a different figure on the next year's version of the same car if the fleet average shifts.
Class designations can be surprising
The EPA assigns vehicle classes based on interior volume for cars, and on gross vehicle weight rating (GVWR) for trucks and vans. A vehicle you think of as a "large" SUV might be classified as a "standard" SUV for label purposes. This matters because the range bar and class comparison are only meaningful within the correct class context.
Reading fuel and maintenance labels carefully is a theme worth extending. If you're digging into ownership costs more broadly, registration and tax costs are another area where the numbers on paper often differ from what you'll actually pay.

All claims are backed by peer-reviewed research. Sources on request.