| Average first-year depreciation | ~20% of MSRP (iSeeCars depreciation study, 2023) |
| Depreciation at 5 years | ~50–55% of original value lost (Edmunds True Cost to Own data) |
| Depreciation at 10 years | ~75–80% of original value lost (NADA Used Car Guide averages) |
| Steepest single-year loss | Year 1 (9–11% on top of drive-off loss) |
| Drive-off-lot instant loss | ~9–11% of MSRP (Kelley Blue Book new vs. used price differential analysis) |
| Slowest annual depreciation phase | Years 7–10 (~2–4% per year) |
| Best used-car value window | Years 4–6 (50–60% of original cost retained partially, price significantly lower than new) |
| Luxury vehicle depreciation (5 yr) | Often 55–65% — faster than mainstream vehicles (iSeeCars luxury depreciation report, 2023) |
Why Depreciation Follows a Predictable Curve
Depreciation isn't random. It follows a well-documented pattern that's consistent enough across most vehicle segments that you can actually plan around it. Once you understand the shape of the curve, you stop getting surprised by trade-in offers and start making smarter decisions about when to buy, when to sell, and how long to hold a vehicle.
The single most important thing to internalize: the sharpest drops happen earliest. A brand-new car loses more value in its first year than in years four and five combined. That front-loaded loss is what makes buying a lightly used vehicle such a reliable strategy — and what makes selling at certain milestones smarter than others.
Keep in mind that the numbers below represent industry averages. Individual vehicles deviate based on brand reputation, trim level, mileage, condition, regional demand, and broader market forces. For a full breakdown of what factors push depreciation faster or slower, see Vehicle Depreciation: The Complete Owner's Reference.
| Average first-year depreciation | ~20% of MSRP (iSeeCars depreciation study, 2023) |
| Depreciation at 5 years | ~50–55% of original value lost (Edmunds True Cost to Own data) |
| Depreciation at 10 years | ~75–80% of original value lost (NADA Used Car Guide averages) |
| Steepest single-year loss | Year 1 (9–11% on top of drive-off loss) |
| Drive-off-lot instant loss | ~9–11% of MSRP (Kelley Blue Book new vs. used price differential analysis) |
| Slowest annual depreciation phase | Years 7–10 (~2–4% per year) |
| Best used-car value window | Years 4–6 (50–60% of original cost retained partially, price significantly lower than new) |
| Luxury vehicle depreciation (5 yr) | Often 55–65% — faster than mainstream vehicles (iSeeCars luxury depreciation report, 2023) |
Year-by-Year Depreciation Breakdown
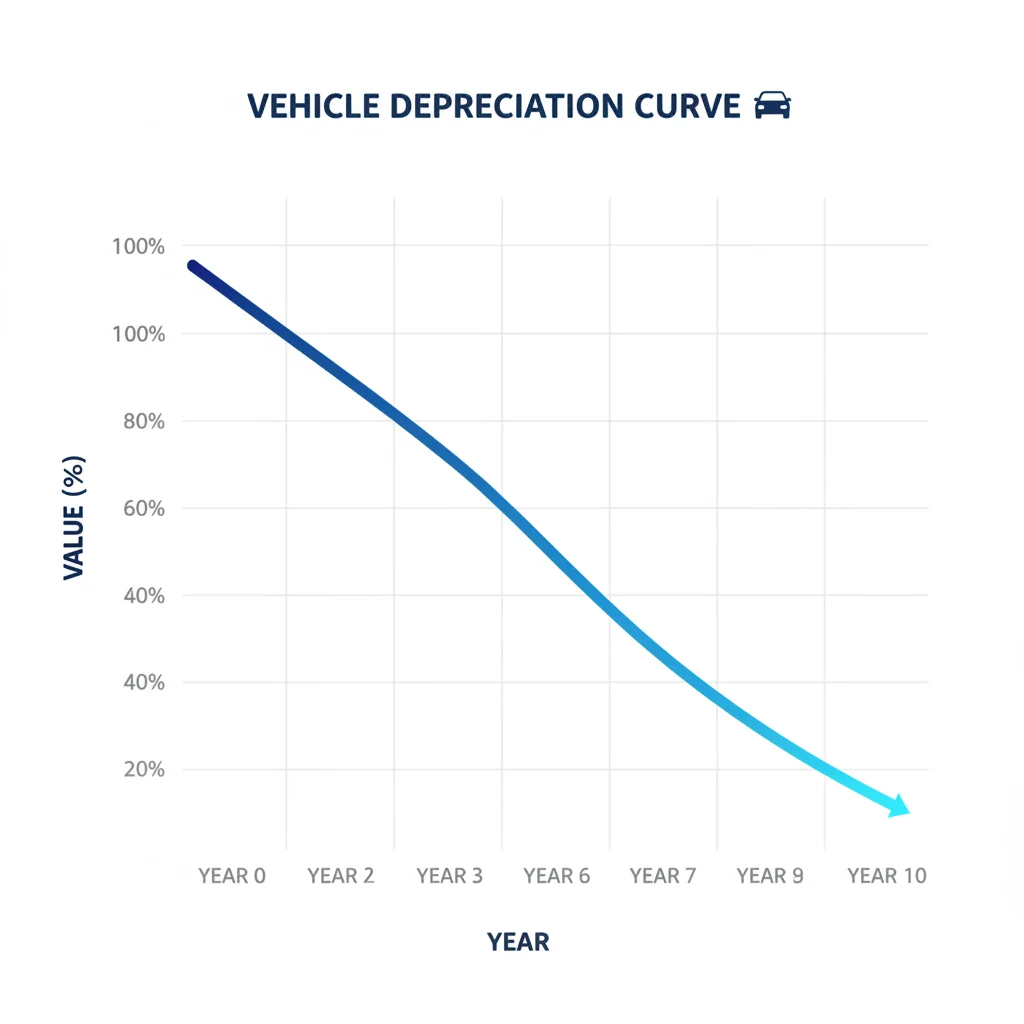
The table below shows how a vehicle with a $35,000 MSRP depreciates over ten years using average industry rates. Use it as a reference benchmark — not a guarantee — for your specific vehicle.
| Year | Cumulative Value Lost (%) | Approx. Remaining Value | Annual Drop (% of original) |
|---|---|---|---|
| New (Day 1) | ~9–11% | ~$31,500 | Loss occurs the moment you drive off the lot |
| Year 1 | ~20% | ~$28,000 | ~9–11% additional in first 12 months |
| Year 2 | ~30% | ~$24,500 | ~10% |
| Year 3 | ~38–40% | ~$21,000 | ~8–10% |
| Year 4 | ~45–47% | ~$18,500 | ~6–8% |
| Year 5 | ~50–55% | ~$15,750 | ~5–7% |
| Year 6 | ~57–60% | ~$14,000 | ~4–6% |
| Year 7 | ~62–65% | ~$12,250 | ~3–5% |
| Year 8 | ~67–70% | ~$10,500 | ~3–5% |
| Year 9 | ~72–74% | ~$9,100 | ~2–4% |
| Year 10 | ~75–80% | ~$7,000–8,000 | ~2–4% |
Figures based on average industry depreciation rates for mainstream sedans and SUVs. Luxury, sports, and specialty vehicles can depreciate significantly faster or slower. Source data aggregated from NADA, Edmunds, and iSeeCars multi-year depreciation studies.
For more detail on what this curve looks like in dollar terms across the first five years specifically, see how steeply new cars lose value in years one through five.
20%
Average value lost in year one
According to iSeeCars' 2023 depreciation analysis of over 8 million vehicle transactions.
~$3,500
Average dollar loss in year one on a $35K car
Based on the industry-average 20% first-year depreciation applied to a $35,000 MSRP vehicle.
50%+
Cumulative value lost by year five
Edmunds True Cost to Own data shows most mainstream vehicles lose over half their value within five years.
2–4%
Annual depreciation rate in years 7–10
The plateau phase — most of the damage is done; the car loses value slowly and steadily after year six.
9–11%
Value lost the moment you drive off the lot
Reflects the gap between new-car MSRP and immediate used-car market value once the vehicle is titled.
The Four Depreciation Phases You Need to Know
Phase 1: The Drive-Off Cliff (Day One to Month 12)
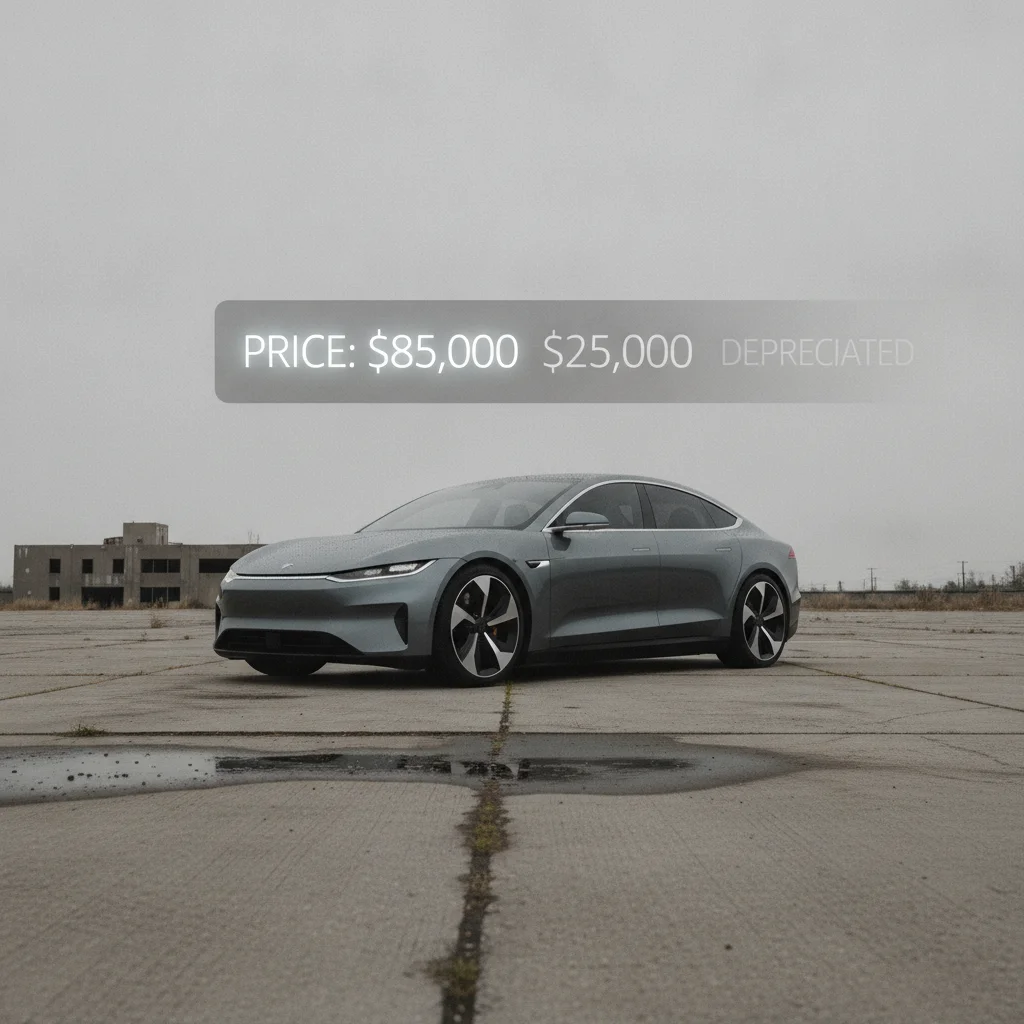
The moment a new vehicle is titled in your name, it's no longer new — and the market prices it accordingly. That administrative reality strips away roughly 9–11% of MSRP instantly. Add twelve months of ownership and you're typically looking at a 20% loss from sticker. On a $40,000 vehicle, that's $8,000 gone before you've needed your first oil change anniversary.
This phase is the most painful for new-car buyers and the most profitable entry point for used-car buyers. A one-year-old vehicle with 12,000–15,000 miles on it often delivers nearly identical ownership experience to a new one, at significantly lower cost.

Phase 2: The Steep Slide (Years 2–3)
Years two and three continue the aggressive clip — roughly 8–10% of original value per year. By the end of year three, the average car has shed 38–40% of its original price. The vehicle is still relatively new, but it's now clearly a used car in the eyes of lenders, insurers, and buyers.
For owners who financed at a normal term, this is the period of greatest underwater-loan risk. If you put little money down on a 60- or 72-month loan, the depreciation in years one through three often outpaces your payoff — meaning you owe more than the car is worth.
Phase 3: The Stabilization Zone (Years 4–6)
Something notable happens around year four: the annual drop slows to 5–7% of original MSRP. The vehicle has already absorbed the steepest price corrections. Mechanical reliability data starts to differentiate brands more sharply here — a Toyota Camry and a comparable domestic sedan might track similarly through year three, then diverge as buyer confidence in long-term reliability shifts demand.
This is often the sweet spot for used-car buyers. Enough depreciation has occurred to make the price compelling, but the vehicle typically still has many reliable miles ahead of it. Certified pre-owned programs frequently target this range for exactly that reason.
Phase 4: The Long Plateau (Years 7–10)
By year seven, most of the value destruction has already happened. Annual depreciation slows to 2–5% of original MSRP, and the car's residual value starts to feel almost sticky. A $35,000 car might drop only $1,000–$1,500 per year in this phase.
This phase rewards patient long-term owners. If you've maintained the car well and avoided major mechanical issues, the cost-per-mile of ownership in years seven through ten is often the lowest of the car's life — you're no longer absorbing heavy depreciation, and if you bought wisely, the car is paid off. For a complete picture of the full lifetime curve, see how a car's value drops from the first-year cliff to the slow plateau after a decade.
Depreciation
The reduction in a vehicle's market value over time due to age, mileage, wear, and shifting demand. It's the single largest cost of car ownership for most people.
Residual value
The estimated or actual market value of a vehicle at a specific point in time — often expressed as a percentage of original MSRP. Leasing companies use projected residual values to calculate monthly payments.
Drive-off depreciation
The instant value loss that occurs the moment a new car is titled and driven off the lot. Typically 9–11% of MSRP, reflecting the price gap between new and used market pricing.
Depreciation curve
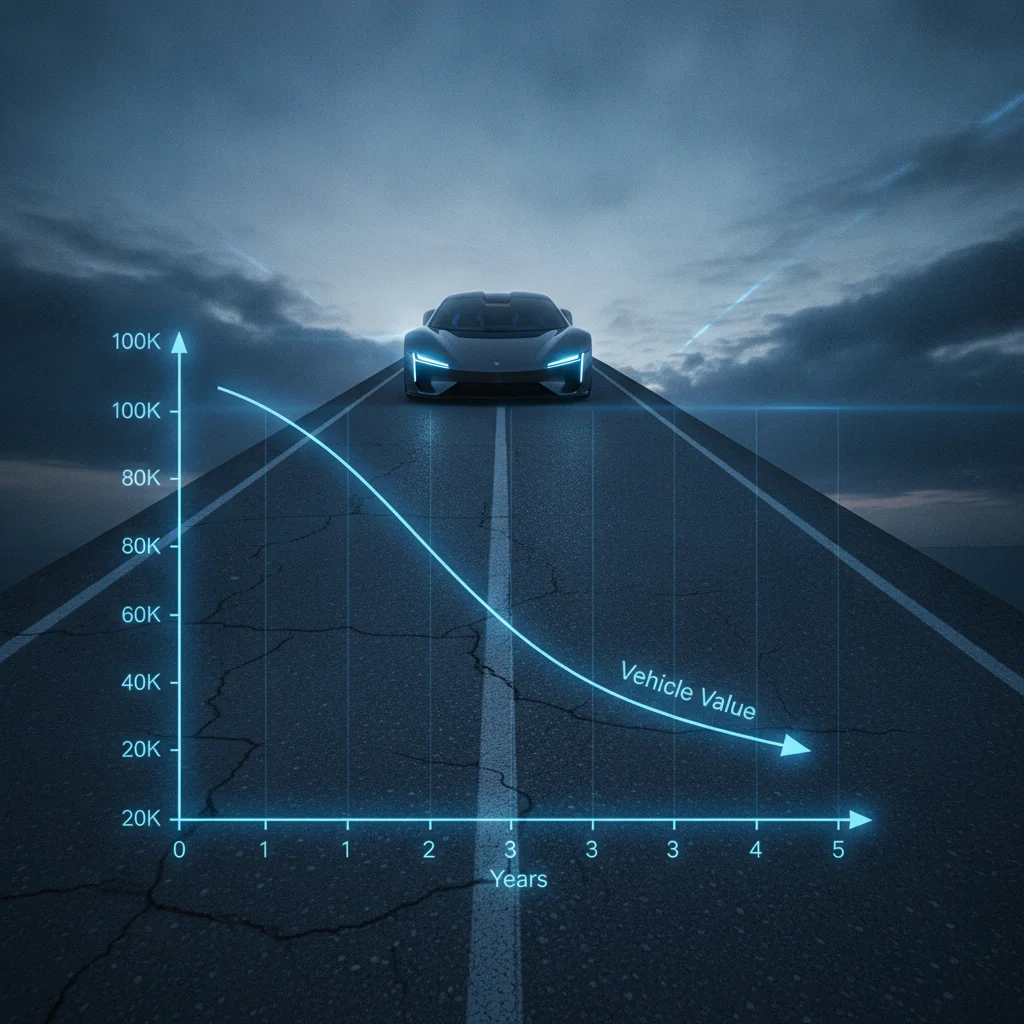
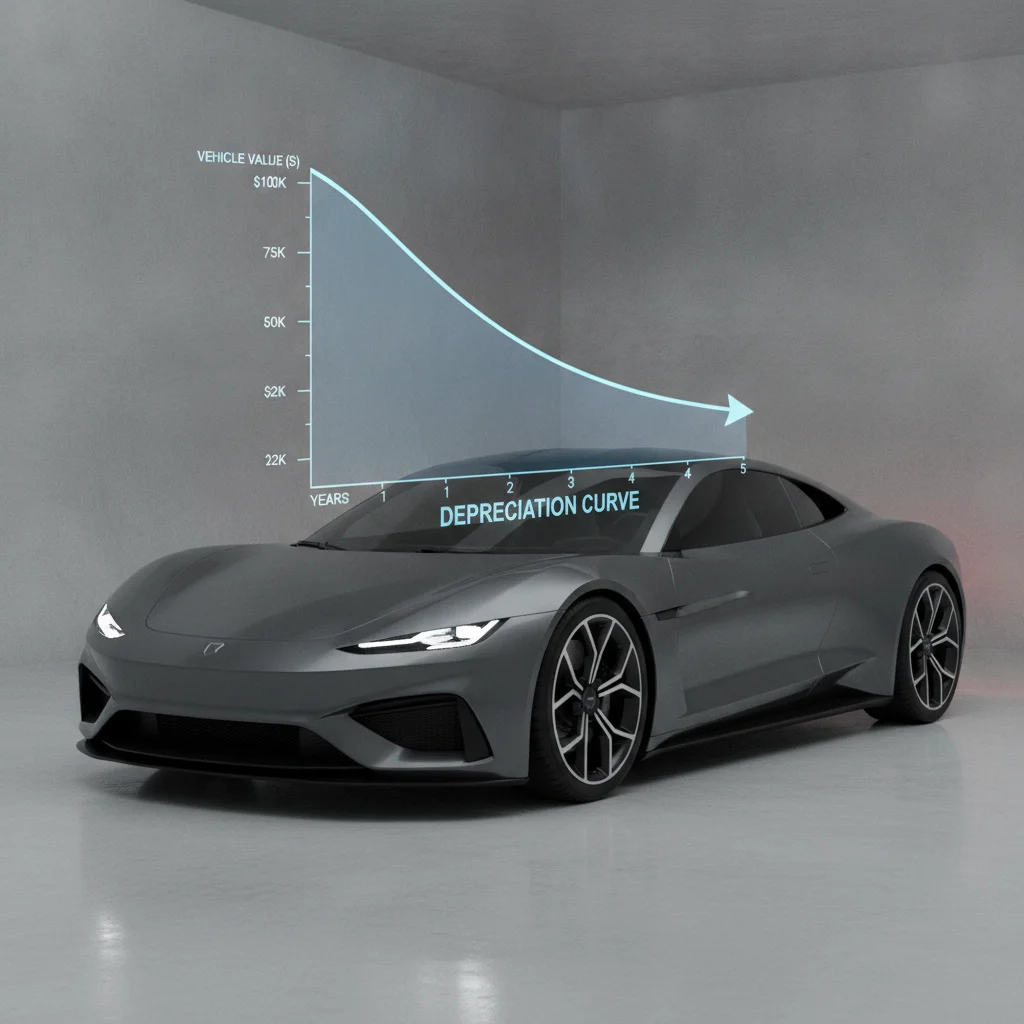
The graphical representation of how a vehicle's value decreases over time. The curve is steep in the first few years and flattens significantly after year five or six.
Underwater on a loan
When you owe more on your auto loan than the vehicle is currently worth. Common in years one through three due to rapid early depreciation outpacing loan payoff.
True Cost to Own (TCO)
A calculation that accounts for all ownership costs over a set period — including depreciation, insurance, fuel, maintenance, and financing — rather than just the purchase price.
Certified Pre-Owned (CPO)
A manufacturer-backed used vehicle program that includes inspection, refurbishment, and extended warranty coverage. CPO vehicles typically fall in the two- to six-year age range.
MSRP
Manufacturer's Suggested Retail Price — the sticker price on a new vehicle before negotiations, incentives, or dealer markups. Depreciation is commonly expressed as a percentage of MSRP.
Key Selling Milestones and What They Mean for You
Knowing the curve matters most when you're deciding when to sell. Here are the milestones that matter most:
- Before 12 months: Rarely worth it unless you have a specific hardship reason. You've absorbed the worst of the drive-off loss but haven't gotten value from the car yet. You'll also likely still owe close to what it's worth — or more.
- At 2–3 years: You get a vehicle that still commands a decent used price but you've already absorbed significant losses. This window makes sense if you're trading into another vehicle and want to use remaining equity, or if the vehicle has had reliability issues.
- At 4–5 years / 50,000–60,000 miles: A common natural exit point. The vehicle is approaching or entering the range where first major maintenance milestones appear (timing belt, brakes, tires). Buyers know this, which adds subtle downward pressure. Selling just before or right at this mileage band can help you capture slightly better value.
- At 7–8 years: If the car has been well maintained, this is often where you can extract good remaining use while still getting a meaningful resale check — somewhere in the $8,000–$12,000 range for a mainstream vehicle. After this, residual values drop slowly but the effort of selling versus just running it to the end of its life becomes less financially meaningful.
- Beyond 10 years: At this point you're often better off holding the vehicle until a major repair makes it uneconomical. Private-party value is modest and dealer trade-in credit is minimal. The math shifts entirely toward cost-per-mile and avoiding repair bills, not residual value capture.
To run the actual numbers on your car's depreciation position right now, use the practical depreciation walkthrough to figure out exactly how much value you've lost and what your total ownership cost looks like.
When you're ready to check a real market value at any of these milestones, valuation tools like KBB and Edmunds can anchor you in the current market rather than averages.
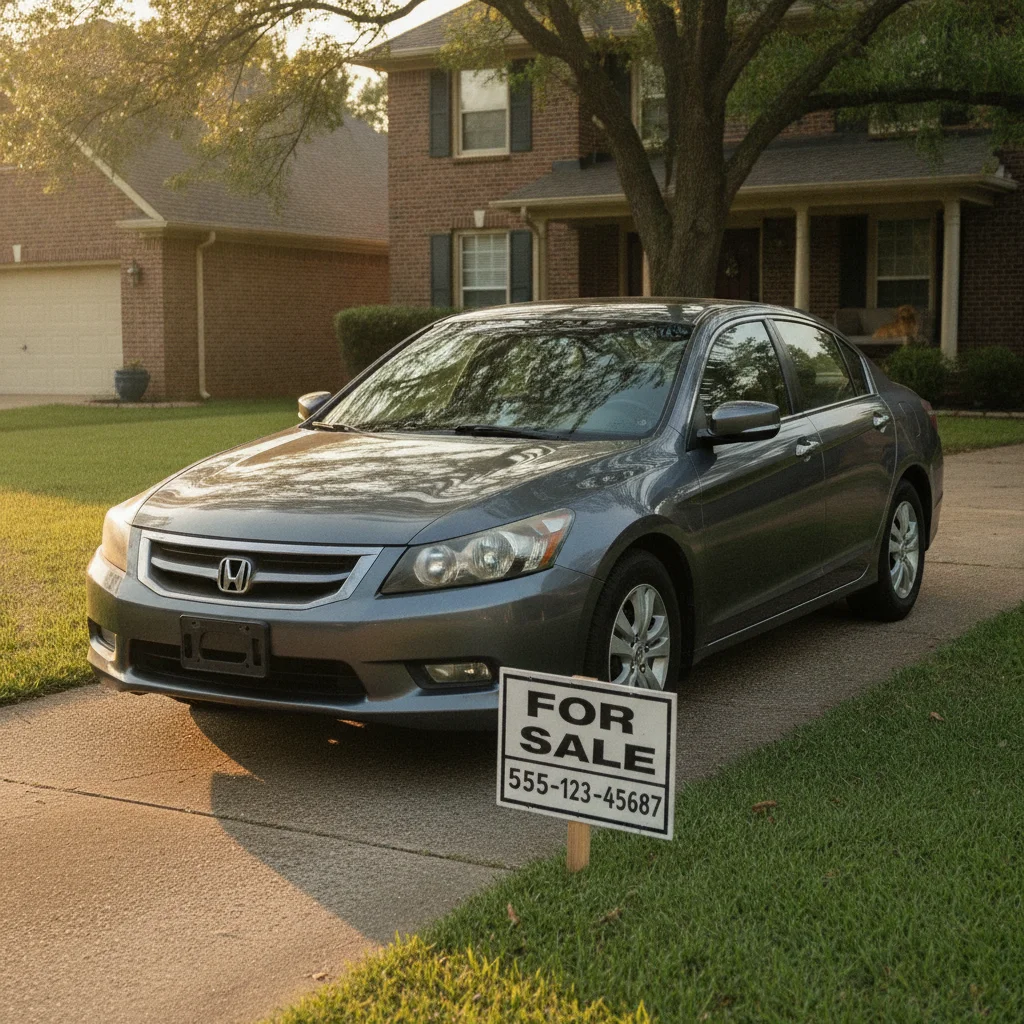
One more angle worth considering: data-backed benchmarks sellers can actually use can sharpen your timing if you're actively planning a sale. And for broad context on how age, mileage, and condition interact to drive value down, the Depreciation Basics hub is a solid starting point.
Kelley Blue Book (KBB)
KBB lets you look up real-time market values for your specific vehicle based on year, make, model, trim, mileage, and condition. Essential for checking where you sit on the depreciation curve right now.
Edmunds True Cost to Own Calculator
Edmunds' TCO tool projects five-year ownership costs including depreciation, insurance, fuel, and maintenance — giving you a full financial picture beyond just the sticker price.
iSeeCars Depreciation Rankings
iSeeCars publishes annual rankings of the fastest and slowest depreciating vehicles across all segments, backed by millions of transaction records. Useful for benchmarking your vehicle against others.
NADA Guides
NADA provides dealer-oriented vehicle valuation data that lenders and dealerships use internally. Helpful for understanding what trade-in offers are actually based on.
Vehicle Depreciation: The Complete Owner's Reference
A comprehensive reference covering depreciation formulas, segment-by-segment rates, key influencing factors, and terminology — everything in one place for deeper understanding.

All claims are backed by peer-reviewed research. Sources on request.