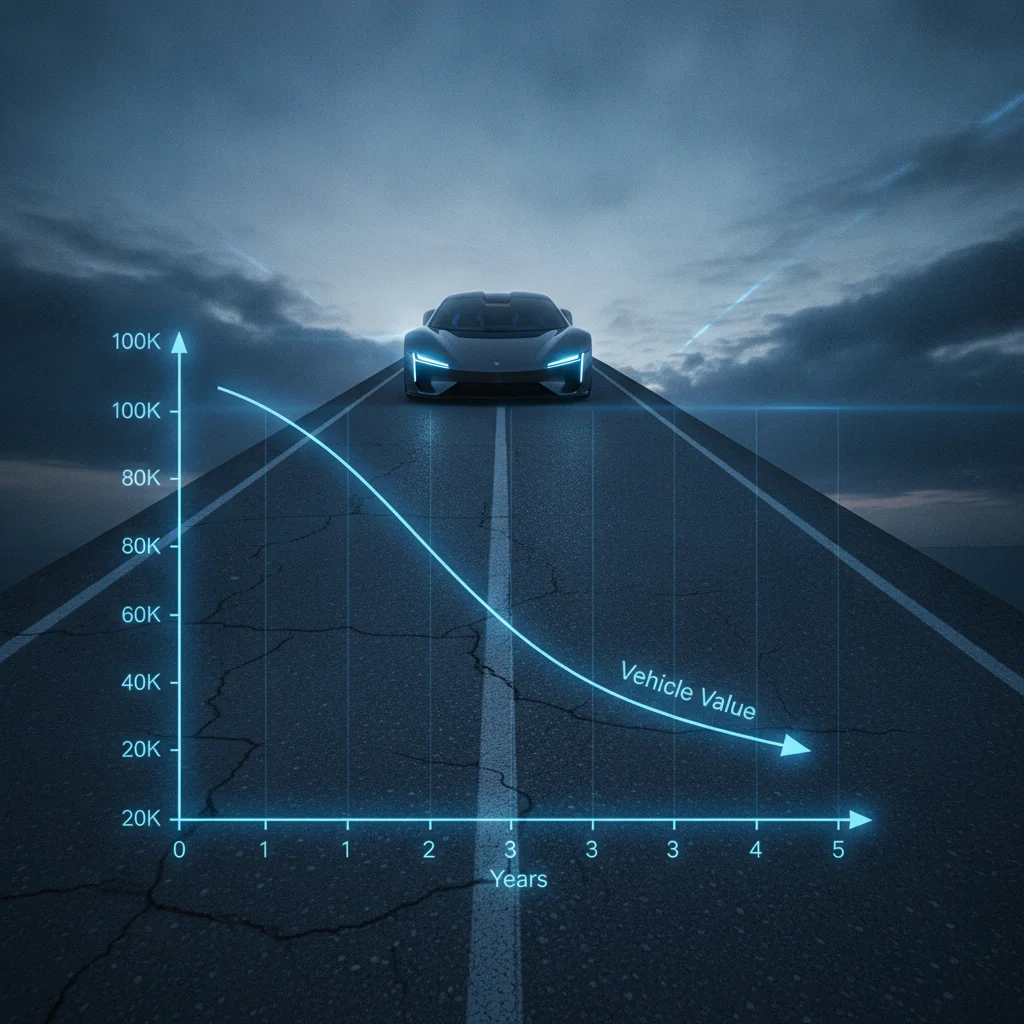

Key Takeaways
If you're approaching the three-year mark and your vehicle is in excellent condition, seriously consider listing it now rather than waiting. The percentage-point loss from year three to year four is smaller in absolute terms, but for a $25,000 vehicle it still represents $2,000–$3,000 you won't recover.
The first three years are when most depreciation dollars are lost, making late year two to early year three the sweet spot for maximizing return on a well-maintained vehicle.
Pull your free AutoCheck or CARFAX report before listing — not after a buyer requests it. Surprises buried in a history report will cost you negotiating leverage when a buyer discovers them mid-deal.
Sellers who know their vehicle's history in advance can price accordingly and control the narrative, rather than reacting defensively to buyer objections at the closing table.
Don't assume a dealer's trade-in offer reflects your car's actual market value. Dealers typically offer 15–20% below private-sale market value because they need margin to recondition and resell. Get a private-sale estimate from at least two valuation tools before walking into a dealership.
Understanding the wholesale-to-retail gap prevents sellers from accepting trade-in offers that undervalue their vehicle, and gives them a credible counter-offer benchmark.
What Depreciation Actually Means for Sellers
Depreciation is simply the difference between what you paid for a vehicle and what the market will pay for it today. It's not a fee, it's not a penalty — it's an economic reality baked into every car transaction. For sellers, understanding it isn't optional; it's the foundation of every pricing decision you'll make.
Think of it this way: if you bought a $35,000 sedan three years ago, depreciation tells you that the market probably values it somewhere between $18,000 and $23,000 right now — not because anything went wrong, but because that's how vehicle markets work. Ignoring that math leads to overpriced listings that sit unsold for months.
For a foundational look at how depreciation is defined and calculated, the complete owner's introduction to vehicle depreciation covers the core concepts in detail. And if you want a single reference with key rates, formulas, and segment breakdowns, the Vehicle Depreciation: The Complete Owner's Reference is worth bookmarking.
This guide focuses specifically on the timeline of depreciation — what happens in year one versus year five versus year ten — so you can set realistic expectations no matter when you decide to sell.
The Day-One Drop: Drive-Off-the-Lot Depreciation
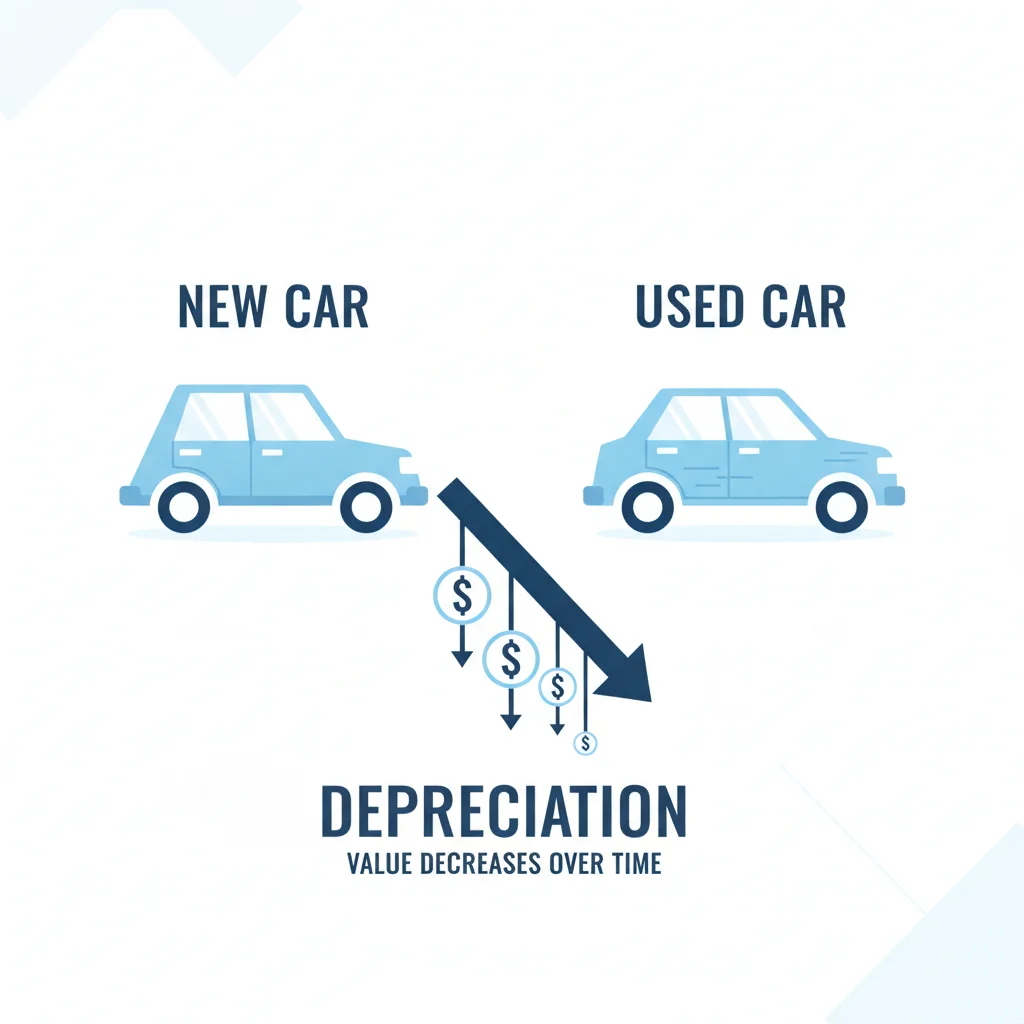
The most dramatic moment in a car's value life happens before you've put 100 miles on the odometer. The instant a new vehicle is registered to a buyer, it transitions from new to used in the eyes of the market. That single status change is worth roughly 10–15% of the purchase price — on a $40,000 vehicle, that's up to $6,000 gone before you've reached the first stoplight.
Why does this happen? Two reasons: First, a buyer can no longer get manufacturer incentives, low-rate financing, or new-car warranties at the same terms as the original purchaser. Second, the supply of nearly-new cars competes directly with brand-new inventory, so dealers and private sellers must price below MSRP to attract buyers who could simply walk into a showroom.
The Registration Effect in Numbers
Here's a concrete illustration. Suppose a compact SUV has an MSRP of $32,000. With destination charges and dealer fees, the out-the-door price is $34,500. If the original owner tries to sell after just 30 days and 500 miles, market data consistently shows they can expect $28,500–$30,000 from a private buyer — a loss of $4,500–$6,000 on a month-old car.
15–20%
Value lost the moment you drive off the lot
Industry transaction data from iSeeCars and CarEdge show new vehicles lose 15–20% of MSRP within the first few weeks of ownership.
~49%
Average value remaining after five years
According to iSeeCars' annual depreciation study, the average vehicle retains roughly 49% of its original value at the five-year mark.
60–70%
Three-year value retained by top pickup trucks
Toyota Tacoma and select full-size trucks consistently post 60–70% retained value at three years, per Kelley Blue Book residual data.
$3,000–$5,000
Price gap between high- and low-mileage same-year models
CarGurus listing data shows this typical spread between equivalent year/trim vehicles differentiated only by mileage in the 45k–80k range.
10–20%
Value penalty for accident history on CARFAX
A 2023 analysis by CarFax found that a single reported moderate collision reduces dealer and private-sale offers by 10–20% on average.
This is why financial advisors so often suggest buying a vehicle that's 12–18 months old rather than brand new. Someone else has absorbed the registration-effect loss, and you step in at a materially lower price point.
The Day-One Loss Is Permanent
Once a vehicle is registered, it cannot return to 'new' status regardless of how little it's driven or how well it's maintained. A 200-mile car listed six months after purchase is still a used car in every market and every lender's eyes. Sellers who purchased recently and need to sell quickly should expect to price 10–20% below their purchase price to attract buyers — this is not negotiable, it's structural.
Negative Equity Is a Real Risk in Years One Through Four
If you financed your vehicle with less than 20% down on a loan of 60 months or longer, there is a statistically high probability you owe more than the car is worth for the first two to four years of ownership. Before listing your vehicle, calculate your exact loan payoff balance and compare it to current market value using at least two valuation tools. Selling while underwater without a plan to cover the gap can disrupt your next purchase.
Year One to Year Three: The Steepest Slope
The first three years of ownership represent the most punishing phase of the depreciation curve. Industry data compiled from auction results and private sales shows the following average cumulative value loss from original MSRP:
| End of Year | Avg. Cumulative Value Loss | Remaining Value |
|---|---|---|
| Year 1 | 20–25% | 75–80% of MSRP |
| Year 2 | 30–35% | 65–70% of MSRP |
| Year 3 | 40–50% | 50–60% of MSRP |
These aren't worst-case numbers — they're typical. Luxury vehicles and certain domestic brands tend to fall faster; popular trucks, hybrids, and Japanese economy cars often beat these averages by 5–10 percentage points.
For sellers, year three is a pivotal moment. A car at this stage still has significant value — but every additional year of ownership yields progressively smaller absolute dollar losses because the base is lower. That said, mechanical reliability concerns start to become a real factor for buyers around years four and five, which affects negotiating leverage.
If you're approaching the three-year mark and your vehicle is in excellent condition, seriously consider listing it now rather than waiting. The percentage-point loss from year three to year four is smaller in absolute terms, but for a $25,000 vehicle it still represents $2,000–$3,000 you won't recover.
The first three years are when most depreciation dollars are lost, making late year two to early year three the sweet spot for maximizing return on a well-maintained vehicle.
Pull your free AutoCheck or CARFAX report before listing — not after a buyer requests it. Surprises buried in a history report will cost you negotiating leverage when a buyer discovers them mid-deal.
Sellers who know their vehicle's history in advance can price accordingly and control the narrative, rather than reacting defensively to buyer objections at the closing table.
Don't assume a dealer's trade-in offer reflects your car's actual market value. Dealers typically offer 15–20% below private-sale market value because they need margin to recondition and resell. Get a private-sale estimate from at least two valuation tools before walking into a dealership.
Understanding the wholesale-to-retail gap prevents sellers from accepting trade-in offers that undervalue their vehicle, and gives them a credible counter-offer benchmark.
If you financed with a small down payment and a 72-month loan, there's a meaningful risk of being underwater — owing more than the car is worth — through much of this period. Check your loan payoff balance against current market value before listing. The first five years depreciation breakdown explores this window in detail, including what the trajectory means for your selling timing.
Year Four to Year Six: The Middle Ground
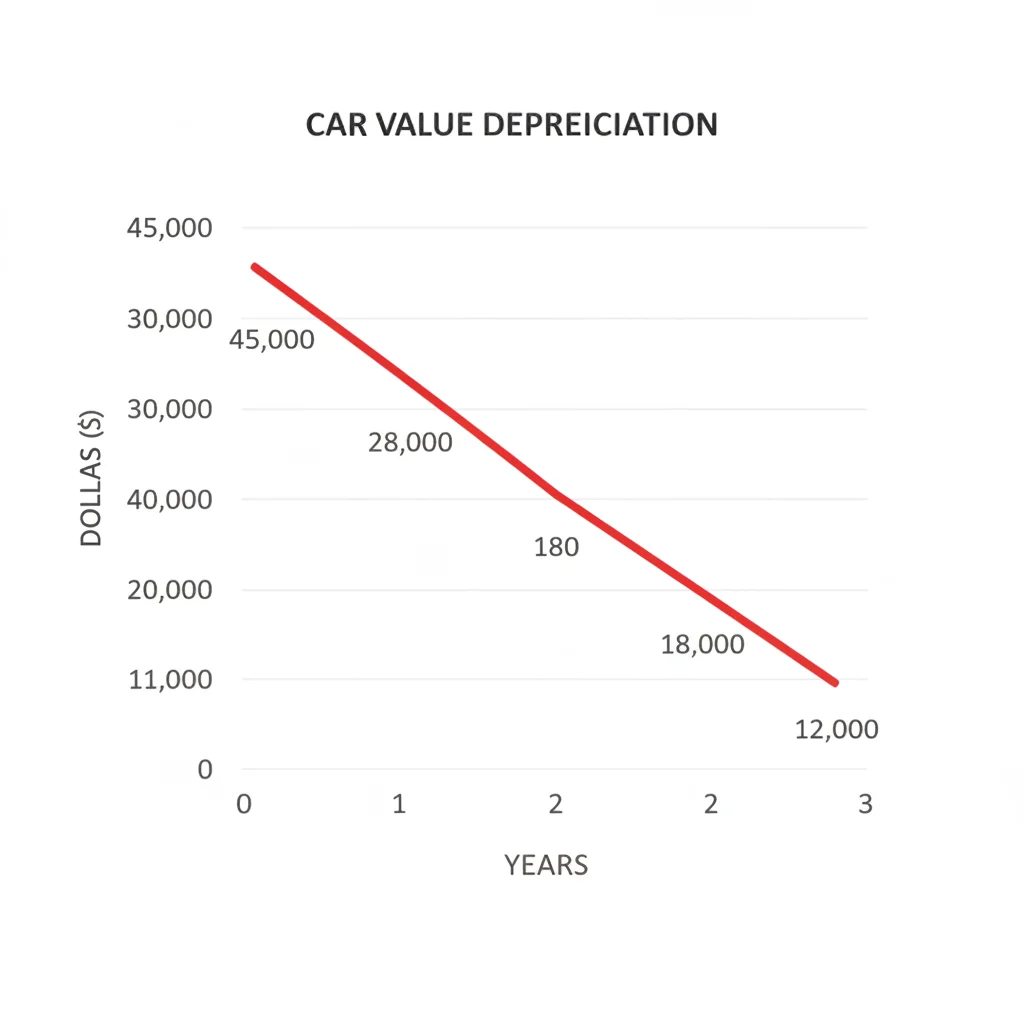
Between years four and six, depreciation enters what I think of as the middle ground: losses continue, but they're significantly less dramatic in percentage terms. A car that was worth 55% of MSRP at year three might be worth 40% at year six — that's a 15-percentage-point drop spread over three years, compared to the 40-point drop in the first three years alone.
| End of Year | Avg. Cumulative Value Loss | Remaining Value |
|---|---|---|
| Year 4 | 50–55% | 45–50% of MSRP |
| Year 5 | 55–60% | 40–45% of MSRP |
| Year 6 | 60–65% | 35–40% of MSRP |
In this window, condition and mileage start to exert outsized influence on pricing. Two identical 2019 crossovers — same trim, same color — can command a $3,000–$5,000 price difference based purely on mileage variance (say, 45,000 versus 80,000 miles) and service record quality.
Document Every Service Visit Before Selling
Buyers at the four-to-six-year mark are acutely aware that they're inheriting a vehicle's maintenance history. A folder of oil change receipts, brake records, and inspection reports adds immediate credibility and often commands $500–$1,500 in additional offer price from informed buyers. Digital records stored in an app like Carfax's MyCarfax or simply photographed in a Google Drive folder work just as well as paper.
Use a Pricing Range, Not a Single Number
Set your asking price at the top of your fair-market range and communicate to buyers that you're open to reasonable offers. This preserves negotiation room while signaling flexibility, which tends to generate more serious inquiries than a rigid 'firm' price at the midpoint. Most private buyers expect to negotiate 3–7% off the asking price.
Check Multiple Valuation Sources Before Setting Your Price
Kelley Blue Book and Edmunds often produce estimates that differ by $1,000–$3,000 on the same vehicle because they use different data inputs. Cross-reference both, then check recent sold listings on CarGurus and Autotrader to see what buyers are actually paying — not just what sellers are asking. The sold-listing data is the most reliable signal of true market value.
Certified Pre-Owned (CPO) vehicles are most commonly sourced from this age range. Manufacturer CPO programs typically cover vehicles up to 5–6 years old with fewer than 80,000 miles. If your vehicle qualifies, listing it through a franchised dealer as CPO can recover some value that private-sale depreciation would otherwise erase — though the dealer will offer wholesale pricing, not retail.
Sellers in this window should also be aware that the used-car market is most liquid here. There are more buyers searching for 4-to-6-year-old vehicles than any other segment, which means properly priced inventory moves quickly.
Year Seven to Year Ten: The Plateau
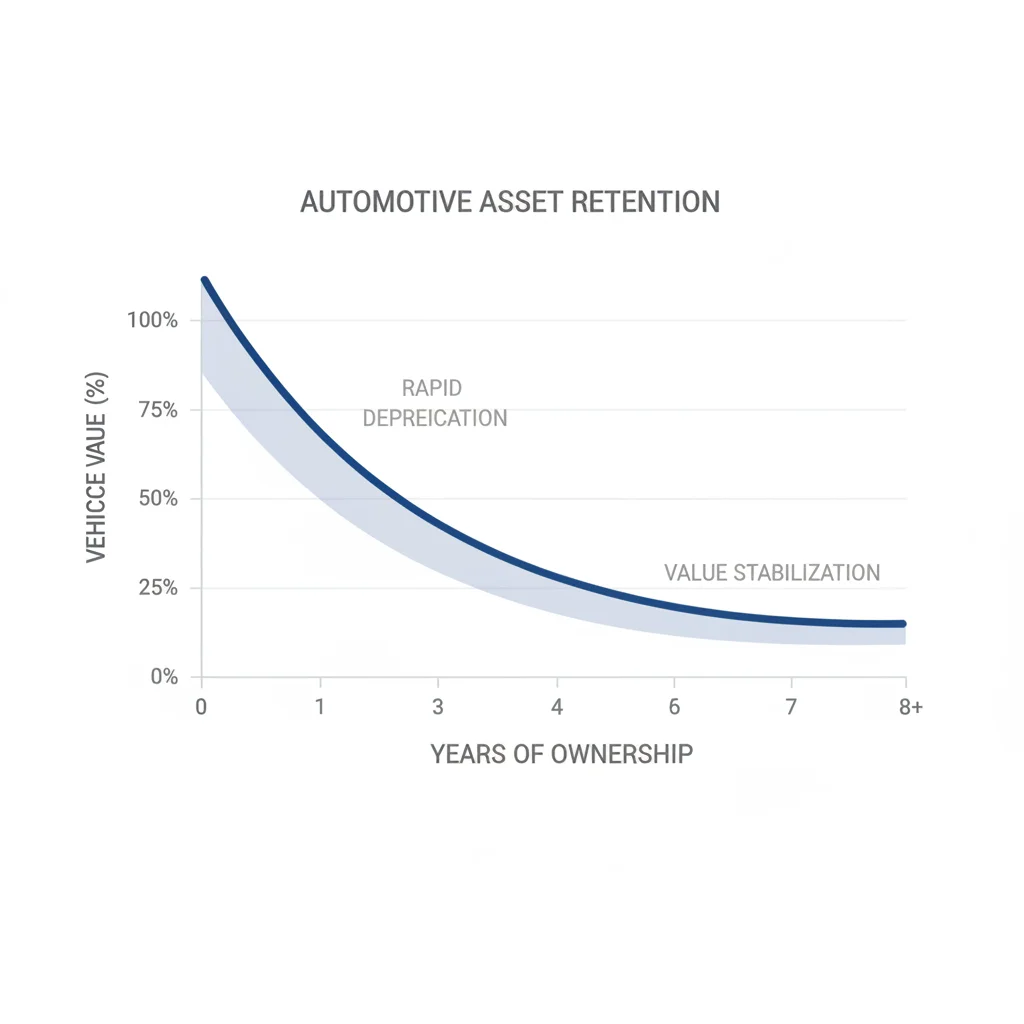
By year seven, a car has absorbed most of the depreciation it will ever experience. The remaining value loss is slow, sometimes almost negligible in dollar terms. A vehicle worth $12,000 at year seven might be worth $8,000–$9,000 at year ten — a $3,000–$4,000 drop over three years, compared to the $15,000+ drop in years one through three.
| End of Year | Avg. Cumulative Value Loss | Remaining Value |
|---|---|---|
| Year 7 | 65–70% | 30–35% of MSRP |
| Year 8 | 70–75% | 25–30% of MSRP |
| Year 9 | 73–78% | 22–27% of MSRP |
| Year 10 | 75–80% | 20–25% of MSRP |
Here's the important nuance for sellers: the plateau doesn't mean value is stable. It means the rate of loss has slowed. But absolute values at this stage are low enough that even a 5% swing represents only a few hundred dollars — not thousands. The bigger pricing factors become mechanical condition, accident history, and market scarcity of that specific model.
Some vehicles actually appreciate slightly in this window if they become culturally desirable — think late-2000s sports cars or niche trims that have gained enthusiast followings. This is the exception, not the rule, but it's worth researching if you have an unusual vehicle.
Collector and Enthusiast Markets Play by Different Rules
The depreciation benchmarks in this guide apply to mainstream passenger vehicles. Collector cars, limited-edition sports models, and vehicles with strong enthusiast communities can deviate dramatically from average curves — sometimes appreciating over time. If you own an unusual or low-production vehicle, consult specialty auction results and enthusiast-community pricing rather than standard valuation tools.
Electric Vehicle Depreciation Is Evolving Rapidly
EVs from early model years (2018–2021 in particular) have shown steeper-than-average depreciation due to rapid battery technology advances and expanding new-car inventory at lower price points. The depreciation benchmarks in this guide are primarily calibrated to internal combustion vehicles. EV sellers should research model-specific resale data carefully, as the market is moving faster than historical averages can capture.
For a full visual picture of how the curve flattens decade, see the depreciation curve across a car's lifetime — it maps the entire arc from new to ten-plus years in one place.
Which Cars Depreciate Fastest — and Which Hold Value Best
Not all vehicles follow the same curve. Brand reputation, segment demand, production volume, and fuel economy all influence how quickly or slowly a specific model loses value. Here's a breakdown of the general landscape:
Fastest Depreciators
- Luxury sedans — High MSRPs combined with expensive maintenance reputations push buyers toward near-new certified alternatives. Models from certain German luxury brands can lose 50% of value in two years.
- Full-size domestic sedans — As the market has shifted to trucks and SUVs, demand for large American sedans has fallen, accelerating their depreciation.
- Electric vehicles from early model years — Rapid technology advancement means a three-year-old EV may feel significantly outdated compared to current models, compressing resale value.
Slowest Depreciators (Best Value Retention)
- Full-size pickup trucks — Toyota Tacoma, Toyota Tundra, and domestic half-tons consistently retain 60–70% of value at three years due to persistent high demand and supply constraints.
- Japanese economy cars — Honda Civic, Toyota Corolla, and their crossover counterparts (CR-V, RAV4) retain value well due to low cost of ownership and massive buyer demand.
- Hybrid vehicles — Rising fuel costs have increased demand for hybrids, improving their resale performance across most segments.
“Resale value isn't just about brand — it's about whether buyers trust that the cost of ownership going forward will be manageable. That's why reliability reputation and parts availability matter as much as the original purchase price.”
— Eric Ibara, Director of Residual Value Consulting, Kelley Blue Book
A Note on Production Volume
High-volume models generally hold value better than niche ones because the used-car buyer pool is proportionally larger. A Toyota RAV4 has millions of potential buyers nationwide; a niche European wagon has a fraction of that audience, which depresses bids at every price point.
Factors That Accelerate or Slow Depreciation
Understanding the average depreciation curve is useful, but your specific vehicle will deviate from that average based on several measurable factors. Here are the most impactful ones:
Mileage
The rule of thumb is roughly 15,000 miles per year for an average driver. Every 10,000 miles above that threshold typically reduces value by $500–$1,500 depending on vehicle segment. A 60,000-mile car at year three will appraise significantly lower than a 30,000-mile example of the same model.
Accident and Title History
A CARFAX or AutoCheck report showing one moderate collision can reduce market value by 10–20% compared to a clean-history equivalent. Structural damage — even repaired — devalues a vehicle even more steeply because liability-conscious buyers and dealers discount it heavily.
Color
Neutral colors (white, silver, black, gray) retain value better than polarizing colors. An uncommon shade can cost you 3–5% at resale because it narrows the buyer pool.
Trim Level
Base trims and fully loaded top trims can depreciate faster than mid-range trims. Base models may feel stripped relative to buyer expectations; top trims add cost that buyers won't always pay in the used market. The sweet spot is typically the second trim from the top.
Maintenance Records
A documented service history — oil changes, brake jobs, timing belt replacements — adds tangible credibility and commands higher offers, particularly from private buyers and independent dealers who understand mechanical risk.
Aftermarket Mods Rarely Pay Off at Resale
Lift kits, aftermarket wheels, performance exhausts, and custom interiors rarely recover their installation cost at resale. In many cases, they actively reduce value because they narrow the buyer pool to enthusiasts and raise questions about how the vehicle was driven. If you're planning to sell within the next two years, hold off on modifications that can't be easily reversed.
Don't Over-Rely on a Single Valuation Tool
Pricing your vehicle based solely on KBB's 'Instant Cash Offer' or a single Edmunds estimate can mislead you in either direction. Tools are trained on historical data and regional averages that may not reflect your specific local market. Always verify with live sold-listing data before finalizing your price.
If you're approaching the three-year mark and your vehicle is in excellent condition, seriously consider listing it now rather than waiting. The percentage-point loss from year three to year four is smaller in absolute terms, but for a $25,000 vehicle it still represents $2,000–$3,000 you won't recover.
The first three years are when most depreciation dollars are lost, making late year two to early year three the sweet spot for maximizing return on a well-maintained vehicle.
Pull your free AutoCheck or CARFAX report before listing — not after a buyer requests it. Surprises buried in a history report will cost you negotiating leverage when a buyer discovers them mid-deal.
Sellers who know their vehicle's history in advance can price accordingly and control the narrative, rather than reacting defensively to buyer objections at the closing table.
Don't assume a dealer's trade-in offer reflects your car's actual market value. Dealers typically offer 15–20% below private-sale market value because they need margin to recondition and resell. Get a private-sale estimate from at least two valuation tools before walking into a dealership.
Understanding the wholesale-to-retail gap prevents sellers from accepting trade-in offers that undervalue their vehicle, and gives them a credible counter-offer benchmark.
How to Use Depreciation Data to Price Your Car
Armed with the depreciation benchmarks above, here's a step-by-step framework for pricing your vehicle accurately:
- Start with your original purchase price. If you paid $38,000 out the door, that's your baseline.
- Apply the expected cumulative depreciation for your vehicle's age. If you're at year four, the average range is 50–55% cumulative loss, meaning a rough value of $17,100–$19,000.
- Adjust for your mileage. If you're 15,000 miles above the average for your car's age, subtract an additional $1,000–$2,000.
- Adjust for condition. Clean interior, no dings, fresh tires? Add 5%. Multiple cosmetic issues or high wear? Subtract 5–10%.
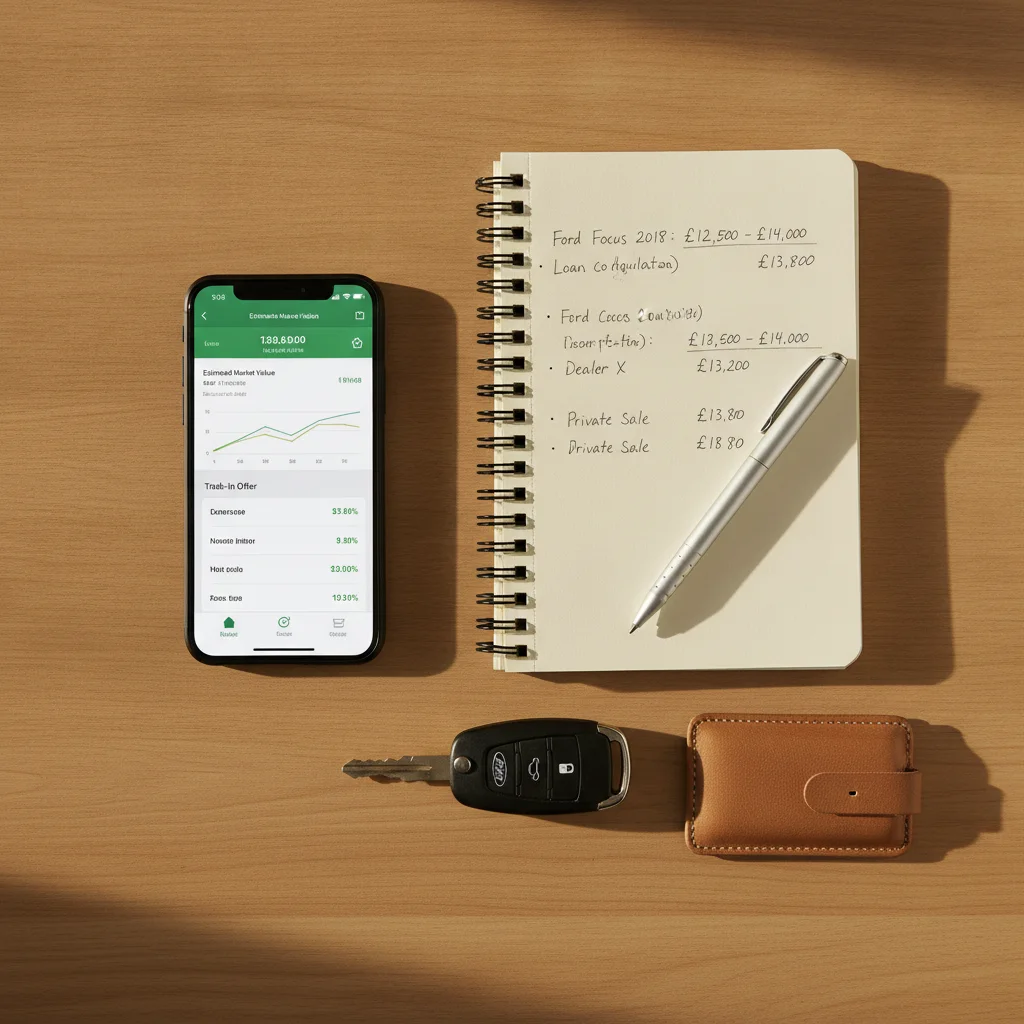
- Verify against market tools. Run the VIN through Kelley Blue Book and Edmunds to see where their algorithms price the vehicle. Treat the range between the two as your fair-market window.
- Set your asking price at the top of that window for private sale. Negotiation room is expected; pricing at the ceiling gives you flexibility without starting unrealistically high.
The valuation tools hub explains how KBB, Edmunds, and other platforms calculate their estimates — useful context when their numbers diverge from your expectations.
Also consider the year-by-year depreciation breakdown as a cross-reference for your specific ownership milestone.
Document Every Service Visit Before Selling
Buyers at the four-to-six-year mark are acutely aware that they're inheriting a vehicle's maintenance history. A folder of oil change receipts, brake records, and inspection reports adds immediate credibility and often commands $500–$1,500 in additional offer price from informed buyers. Digital records stored in an app like Carfax's MyCarfax or simply photographed in a Google Drive folder work just as well as paper.
Use a Pricing Range, Not a Single Number
Set your asking price at the top of your fair-market range and communicate to buyers that you're open to reasonable offers. This preserves negotiation room while signaling flexibility, which tends to generate more serious inquiries than a rigid 'firm' price at the midpoint. Most private buyers expect to negotiate 3–7% off the asking price.
Check Multiple Valuation Sources Before Setting Your Price
Kelley Blue Book and Edmunds often produce estimates that differ by $1,000–$3,000 on the same vehicle because they use different data inputs. Cross-reference both, then check recent sold listings on CarGurus and Autotrader to see what buyers are actually paying — not just what sellers are asking. The sold-listing data is the most reliable signal of true market value.
Common Seller Mistakes Around Depreciation
Even sellers who know depreciation exists frequently make predictable mistakes that cost them time or money. Here are the most common ones and how to avoid them:
Mistake 1: Anchoring to What You Paid
The most universal error. What you paid is irrelevant to what today's buyer will offer. Markets don't care about your sunk cost. Price based on current market data, not purchase history.
Mistake 2: Assuming Improvements Add Full Value
A $2,000 stereo upgrade rarely adds $2,000 to resale value. Aftermarket modifications frequently add nothing — and sometimes subtract value because they signal unknown risk to conservative buyers. The exception is practical upgrades like new tires or a recent brake job, which improve buyer confidence.
Mistake 3: Listing Before Checking Loan Payoff
If you're selling a financed vehicle, verify your payoff balance before listing. If you owe $22,000 and the car is worth $19,000, you're underwater and need a plan to cover the gap — either from savings or by rolling it into a new loan, which has its own consequences.
Mistake 4: Ignoring Seasonal Demand
Convertibles sell for more in spring; 4WD SUVs and trucks command premiums heading into winter. Listing at the right time in the demand cycle can recover 3–8% that off-season sellers leave on the table.
Mistake 5: Using Only One Valuation Source
KBB and Edmunds use different methodologies and sometimes produce estimates that differ by $1,000–$3,000 on the same vehicle. Cross-reference both, check recent sold listings on CarGurus or Autotrader, and use the range to inform your price — not a single number.
Aftermarket Mods Rarely Pay Off at Resale
Lift kits, aftermarket wheels, performance exhausts, and custom interiors rarely recover their installation cost at resale. In many cases, they actively reduce value because they narrow the buyer pool to enthusiasts and raise questions about how the vehicle was driven. If you're planning to sell within the next two years, hold off on modifications that can't be easily reversed.
Don't Over-Rely on a Single Valuation Tool
Pricing your vehicle based solely on KBB's 'Instant Cash Offer' or a single Edmunds estimate can mislead you in either direction. Tools are trained on historical data and regional averages that may not reflect your specific local market. Always verify with live sold-listing data before finalizing your price.
Frequently Asked Questions
Does depreciation affect all cars the same way?
No. While the general curve — steep early, flattening later — applies broadly, the actual percentages vary significantly by brand, segment, mileage, condition, and market demand. Trucks and popular Japanese crossovers consistently beat average retention benchmarks, while luxury sedans and certain domestic models underperform them.
At what point has a car lost the most value?
The single biggest loss occurs at the moment of first registration — the day-one drop. After that, years one through three represent the steepest ongoing decline. By year six, most of the dramatic value loss is complete.
Does color really affect resale value?
Yes, measurably. iSeeCars and similar data platforms have documented that unpopular colors (yellow, orange, purple) depreciate 7–14% faster than neutral tones because they narrow the buyer pool. White, silver, and black consistently outperform the average.
Can a car appreciate in value?
A small subset of vehicles — particularly low-production sports cars, limited-edition models, and culturally significant vehicles — can appreciate. Classic and collector markets operate by different rules than the standard used-car market. For everyday vehicles, appreciation is extremely rare.
How does a salvage title affect depreciation?
A salvage or rebuilt title reduces a vehicle's market value by 20–40% compared to a clean-title equivalent, and many lenders won't finance salvage-title vehicles at all. This dramatically shrinks the buyer pool to cash-only purchasers, further compressing price.
Should I sell before or after a major repair?
Generally, completing necessary safety repairs (brakes, tires) before selling improves your price more than the repair cost. However, expensive mechanical work — like an engine rebuild — rarely recovers its full cost at sale. Disclose known issues and price accordingly rather than over-investing in a vehicle you're selling.
Kelley Blue Book (KBB)
The most widely recognized vehicle valuation platform in the US. Use KBB's private-party and dealer trade-in calculators to establish your fair-market price range before listing.
Edmunds True Market Value (TMV)
Edmunds TMV uses transaction data to show what buyers in your area are actually paying — a useful cross-check against KBB estimates that sometimes diverge by $1,000–$3,000.
iSeeCars Depreciation Calculator
iSeeCars publishes detailed depreciation studies by make and model. Their tool lets you see how your specific vehicle has depreciated compared to category averages, useful for setting realistic seller expectations.
CARFAX Vehicle History Report
Pull your own vehicle history report before listing to identify any accident reports, title issues, or odometer discrepancies that will affect your pricing and buyer negotiations.
CarGurus Sold Listings Search
CarGurus shows recent sold-listing price data for comparable vehicles in your area. This real-market evidence is often more current than KBB or Edmunds estimates for fast-moving segments.
Depreciation Basics Hub
Our own <a href="/maintenance-and-ownership/ownership-costs/depreciation-basics">depreciation basics resource hub</a> consolidates rate data, key terms, segment comparisons, and formulas in one authoritative reference for car owners.

All claims are backed by peer-reviewed research. Sources on request.