Key Takeaways
Why Calculating Depreciation Is Worth 20 Minutes of Your Time
Most people know their car loses value. Very few people know how much it's lost, how fast, or what that rate actually means for their finances. That gap is expensive. Depreciation is the largest single cost of owning a car for most drivers — typically accounting for more than fuel, insurance, or maintenance over a five-year ownership period.
If you've never run the numbers before, a complete owner's introduction to vehicle depreciation is a solid starting point for the concepts. This article is the hands-on companion: you'll do the actual math on your actual car and come out with a number you can use.
The calculation is straightforward — four core steps, plus two adjustment checks. You don't need a finance background. You need your purchase price, a current market value estimate, and a calculator.
What you will need
Kelley Blue Book (KBB.com)
Provides a current private-party and trade-in value for your specific vehicle based on year, mileage, and condition.
Edmunds True Market Value
Offers an independent market valuation that can be cross-checked against KBB for a more reliable estimate.
Calculator or spreadsheet
Used to run the depreciation percentage and annual cost formulas in Steps 3 and 4.
Original purchase documentation
Confirms the exact price you paid, including any dealer fees that are part of your true cost basis.
Step-by-Step: Calculate Your Car's Depreciation
Work through these steps in order. Each one builds on the last, and by the end you'll have your total depreciation in dollars, your depreciation percentage, your annual cost, and your per-mile cost.
Find your vehicle's original cost basis
Your cost basis is the number you start with — the total you actually paid for the car. This is not the sticker price unless you paid full MSRP with no negotiation. Pull your purchase contract and use the out-of-pocket purchase price before financing costs but including any documentation or dealer fees you paid at signing.
For example: If you negotiated a new sedan down to $28,500 and paid $400 in dealer fees, your cost basis is $28,900. If you bought used and paid $17,200 all-in, that's your number.
Why it matters: Using an inflated number (like full MSRP when you paid less) understates your real depreciation. Using your actual out-of-pocket cost gives you an honest picture of what the car has cost you to own.
Get your car's current market value
You need a realistic estimate of what your car would sell for today — not what you hope to get, and not the retail price a dealer charges for a similar car on their lot. The number you want is the private-party value: what a private buyer would pay a private seller in your local market.
Go to KBB.com or Edmunds and enter your exact year, make, model, trim level, mileage, and an honest condition rating. Run both tools if you can — average the two results for a more reliable figure. The valuation tools hub has a breakdown of how each platform calculates its estimates.
Example continued: Your $28,900 sedan is now 3 years old with 42,000 miles. KBB says $19,400 private-party; Edmunds says $19,800. You'll use $19,600 as your current value (the average).
Calculate total depreciation and the percentage lost
Now the math. Two simple formulas:
Total Dollar Depreciation:
Cost Basis − Current Market Value = Total $ Lost
Total Percentage Depreciation:
(Total $ Lost ÷ Cost Basis) × 100 = % of Value Lost
Using our example:
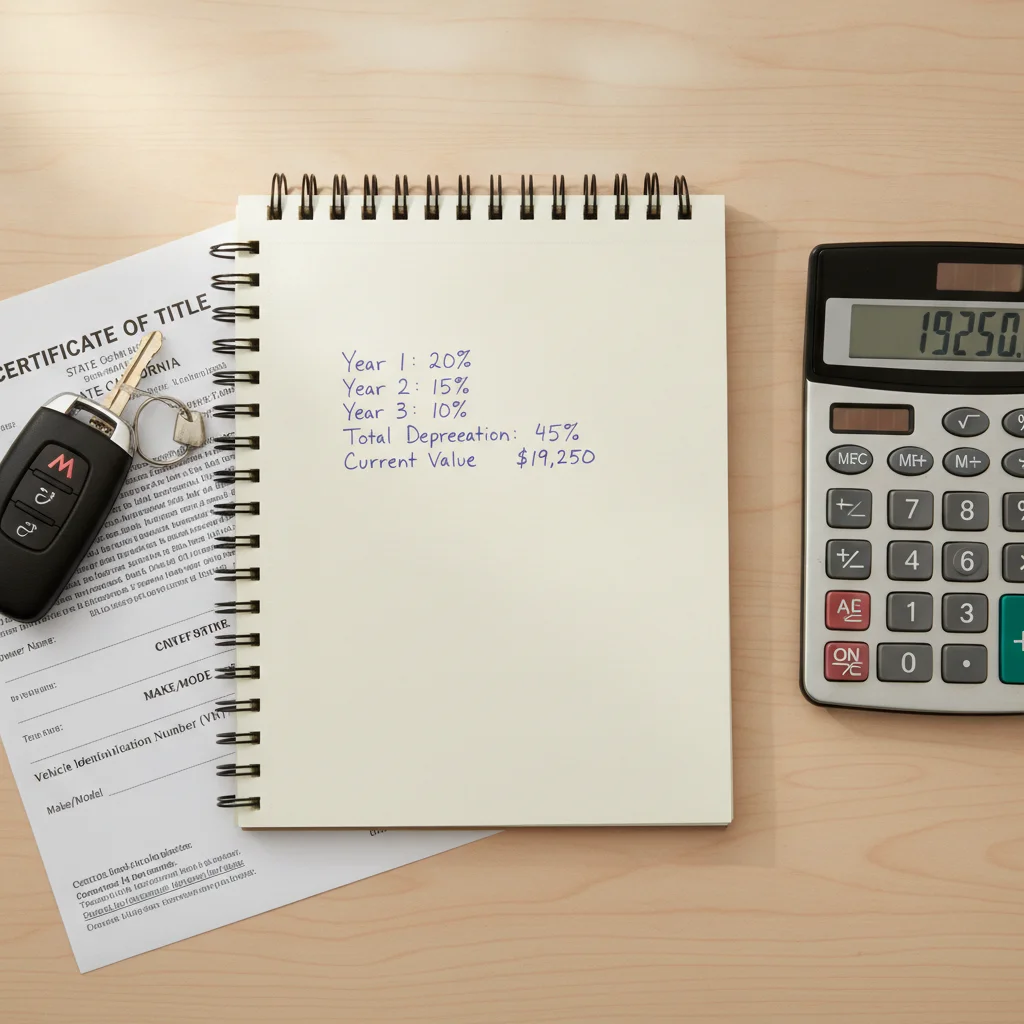
$28,900 − $19,600 = $9,300 lost
($9,300 ÷ $28,900) × 100 = 32.2% of value gone in 3 years
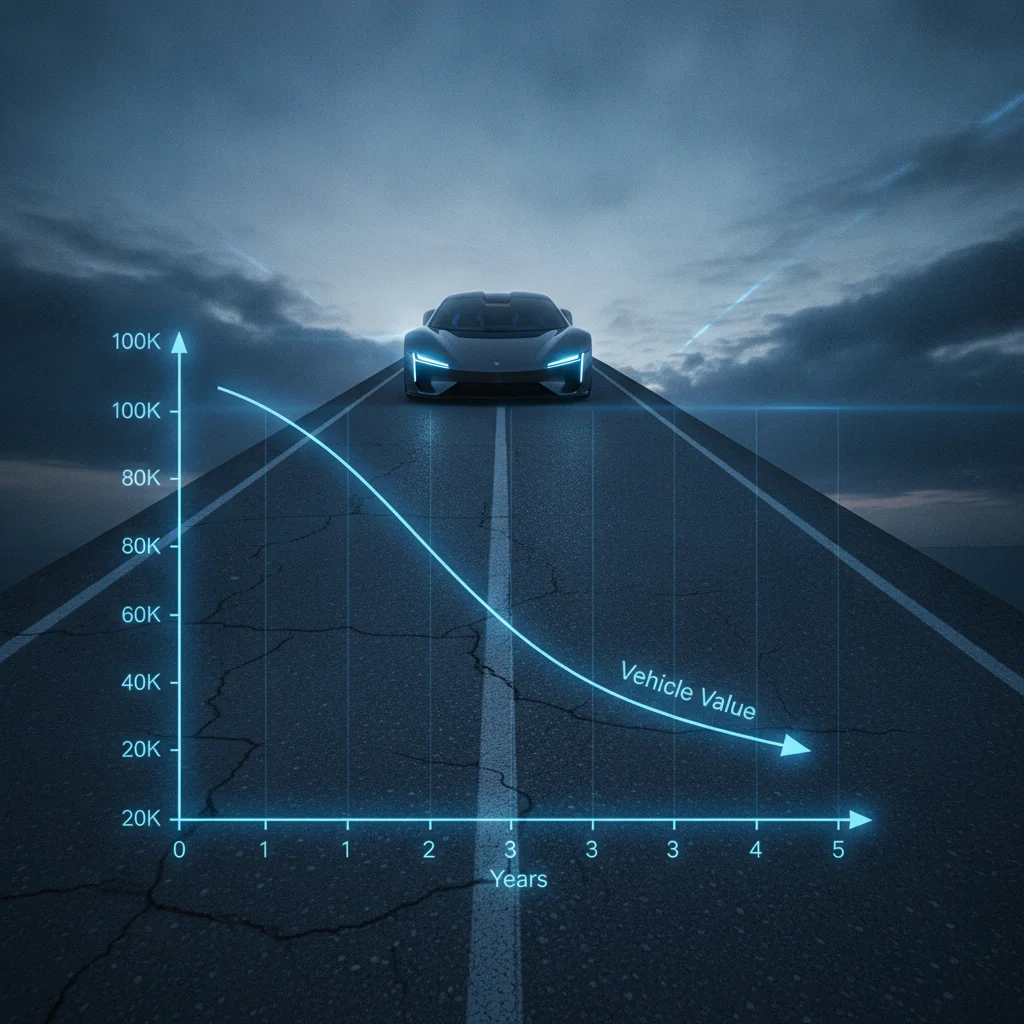
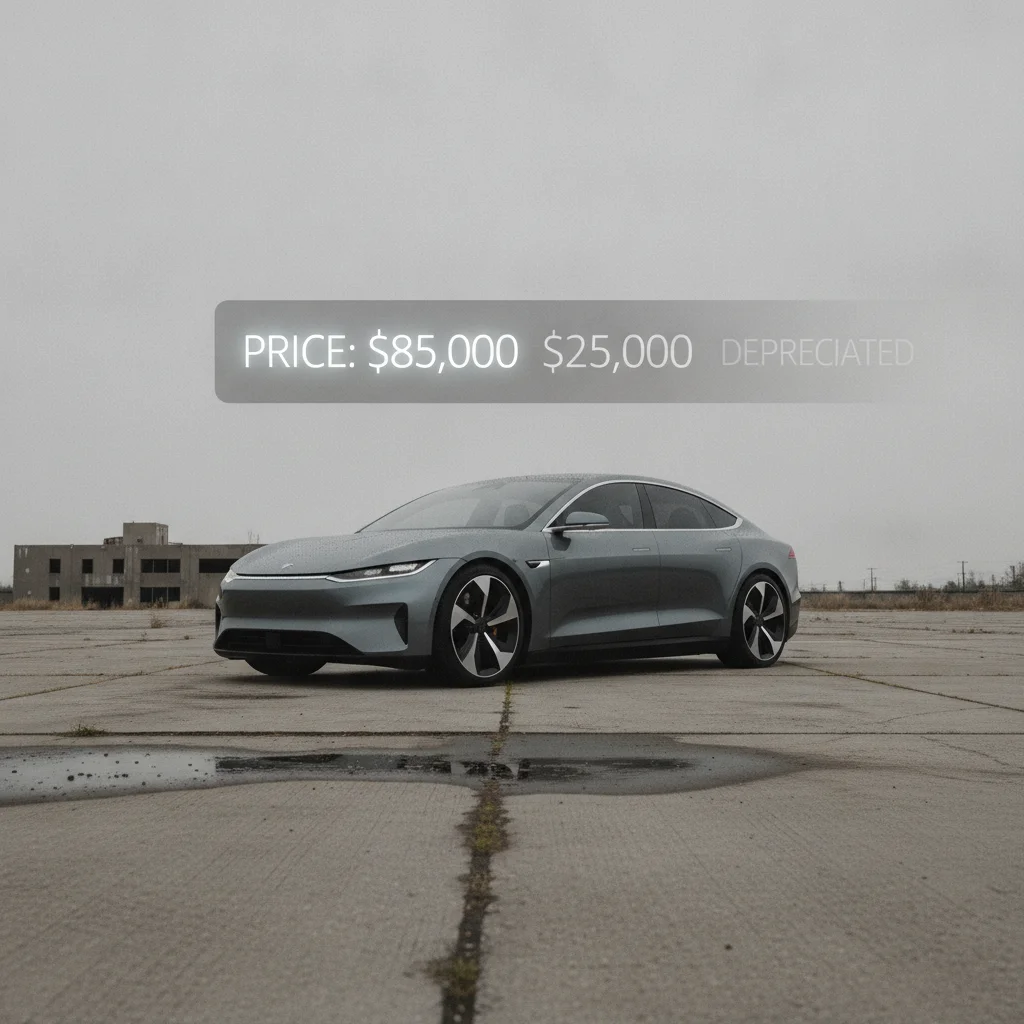
That's roughly in line with typical new-car depreciation, which the depreciation curve guide tracks year by year — new vehicles average 15–25% in year one alone, then slow down from there.
[in_content_images:0]Calculate your annual depreciation cost
Total depreciation tells you what's happened so far. Annual depreciation tells you what the car is costing you per year — which is what you need for cost-of-ownership comparisons.
Annual Depreciation:
Total $ Lost ÷ Years Owned = $ Lost Per Year
Example: $9,300 ÷ 3 years = $3,100 per year
You can also break it down per mile if you want to compare driving efficiency:
Per-Mile Depreciation:
Total $ Lost ÷ Total Miles Driven = $ Lost Per Mile
Example: $9,300 ÷ 42,000 miles = $0.221 per mile — about 22 cents a mile just in depreciation, before fuel, insurance, or maintenance.
For full context on how this fits your total ownership bill, see depreciation's role in total cost of ownership.
Adjust for mileage and condition outliers
The numbers you just calculated are your baseline. Now you need to check whether your car's mileage or condition pushes it outside the normal range — because depreciation isn't purely about age.
Here's how to think about adjustments:
- High mileage (above ~15,000/year): Your car will depreciate faster than average. If your 3-year-old car has 65,000 miles instead of 42,000, expect your current market value to be 5–12% lower than the average-mileage comparable.
- Low mileage (below ~8,000/year): Slower depreciation. The car retains more value, especially on desirable models. This is a genuine resale advantage.
- Condition issues: Deferred maintenance, cosmetic damage, or a reported accident history all accelerate value loss beyond what the age-mileage formula predicts. A clean Carfax and up-to-date service records actively slow depreciation.
- Model-specific demand: Some makes and models — particularly trucks, certain SUVs, and fuel-efficient compacts in high-gas-price environments — depreciate significantly slower than average. Others (certain luxury sedans, for instance) fall faster.
If your calculation produced a depreciation rate well above 35% in three years, check whether your vehicle is a known fast-depreciator before assuming something is wrong. The year-by-year depreciation breakdown shows typical rates by ownership milestone.
[in_content_images:1]Use your depreciation rate to make a decision
The point of all this math isn't the number itself — it's what you do with it. Here are the three most common ways to use your depreciation calculation:
- Deciding when to sell or trade in: Depreciation typically front-loads in years one through three and flattens out by years five through seven. If you're in the steep part of the curve, selling sooner locks in more value. If you've already absorbed the big drops, holding longer often makes financial sense. For a deeper look at how timing affects your outcome, vehicle depreciation explained walks through the mechanics.
- Pricing your car for sale: Your current market value (Step 2) is your realistic asking-price ceiling for a private sale, not a starting point for negotiation above market. Knowing your depreciation curve also tells you how quickly your asking price needs to come down if the car sits unsold. The depreciated value calculator walkthrough applies this math directly to listing strategy.
- Comparing your next purchase: Before buying your next vehicle, run the same calculation on a 3- or 5-year-old version of that model. Annual depreciation plus fuel, insurance, and maintenance equals your true ownership cost. A car with a $2,000/year lower depreciation rate isn't just cheaper on paper — it's $10,000 back in your pocket over five years.
What Your Depreciation Rate Is Telling You
Once you have your percentage, here's a quick benchmark table to see where your car stands:
| Years Owned | Fast Depreciator | Average | Slow Depreciator |
|---|---|---|---|
| 1 year | >25% | 15–25% | <15% |
| 3 years | >45% | 30–40% | <25% |
| 5 years | >60% | 45–55% | <35% |
If your car is tracking as a fast depreciator, that's not necessarily a crisis — but it does affect your next move. Trading out of a fast-depreciating car into a slower one over two ownership cycles can recover thousands of dollars in net value. If your car is holding up well, you have a real argument for keeping it longer rather than cycling into another front-loaded depreciation hit.
It's also worth understanding that states calculate vehicle value differently for tax purposes — their schedules often don't match market reality. why your car's assessed value doesn't match what you paid explains why your registration tax bill may look nothing like the numbers you just calculated.

If you're thinking about leasing your next vehicle, this same depreciation logic applies directly — residual value in a lease is just the lessor's prediction of depreciation at the end of your term. understanding residual value connects the dots between what you calculated here and how lease payments get structured.
Don't Confuse Trade-In Value With Private-Party Value
Trade-in values are typically 10–20% lower than private-party values because dealers need room to recondition and profit on resale. If you use trade-in value as your 'current market value,' your depreciation calculation will look inflated. Use private-party value for an apples-to-apples comparison, then treat trade-in value separately as its own negotiation data point.
Depreciation Doesn't Pause When You Stop Driving
A common misconception is that low-mileage cars hold value perfectly. Age still depreciates your car even if it sits in the garage — rubber degrades, technology ages, and market demand for older model years falls regardless of odometer reading. Low mileage slows depreciation significantly, but it doesn't stop it. Factor both age and mileage into every calculation.
Reading and Using Depreciation Data Beyond Your Own Car
Your own depreciation calculation is useful for the car you already own. But the real leverage comes when you apply this thinking before you buy. Here's how to extend the same method to vehicle research:
- Look up the 3-year-old version of any car you're considering buying new. Find its original MSRP (usually available via a quick search or the manufacturer's archived press releases) and its current private-party value. Run the percentage formula. That's what your new car will likely do.
- Compare across segments. A mid-size pickup truck and a mid-size luxury sedan might have similar purchase prices, but their 5-year depreciation rates can differ by 20 percentage points or more. That difference is tens of thousands of dollars.
- Factor in total cost of ownership. Annual depreciation is your foundation, but it lives alongside fuel, insurance, maintenance, and financing costs. depreciation's full role in total cost of ownership shows you how to stack these numbers together.
If you want to dig into published depreciation charts rather than running your own numbers from scratch, reading a depreciation chart walks through how to interpret that data and apply it to pricing decisions.

The bottom line: depreciation is predictable enough to plan around. Run these numbers once a year on your current car, run them before every major purchase, and you'll consistently make better financial decisions than the average buyer who never thinks about it until they're upside down on a loan.
Run This Calculation Every Year
Your depreciation rate changes as the car ages — it's steep early and flattens later. Recalculating once a year takes five minutes and keeps your financial picture accurate. It also gives you a heads-up when the rate is about to level off, which is often the best signal to hold rather than trade in.
Cross-Check Two Valuation Sources
KBB and Edmunds can differ by several hundred to over a thousand dollars on the same vehicle. Using the average of both gives you a more defensible number whether you're pricing a car for sale or calculating ownership costs. Neither tool is perfectly accurate — treat them as a calibrated range, not a precise verdict.

All claims are backed by peer-reviewed research. Sources on request.