Key Takeaways
Option A
Straight-Line Depreciation
The simple, predictable model for even value loss over time.
Best for: Budgeting, accounting, and lease calculations where consistency matters more than precision.
Option B
Accelerated Depreciation
The realistic, front-loaded model that mirrors how cars actually lose value.
Best for: Buyers and sellers who want to know what a vehicle is actually worth in the real market, right now.
If you need a simple formula for budgeting monthly ownership costs
Straight-Line Depreciation
Dividing the car's value evenly over its expected life gives you a consistent, manageable number for expense planning without overcomplicating the math.
If you're deciding when to sell or trade in your vehicle for maximum return
Accelerated Depreciation
The real market punishes new ownership hardest in the first few years, so knowing that curve tells you exactly when value loss starts to flatten and you get the best timing advantage.
If you're shopping for a used car and want to know whether the asking price is fair
Accelerated Depreciation
Real depreciation data shows you what the car should actually be worth at a given age and mileage — not a straight-line estimate that could be wildly off in either direction.
If you're filing business taxes or tracking vehicle assets on a balance sheet
Straight-Line Depreciation
Tax codes and accounting standards often mandate or simplify to straight-line for reporting purposes, making it the practical choice for compliance.
If you're a first-time buyer trying to understand how much your car will cost you over five years
Accelerated Depreciation
Seeing the real front-loaded cost curve prevents sticker shock later and helps you pick the right vehicle and loan term from the start.
What Each Model Actually Says About Your Car's Value
Depreciation is just math — a way of expressing the fact that your car is worth less every year you own it. The two most common models for estimating that loss are straight-line depreciation and accelerated depreciation, and they arrive at very different answers.
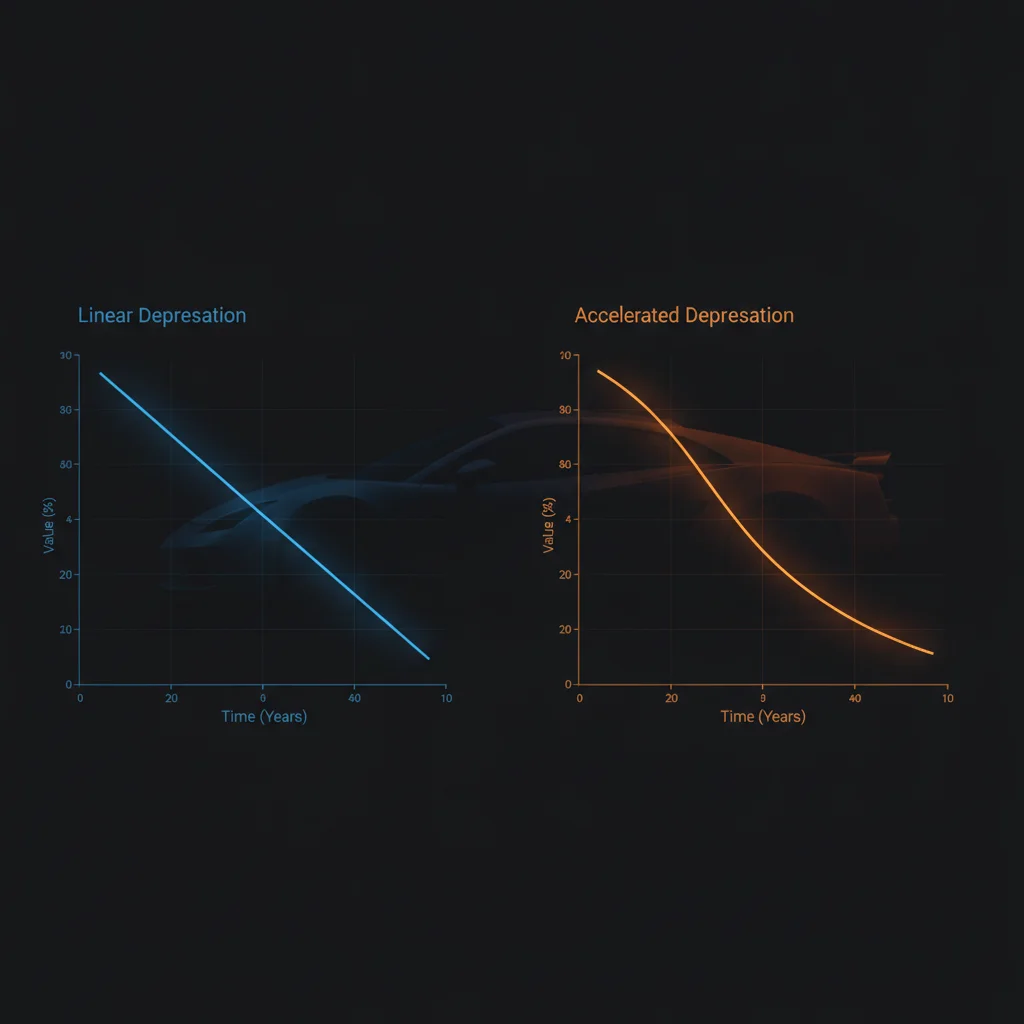
Straight-line depreciation assumes your car loses the same dollar amount or percentage of value every single year across its useful life. If a vehicle is worth $40,000 new and you expect it to be worth $5,000 after 10 years, straight-line says it loses $3,500 per year, every year, on the dot. Simple, clean, and — in the real world — almost never accurate.
Accelerated depreciation recognizes that vehicles don't age evenly. They lose value fastest when they're newest. The same $40,000 car might lose $8,000 in its first year, another $5,000 in year two, then $3,500 in year three, before the annual losses start tapering significantly. By the time the car is six or seven years old, the rate of value loss has usually slowed to a crawl.
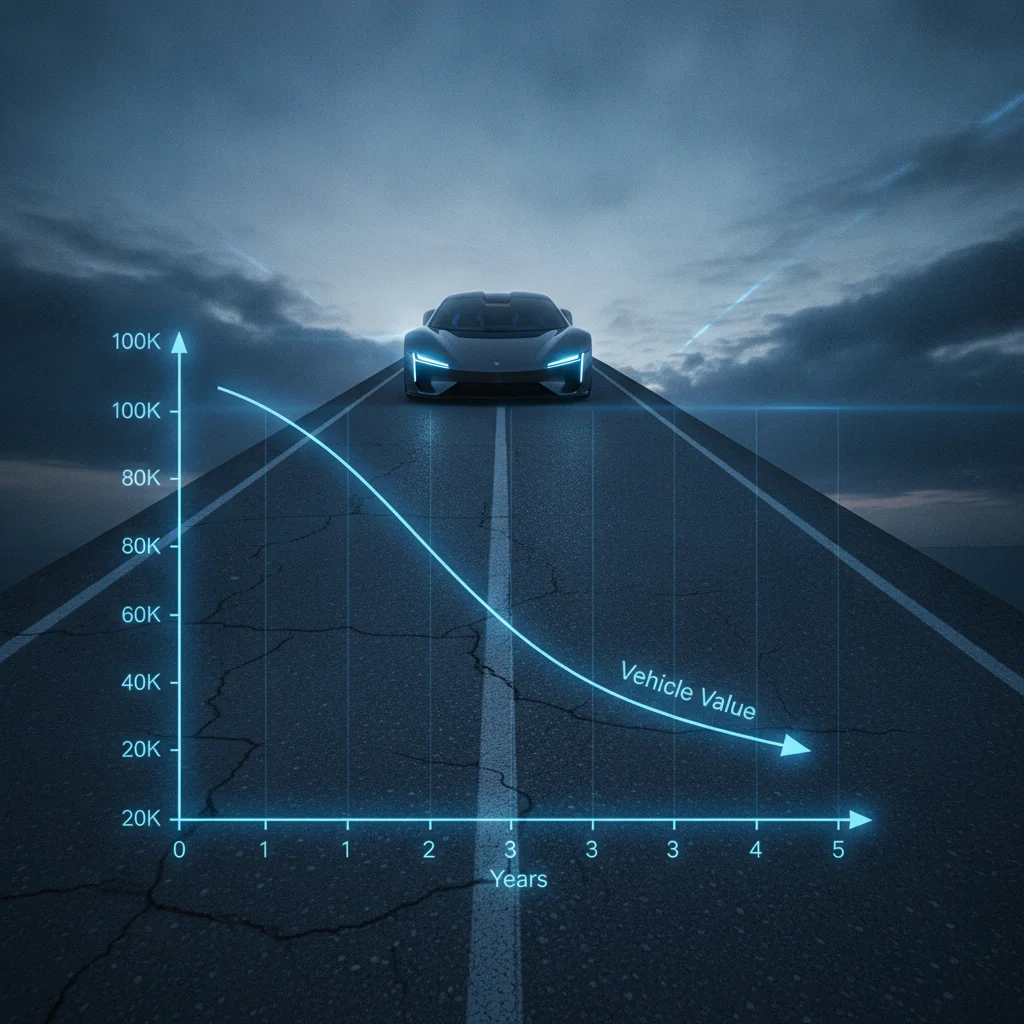
The depreciation curve across the first five years is steep enough that understanding it can reshape how you think about which car to buy and when to let it go.
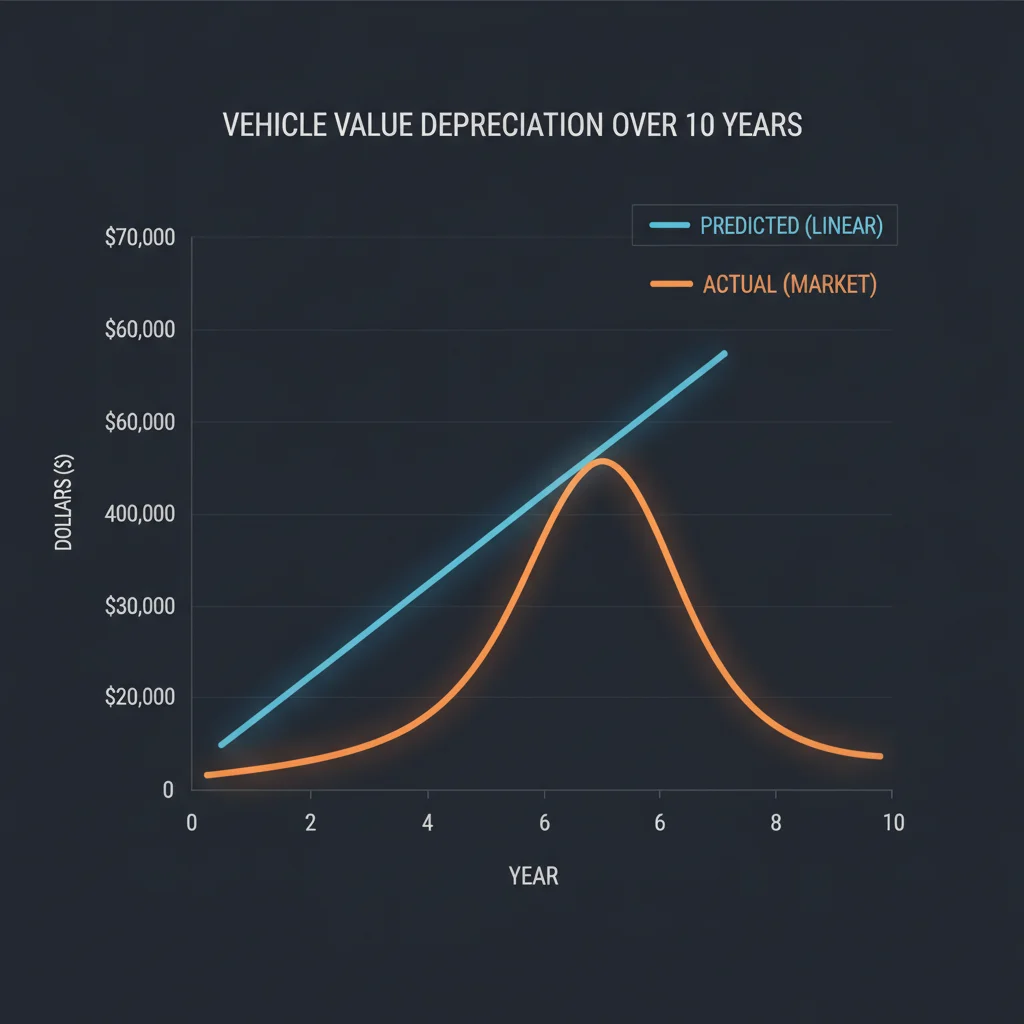
Neither model is universally wrong — they just answer different questions. Straight-line works for bookkeeping. Accelerated works for reality. Knowing which one you're dealing with changes every decision in between.
How the Numbers Play Out: A Side-by-Side Look
Let's use a concrete example to see how different these two models really are. Take a $38,000 midsize SUV with an expected 12-year useful life and a projected residual value of $2,000.
Under straight-line, the annual depreciation is ($38,000 − $2,000) ÷ 12 = $3,000 per year. By year three, the model says the vehicle is worth $29,000. Neat, predictable, and completely disconnected from what a dealer or private buyer will actually pay you.
Under accelerated depreciation — using something close to a double-declining-balance or real-market curve — year one alone might strip $7,000–$9,000 off that vehicle's value. By year three, the real-market figure is often closer to $21,000–$24,000, depending on brand, trim, and mileage. That's a $5,000–$8,000 gap from what the straight-line model told you.
| Criterion | Straight-Line Depreciation | Accelerated Depreciation |
|---|---|---|
| Core assumption | Equal value loss every year | Most value lost in early years |
| Ease of calculation | Very simple formula | Requires market data or curve modeling |
| Accuracy for real-world value | Low — rarely matches market prices | High — mirrors actual transaction data |
| Year 1 loss on a $38,000 SUV | ~$3,000 | $7,000–$9,000+ |
| Year 5 value estimate | Typically overstates value | Aligns with market comps |
| Best use case | Tax accounting, budgeting | Buying, selling, trade-in timing |
| Applicable to leasing | Sometimes used as baseline | More accurate for residual setting |
| Accounts for market forces | No | Yes — warranty, model year, demand |
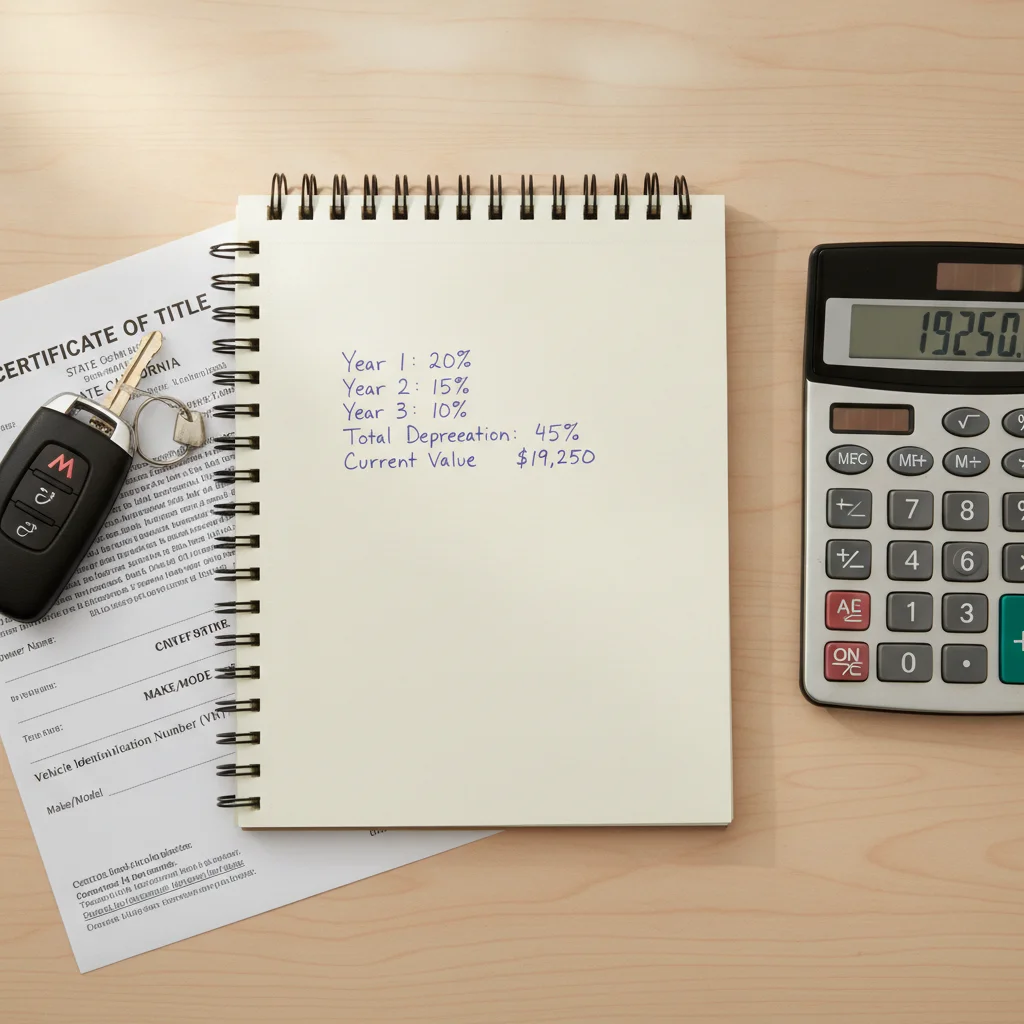
That gap matters enormously if you're making a lease-vs.-buy decision, choosing a loan term, or trying to figure out whether you're underwater on your financing. Calculating your car's actual depreciation with real numbers is the next step once you understand which model applies.
20%
Average first-year new car value loss
Most new vehicles lose between 15% and 25% of their value within the first 12 months, according to Kelley Blue Book and industry depreciation tracking data.
~50%
Value remaining after five years
The average vehicle retains roughly 40–60% of its original MSRP after five years of ownership, depending heavily on brand, segment, and market conditions.
3x
Year-one loss vs. year-seven loss
First-year depreciation is typically three or more times the annual loss experienced in years six through eight, illustrating the front-loaded nature of real vehicle depreciation.
2–3 yrs
Optimal used-car buying window
Industry analysts consistently identify two-to-three-year-old vehicles as the sweet spot where the steepest depreciation has passed but vehicles remain modern and low-mileage.
Why Cars Depreciate on an Accelerated Curve — Not a Straight Line
There are a few concrete reasons why the real-world depreciation curve bends steeply at the front end rather than rolling out flat.
New-Car Premium Evaporates Immediately
Part of what you pay for a new car is the intangible value of being the first owner — a clean title, zero miles, no unknown history. The moment you take delivery, that premium is gone. A car with 500 miles on it is already a used car in the market's eyes, even if nothing has changed mechanically. What depreciation does to a new car's value the moment you drive away covers this phenomenon in depth — the first-year hit is real and significant.
Warranty Coverage Shifts Risk to the Manufacturer Early On
A new car under a full factory warranty carries lower risk for the buyer. As that coverage expires — typically at three years for bumper-to-bumper — the buyer absorbs more risk, which the market prices in as lower resale value. This creates natural value-drop inflection points around warranty expiration milestones.
Newer Model Years Apply Competitive Pressure
Each year a new model year arrives, the previous year's vehicle becomes relatively less desirable. A 2022 model competing against a 2025 model with updated tech and safety features takes a hit in perceived value that has nothing to do with mechanical wear. This annual refresh cycle accelerates early depreciation.
High-Mileage Accumulation in Early Years
Most owners drive 12,000–15,000 miles per year. In the first three years, that's 36,000–45,000 miles — often enough to trigger a psychological threshold for used-car buyers who shy away from anything approaching 50,000 miles. Mileage and age both push value down hardest while they're accumulating fastest.

Put all four factors together and the math almost forces a front-loaded depreciation curve. The straight-line model simply ignores all of it.
When Straight-Line Depreciation Actually Makes Sense
Straight-line isn't useless — it's just useful in a narrower set of situations than most car owners think.
Business and Tax Accounting
If your vehicle is a business asset, your accountant may use straight-line depreciation to spread the cost evenly across its IRS-recognized useful life. This simplifies your books and may be required by your reporting method. The IRS also has its own depreciation rules under MACRS (Modified Accelerated Cost Recovery System), but for basic record-keeping, straight-line is common and accepted.
Lease Residual Calculations
Many lease agreements use a simplified depreciation estimate to set the residual value — the car's projected worth at the end of the lease term. Leasing companies often apply their own proprietary curves, but the underlying math sometimes starts from a straight-line baseline adjusted by market data. Understanding this helps you evaluate whether a lease's residual value is realistic or padded.
Rough Budgeting Over Long Ownership Periods
If you plan to own a vehicle for 10+ years and just want a ballpark sense of annual value loss for budget purposes, straight-line gives you a workable number. You know it won't be precise in any given year, but it averages out reasonably over a long time horizon.
Depreciation Models vs. Market Appraisal Tools
Depreciation models — whether straight-line or accelerated — are mathematical frameworks, not live valuations. For an actual current market value, always cross-reference with real-market tools like Kelley Blue Book, Edmunds True Market Value, or dealer auction data (Black Book). Model outputs are directionally useful; market comps are what you'll actually negotiate against.
A Note on Business Vehicle Depreciation
If you use your vehicle for business purposes, the IRS governs how you can deduct depreciation — and the rules are more specific than either model discussed here. Section 179 deductions and bonus depreciation rules can allow accelerated write-offs in the first year for business-use vehicles, which is a separate concept from the market-value depreciation this article covers. Consult a tax professional before making vehicle purchase decisions based on tax depreciation strategy.
The key is knowing which situation you're in. If you're trying to figure out what your car is worth today — not on average over 10 years — straight-line is the wrong tool. Use accelerated depreciation benchmarks or check actual market data sources like Kelley Blue Book or Black Book for current-market valuations.
Using Depreciation Models to Time Your Buy or Sell Decision
This is where understanding depreciation curves pays off directly. The shape of the curve tells you when you're getting the most and least value out of a vehicle.
The Sweet Spot for Buying Used
Accelerated depreciation means the first owner absorbs the biggest hit. If you buy a two- to three-year-old vehicle, you sidestep 30–40% of the original sticker price in losses while still getting a relatively modern, low-mileage vehicle. Used car depreciation curves by segment show exactly where this advantage is sharpest — it varies significantly by vehicle type.
When to Sell Before the Curve Gets Flat
Counterintuitively, the accelerated curve also tells you when not to wait. Once a vehicle hits the five- to seven-year mark, annual depreciation slows considerably — but so does resale demand. Older vehicles attract a narrower buyer pool, can face financing restrictions (some lenders won't finance vehicles over 10 years old), and may start accumulating maintenance costs that erode your net return. Selling in the three- to five-year window — before major maintenance expenses pile up but after the steepest value drop has already occurred — often produces the best net outcome.
Model Matters as Much as Math
Some vehicles depreciate far slower than others due to brand reputation, reliability records, and segment demand. A Toyota Tacoma or Honda CR-V holds value well enough that the accelerated curve looks almost gentle compared to a luxury sedan from the same year. The model matters as much as the math, so always check segment-specific data before assuming general rules apply.

The bottom line: treat depreciation not as a fixed penalty, but as a variable you can partially control through vehicle selection, ownership timing, and maintenance habits that support resale condition.
Putting It Together: Which Model Should You Actually Use?
Here's the honest answer: use accelerated depreciation as your mental model for any real-world car decision. Use straight-line only when the situation explicitly calls for it — accounting, simplified budgeting, or lease math where the numbers are predetermined anyway.
When you're buying, the accelerated curve tells you which year of ownership delivers the best value-per-dollar. When you're selling, it tells you where you sit on the slope and whether you're still in free-fall or leveling out. When you're evaluating a used-car price, it gives you a benchmark to test whether the asking price reflects actual market reality or wishful thinking.
The full picture of how age, mileage, and condition affect vehicle value pulls together all the variables depreciation depends on — because the curve isn't just about time. It's about how many miles you've put on it, how well you've maintained it, and whether the market is hot or cold for that particular segment right now.
Neither model is magic. But one of them reflects the market you actually have to deal with. That's accelerated depreciation — messy, front-loaded, and accurate in a way that straight-line math simply isn't built to be.
Depreciation Models vs. Market Appraisal Tools
Depreciation models — whether straight-line or accelerated — are mathematical frameworks, not live valuations. For an actual current market value, always cross-reference with real-market tools like Kelley Blue Book, Edmunds True Market Value, or dealer auction data (Black Book). Model outputs are directionally useful; market comps are what you'll actually negotiate against.
A Note on Business Vehicle Depreciation
If you use your vehicle for business purposes, the IRS governs how you can deduct depreciation — and the rules are more specific than either model discussed here. Section 179 deductions and bonus depreciation rules can allow accelerated write-offs in the first year for business-use vehicles, which is a separate concept from the market-value depreciation this article covers. Consult a tax professional before making vehicle purchase decisions based on tax depreciation strategy.

All claims are backed by peer-reviewed research. Sources on request.