Key Takeaways
Total Cost of Ownership (TCO)
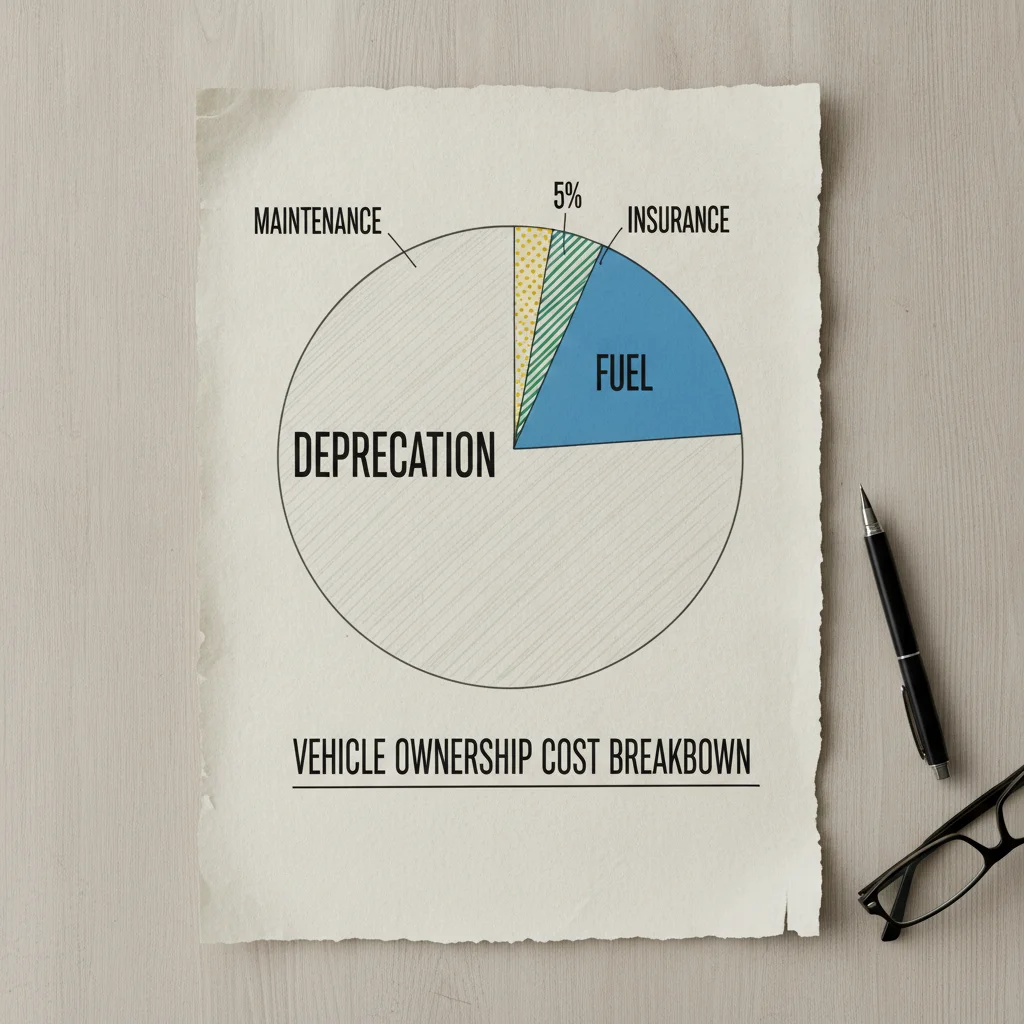
Total cost of ownership is everything you actually spend on a vehicle over the time you own it — not just the sticker price or monthly payment. It includes depreciation, fuel, insurance, maintenance, financing costs, and taxes. Depreciation is almost always the single biggest line item in that total, often accounting for 40–50% of the overall cost of owning a car.
TCO is calculated by summing all cash outflows (loan payments, insurance premiums, fuel, maintenance, registration) plus the opportunity cost of lost equity due to depreciation over a defined ownership period.
Why Depreciation Belongs at the Top of the TCO Conversation
Most people build a car budget around the monthly payment. Maybe they factor in gas and insurance if they're thorough. But there's a cost that dwarfs most of those line items and never appears on any bill — depreciation.
Depreciation is the difference between what you paid for a vehicle and what you'd get for it today. It happens whether you drive the car or leave it in a garage. It's not a fee. It's not a charge. It's a loss of value that accumulates silently every month you own the car, and it's the foundation of any honest total cost of ownership (TCO) calculation.
The reason depreciation belongs at the top of the TCO conversation is simple: for most vehicle types, it's the single largest expense of ownership — larger than fuel, larger than insurance, often larger than both combined. According to AAA's annual Your Driving Costs study, depreciation accounts for roughly $3,000–$5,000 per year for a typical new sedan. Spread that over five years, and you've silently spent $15,000–$25,000 before you even factor in oil changes.
If you want a full picture of what owning a vehicle actually costs, depreciation isn't a footnote — it's the headline. Start with the basics of vehicle depreciation if you haven't already worked through how it functions before getting into TCO calculations.
How to Actually Calculate Depreciation in a TCO Model
Plugging depreciation into a TCO calculation isn't complicated, but it does require knowing two numbers: what you paid and what the car is worth right now (or what it will be worth when you plan to sell it).
The basic formula looks like this:
Annual Depreciation Cost = (Purchase Price – Projected Resale Value) ÷ Years of OwnershipSo if you paid $32,000 for a car you plan to own for five years and expect to sell it for $14,000, your depreciation cost is:
($32,000 – $14,000) ÷ 5 = $3,600 per yearAdd that $3,600 annually — or $300 per month — to your fuel, insurance, maintenance, and financing costs, and you get a real picture of what the vehicle is costing you. Most people are surprised when they see that number sitting next to their $450 loan payment.
49%
Average new car value lost in 5 years
According to iSeeCars depreciation data, the average new vehicle loses approximately 49% of its value within the first five years of ownership.
$3,500+
Average annual depreciation cost
AAA's Your Driving Costs study estimates that depreciation costs the average new car owner more than $3,500 per year, making it the largest single ownership expense.
20–25%
Value lost in year one alone
New vehicles typically lose 20–25% of their value in the first 12 months, often simply by being titled and driven off the lot.
40–50%
Share of TCO attributable to depreciation
Industry analyses of total cost of ownership consistently find that depreciation represents 40–50% of the total cost for most new vehicle owners over a five-year period.
For a more detailed walkthrough using actual market data and tools, follow a practical depreciation calculation step by step. And if you want depreciation rates broken down by segment and model, the complete vehicle depreciation reference is a solid resource to bookmark.
Depreciation Estimates Vary by Source
Different tools — Edmunds True Cost to Own, KBB, iSeeCars, and NADA — calculate projected depreciation using different methodologies and datasets. The numbers will be close but not identical. For TCO planning purposes, treat any estimate as a useful directional figure rather than a guaranteed outcome. Real-world resale values are also influenced by local market conditions, vehicle color, trim level, and condition at time of sale.
Leasing Shifts Depreciation Risk
When you lease, the monthly payment is essentially covering the vehicle's depreciation during the lease term — plus interest and fees. The lessor assumes the residual value risk. This can make leasing look favorable on a monthly payment basis, but it means you build no equity and must repeat the process at lease end. It's not inherently better or worse, but understanding this makes lease vs. buy comparisons more honest.
The Depreciation Curve: Front-Loaded and Unforgiving
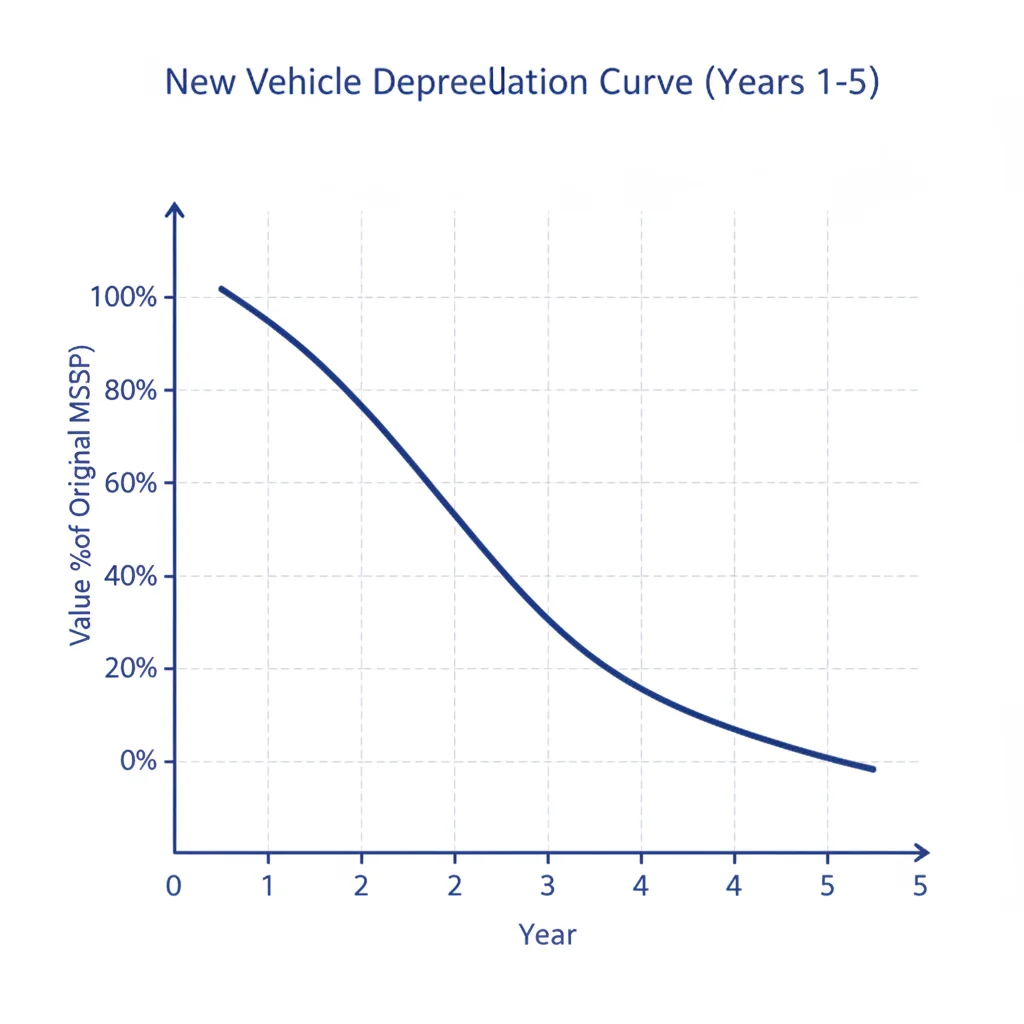
Understanding when depreciation hits hardest changes how you think about every vehicle purchase. Depreciation is not linear. You don't lose an equal slice of value each year. The curve drops sharply at first and then flattens out — and knowing where a car sits on that curve completely changes the math.
Here's a rough breakdown of how a $35,000 new vehicle typically depreciates:
| Year | Estimated Value | Value Lost |
|---|---|---|
| Purchase (New) | $35,000 | — |
| Year 1 | $26,600 | $8,400 (24%) |
| Year 2 | $22,400 | $4,200 (12%) |
| Year 3 | $19,250 | $3,150 (9%) |
| Year 4 | $17,150 | $2,100 (6%) |
| Year 5 | $15,400 | $1,750 (5%) |
Notice that the first year alone accounts for nearly a quarter of the car's original value. By year three, the annual depreciation rate has already slowed significantly. This is the core insight behind why buying a two- or three-year-old vehicle is one of the most effective cost moves in car ownership — you let the first owner absorb that brutal early drop.
Use Residual Value When Comparing Cars
Before buying, pull the projected 3-year and 5-year residual values for every vehicle you're considering. A car with a $35,000 price tag and a 55% residual will cost you far less in depreciation than a $33,000 car with a 40% residual. Don't just shop by sticker price — shop by depreciation rate.
Document Everything to Protect Resale Value
Keep every receipt for oil changes, tire rotations, and repairs — even small ones. When it's time to sell, a folder of service records is a tangible asset that justifies a higher asking price. For private party sales especially, documented maintenance history is one of the most effective tools for reducing your realized depreciation cost.
The curve also tells you when to sell. Holding a vehicle into years six, seven, and beyond means you're dealing with slower depreciation but faster mechanical wear — which brings its own TCO costs. The sweet spot for many owners who want to minimize total depreciation cost is to sell or trade in around years four to six, before major repair bills start climbing.
Depreciation and Financing: The Underwater Risk
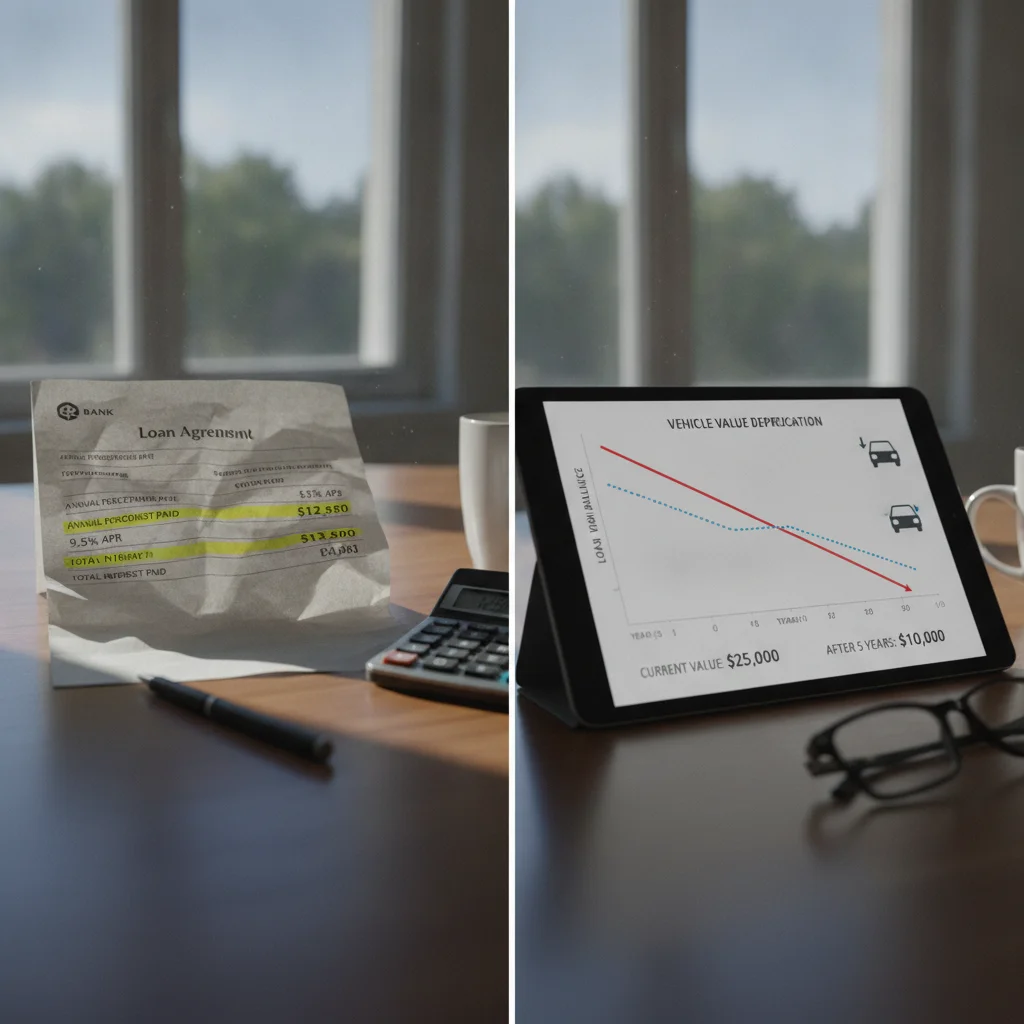
Here's where depreciation stops being an abstract concept and starts being a real financial hazard: when you finance a vehicle, you're borrowing money against an asset that loses value every single month. If the car depreciates faster than your loan balance drops, you end up in what's called negative equity — you owe more than the car is worth.
This is common with:
- Long loan terms (72–84 months) — Monthly payments are lower, but the loan balance drops slowly, especially early on when most of each payment goes toward interest, not principal.
- Small or no down payments — You start deep in the hole immediately. A car worth $35,000 with no money down is already worth $26,600 after year one. If you owe $33,000, you're $6,400 underwater.
- High-depreciation vehicles — Some luxury brands and certain EV models lose value faster than average. Financing one of these without a significant down payment is financially risky from day one.
“The most expensive car you can buy is one that depreciates fast on a long loan. You're paying interest on a shrinking asset, and the math almost never works in your favor.”
— Philip Reed, Senior Consumer Advice Editor, Edmunds.com
Being underwater isn't just an inconvenience. It means if your car is totaled or stolen, your insurance payout won't cover what you owe the lender — you'll owe the difference out of pocket unless you have gap insurance. It also means you can't trade in or sell without bringing cash to the table.
If you want to understand how loan length and structure interact with depreciation, reviewing how loan terms actually work will help you see the connection clearly.
The Other TCO Components — and How Depreciation Interacts with Each
Depreciation doesn't exist in a vacuum. It interacts with every other cost in the TCO equation. Here's how the major components connect:
Fuel Costs
A vehicle with terrible fuel economy might cost you $3,000 a year in gas — but if it's a pickup truck with strong residual values, your annual depreciation might only be $2,500. The TCO math is different from what monthly fuel fill-ups suggest. Conversely, some fuel-efficient cars depreciate so quickly that the gas savings are wiped out by the value loss.
Insurance Premiums
Newer, more expensive vehicles cost more to insure. If you're buying a higher-priced car to get better features, you're not just paying more upfront — you're paying more in both depreciation and insurance premiums simultaneously.
Maintenance and Repairs
Here's the direct link most people miss: poor maintenance accelerates depreciation. A car with inconsistent oil changes, neglected tires, or deferred fluid services will fetch less at resale than a comparable vehicle with clean service records. That difference directly increases the depreciation portion of your TCO. Every dollar you skip on maintenance may cost you two or three dollars in reduced resale value.
Registration and Taxes
In most states, annual registration fees are tied to vehicle value — so they naturally decline as the car depreciates. It's a minor TCO factor, but worth knowing you're paying more in fees during the years you're also losing the most to depreciation.
Depreciation Estimates Vary by Source
Different tools — Edmunds True Cost to Own, KBB, iSeeCars, and NADA — calculate projected depreciation using different methodologies and datasets. The numbers will be close but not identical. For TCO planning purposes, treat any estimate as a useful directional figure rather than a guaranteed outcome. Real-world resale values are also influenced by local market conditions, vehicle color, trim level, and condition at time of sale.
Leasing Shifts Depreciation Risk
When you lease, the monthly payment is essentially covering the vehicle's depreciation during the lease term — plus interest and fees. The lessor assumes the residual value risk. This can make leasing look favorable on a monthly payment basis, but it means you build no equity and must repeat the process at lease end. It's not inherently better or worse, but understanding this makes lease vs. buy comparisons more honest.
The point is that all TCO components interact. Depreciation sets the floor on the financial conversation, but the other costs either compound or partially offset it depending on how you buy and manage the vehicle. Explore how age, mileage, and condition specifically drive depreciation to see how your habits affect the resale equation.
Using Depreciation to Make Smarter Buying and Selling Decisions
Once you understand depreciation's role in the TCO model, it changes how you approach both sides of vehicle ownership.
On the Buying Side
Shopping for a new vehicle? Ask for projected residual values at three and five years — many manufacturer websites and independent tools like Edmunds True Cost to Own publish this data. A vehicle with a 50% residual at five years is a fundamentally better financial proposition than one with a 35% residual, all else being equal.
If you're buying used, look at where the car sits on the depreciation curve. A two-year-old vehicle that has already absorbed 30–35% of its value loss is a strong value buy. A four-year-old vehicle with high mileage may be past the point where depreciation savings offset increased maintenance risk.
On the Selling Side
Timing your sale matters. In general, selling before the 60,000-mile mark and within the first five years gives you the best combination of value retained and buyer appeal. If you're planning to trade in, don't just ask what your car is worth — compare that number to what you originally paid and calculate your actual depreciation cost. That's the real expense you've absorbed.
Market timing also plays a role. Pickup trucks and SUVs command higher resale values when gas prices are low. Convertibles sell for more in spring. Knowing these patterns can shift your realized depreciation cost by a meaningful amount.
Use Residual Value When Comparing Cars
Before buying, pull the projected 3-year and 5-year residual values for every vehicle you're considering. A car with a $35,000 price tag and a 55% residual will cost you far less in depreciation than a $33,000 car with a 40% residual. Don't just shop by sticker price — shop by depreciation rate.
Document Everything to Protect Resale Value
Keep every receipt for oil changes, tire rotations, and repairs — even small ones. When it's time to sell, a folder of service records is a tangible asset that justifies a higher asking price. For private party sales especially, documented maintenance history is one of the most effective tools for reducing your realized depreciation cost.
Finally, keep your records. A clean service history, documented repairs, and original equipment all signal lower risk to buyers and translate into higher resale prices. It's one of the most concrete ways a maintenance habit translates directly into depreciation savings — and a lower TCO when all is said and done.


All claims are backed by peer-reviewed research. Sources on request.