| Typical hard-braking threshold | 7–8 mph/second deceleration (Progressive Snapshot program documentation) |
| Highest-risk nighttime window | Midnight to 4 a.m. (NHTSA fatality data, 2022) |
| Maximum discount range (top performers) | Up to 40% off premium (Insurer program disclosures, 2023–2024) |
| Typical monitoring period | 30 to 90 days (Varies by insurer program) |
| Low-mileage threshold (common benchmark) | Under 7,500 miles per year (Industry underwriting standard) |
| Hard braking share of composite score | 40–60% (where disclosed) (Insurer methodology disclosures) |
What Telematics Actually Tracks — and Why It Matters
If you've signed up for a usage-based insurance program — through Progressive Snapshot, State Farm Drive Safe & Save, Allstate Drivewise, or a similar platform — you're sharing driving data in exchange for a potential rate discount. But most drivers have only a vague sense of what's actually being measured. "Safe driving" is the promised goal, but insurers aren't scoring a general impression. They're recording discrete, timestamped behavioral signals and running them through actuarial models to estimate your risk profile.
Understanding the specific variables your insurer tracks is the first step toward both protecting your rate and making sense of any score feedback you receive. This article breaks down each major telematics signal, what the sensor is actually detecting, and how it maps to underwriting risk.
| Typical hard-braking threshold | 7–8 mph/second deceleration (Progressive Snapshot program documentation) |
| Highest-risk nighttime window | Midnight to 4 a.m. (NHTSA fatality data, 2022) |
| Maximum discount range (top performers) | Up to 40% off premium (Insurer program disclosures, 2023–2024) |
| Typical monitoring period | 30 to 90 days (Varies by insurer program) |
| Low-mileage threshold (common benchmark) | Under 7,500 miles per year (Industry underwriting standard) |
| Hard braking share of composite score | 40–60% (where disclosed) (Insurer methodology disclosures) |
For a broader look at how these programs compare to standard policies, see how usage-based insurance stacks up against traditional coverage.
Hard Braking: The Signal Insurers Weight Most Heavily
Hard braking is consistently cited by insurers as one of the strongest predictors of future claims. When a telematics device or smartphone app detects a rapid deceleration — typically defined as losing more than 7–8 miles per hour per second — it logs the event as a hard-braking incident. Some insurers use a threshold as low as 6 mph/s; the exact cutoff varies by program.

Why does this matter? A sudden stop isn't just a driving style preference. It implies the driver was following too closely, reacting late to a hazard, or traveling at a speed inconsistent with conditions ahead. In aggregate, drivers who brake hard frequently are involved in rear-end collisions at a higher rate — a loss pattern actuaries have documented across large telematics datasets.
What smooth braking looks like to a sensor: a gradual, controlled deceleration curve — losing 2–3 mph per second over several seconds rather than a sharp spike. Traffic patterns, emergency situations, and road conditions can force necessary hard stops, and most insurers allow a reasonable number of events before penalizing a score. The problem is accumulation. A handful of hard-braking events per trip compounds quickly over a 30-to-90-day monitoring period.
Progressive's Snapshot program has publicly noted that hard braking is one of the top two factors influencing whether a driver receives a rate increase after the monitoring period ends.
For context on how brake system condition relates to stopping distance, evaluating brake performance on a test drive offers a useful mechanical baseline.
Acceleration, Cornering, and Speed: The Full Behavioral Picture
Hard braking gets the most attention, but modern telematics programs track a broader range of g-force events — including rapid acceleration and sharp cornering. Here's how each signal is interpreted:
Rapid Acceleration
Sometimes called "hard starts," rapid acceleration events are logged when a vehicle gains speed too quickly from a stop or during highway merging. The threshold is generally comparable to hard braking — roughly a gain of 8 mph per second or more. Aggressive acceleration is associated with higher speeds, less predictable vehicle behavior, and increased tire and brake wear. From an insurer's perspective, it indicates a driver who is either inattentive to fuel efficiency or simply less cautious in traffic.
Cornering Force
Not all telematics programs score cornering, but many advanced platforms do. The accelerometer in a smartphone or plug-in OBD device measures lateral g-forces during turns. Taking corners at excessive speed — even on a familiar residential road — creates lateral forces that can result in loss of control. Insurers correlate high cornering events with rollover incidents and side-impact crashes.
Speed
Speed scoring varies significantly by program. Some insurers record raw speed data continuously; others track only whether the vehicle exceeds a set threshold (commonly 80 or 85 mph). A small number of programs score speeding as a percentage over the posted limit using GPS map data. Sustained high-speed driving increases both crash severity and the likelihood of catastrophic injury claims — the two factors that drive up insurer payout exposure the most.

App vs. Plug-In Device: Data Collection Differs
Smartphone-based telematics apps and OBD-II plug-in dongles don't capture identical data. Plug-in devices read directly from the vehicle's sensor bus, providing precise speed and engine data. App-based systems rely on GPS and the phone's accelerometer, which may introduce measurement variability — particularly in tall buildings or tunnels. Knowing which your insurer uses can help you understand the precision of your score.
Surcharge Policies Vary Widely by State
Not every state allows insurers to impose a rate surcharge if a driver scores poorly in a telematics program. In some states, telematics participation is discount-only by regulatory requirement. Before enrolling, check your insurer's program terms to confirm whether a low score can actually raise your rate or only limit your discount.
Monitoring Period Data May Be Retained Long-Term
Most insurers retain telematics data beyond the initial monitoring period for use in future underwriting decisions, claims investigations, and actuarial modeling. Review your insurer's privacy policy before enrolling to understand how long your driving data is stored and under what circumstances it may be accessed.
To understand how each of these variables ultimately feeds into a rate calculation, see how insurers use telematics data to price your policy.
Telematics
Technology that collects real-time driving data — speed, location, acceleration, braking — through a plug-in device or smartphone app. Insurers use this data to assess individual driving risk rather than relying solely on demographic factors.
Hard braking event
A logged incident in which a vehicle decelerates at a rate typically exceeding 7–8 miles per hour per second. Insurers treat frequent hard-braking events as a strong predictor of collision risk.
Usage-based insurance (UBI)
An insurance pricing model that adjusts premiums based on actual driving behavior and mileage rather than static risk factors like age or ZIP code alone.
OBD-II port
The standardized diagnostic port found in most vehicles manufactured after 1996, located under the dashboard. Many telematics plug-in dongles connect here to read vehicle sensor data.
G-force event
Any rapid change in velocity — forward, backward, or lateral — detected by an accelerometer. Hard braking, hard acceleration, and sharp cornering all generate measurable g-force events.
Composite driving score
A single number or grade calculated by weighting and combining multiple behavioral signals — braking, acceleration, speed, nighttime driving — into an overall risk estimate for the insurer.
Monitoring period
The fixed window of time — commonly 30 to 90 days — during which a telematics program collects driving data. The resulting score typically determines any discount or surcharge applied at renewal.
Distraction detection
A feature in some app-based telematics programs that uses smartphone motion sensors and usage patterns to infer whether a driver is handling their phone while operating the vehicle.
Time of Day and Mileage: The Contextual Variables
Beyond vehicle dynamics, telematics programs layer in contextual risk factors that reflect when and how much you drive — not just how you drive.
Nighttime Driving
Driving between midnight and 4 a.m. carries materially elevated risk, even for cautious drivers. Fatigue is a factor, but so is the higher proportion of impaired drivers on the road during late-night and early-morning hours. Most telematics programs flag trips taken during this window, and some score them more heavily than individual hard-braking events. This is a variable entirely outside typical driver behavior — you can brake perfectly and still accumulate risk points for a late-night airport run.
Total Mileage
Usage-based insurance was originally built around a simple premise: drivers who put fewer miles on their vehicles file fewer claims over time. That statistical relationship remains robust. Low-mileage drivers — typically under 7,500 miles per year — tend to receive the largest discounts in telematics programs. High-mileage commuters, by contrast, may find that the program produces a rate increase even with otherwise good behavior scores, simply because exposure time on the road is inherently cumulative.
40%
Maximum discount for top telematics scorers
Several major insurers including Progressive and Allstate advertise discounts up to 40% for drivers who complete monitoring with strong scores.
3x
Higher crash risk during midnight–4 a.m. window
According to NHTSA, fatal crash rates per mile driven are approximately three times higher during overnight hours compared to daytime driving.
15%
Average telematics discount for enrolled drivers
A 2023 J.D. Power study found the average realized discount among telematics program participants was approximately 15% at policy renewal.
1 in 4
Drivers who score worse after telematics monitoring
Consumer reports and insurer disclosures indicate roughly 25% of monitored drivers receive no discount or a rate increase after the monitoring period.
Phone Use and Distraction Detection
This is the frontier of telematics measurement. An increasing number of programs — particularly app-based platforms like Root Insurance — use smartphone motion and sensor data to infer whether the driver is holding or actively using a phone. The methodology is imperfect (a passenger using a phone can trigger the same signal), but phone-use detection is becoming more common as insurers face pressure to price distracted driving risk more accurately. If your program uses an app rather than a plug-in device, this may already be part of your score.
If you're thinking about whether to opt in at all, trading data for discounts: what you need to know before opting in is worth reading first.
How Scores Are Calculated and What They Actually Change
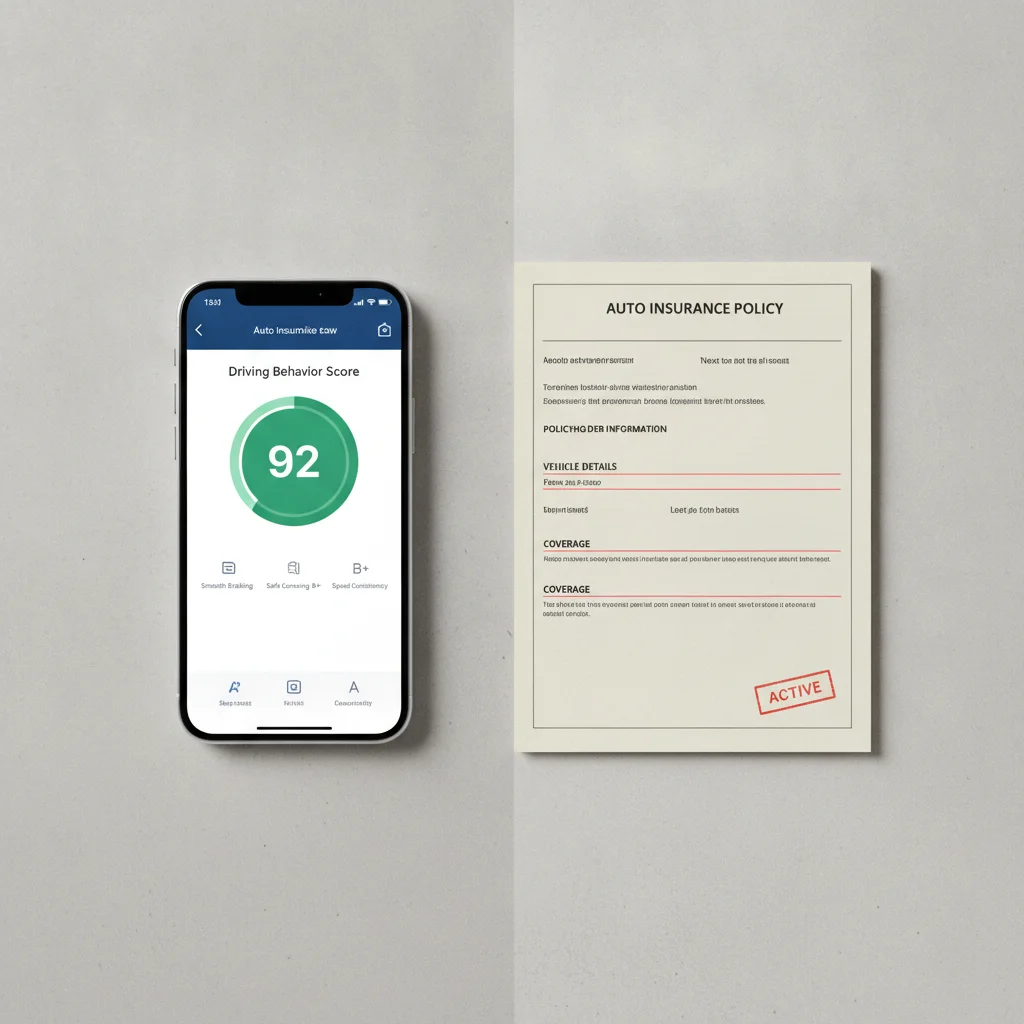
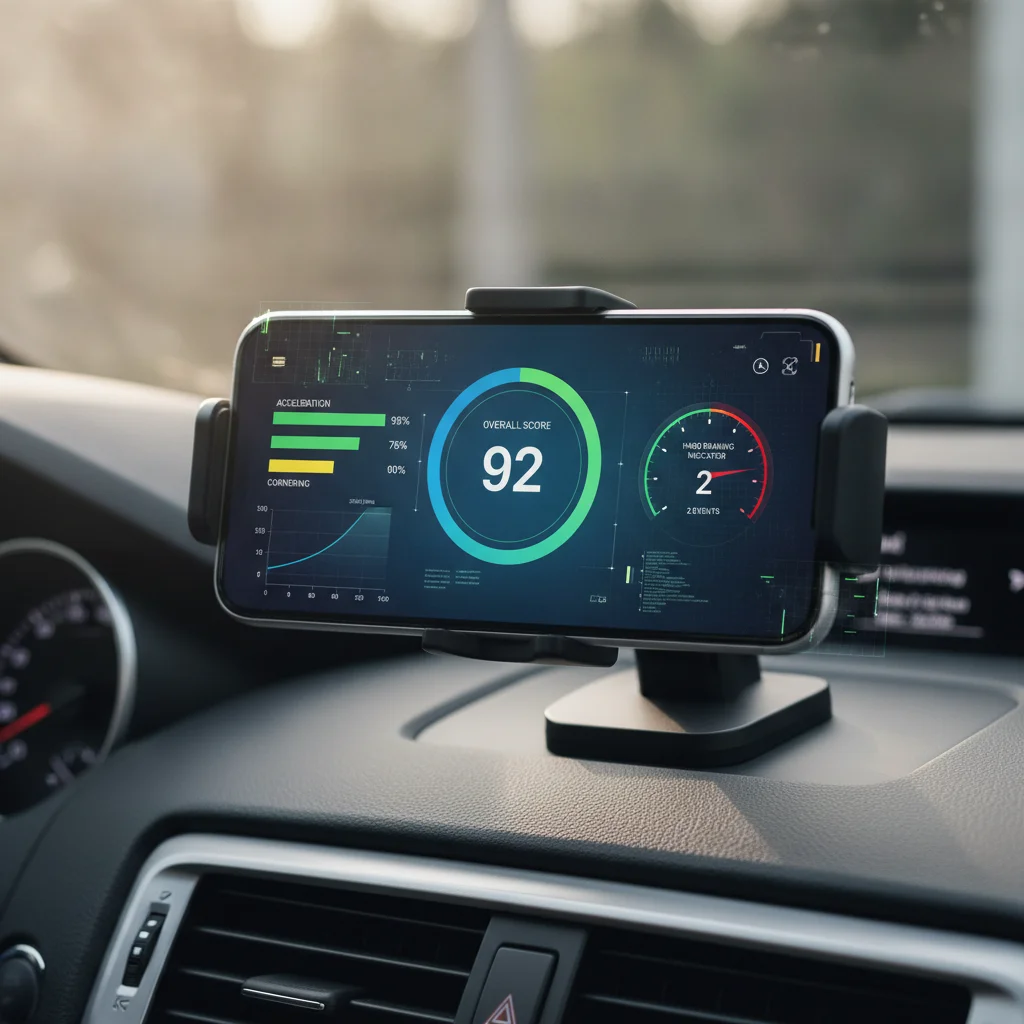
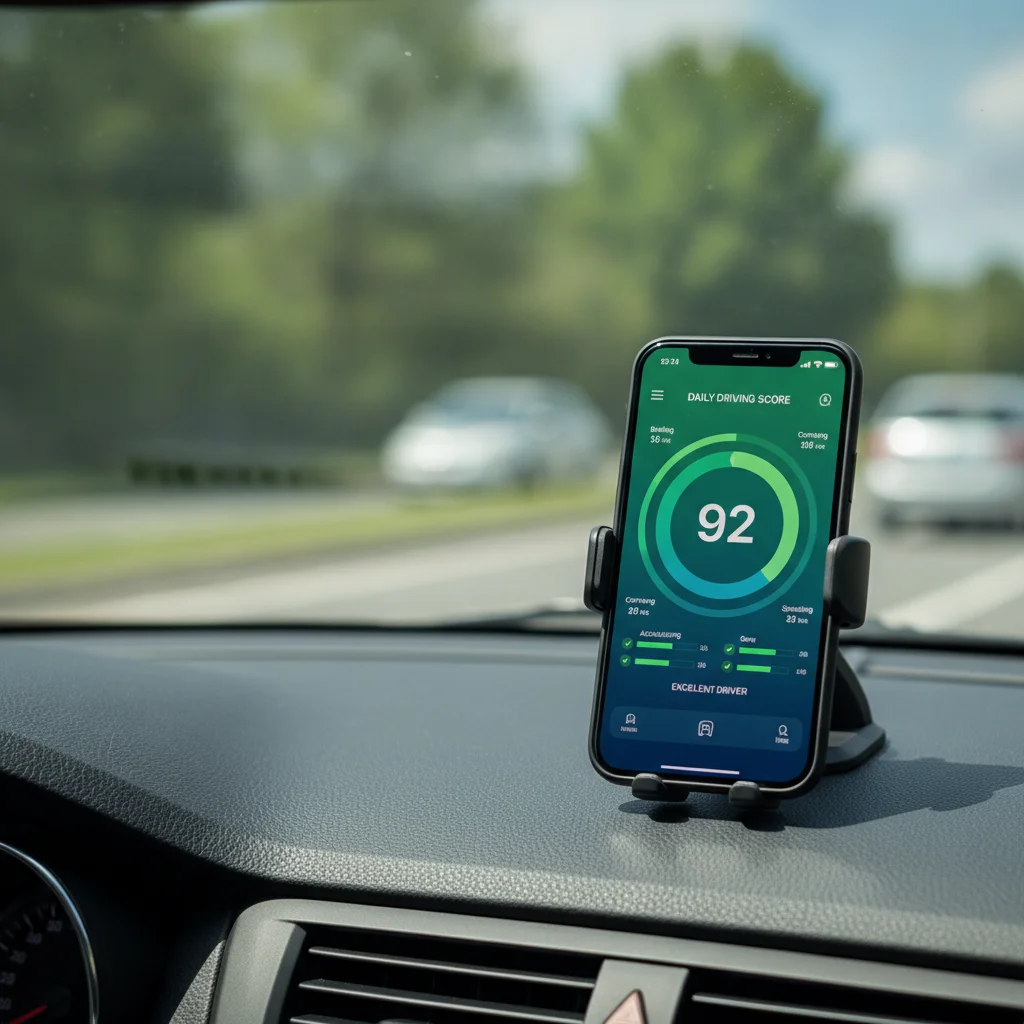
Telematics programs don't output a single raw number from sensor data. The behavioral signals described above are weighted, normalized, and combined into a composite score — usually displayed on a scale of 0 to 100 or as a letter grade. The weighting logic is proprietary to each insurer, but general patterns are discernible from published program documentation and industry research:
- Hard braking and hard acceleration are weighted most heavily — typically accounting for 40–60% of the composite score in programs that publish their methodology.
- Nighttime driving carries a weight disproportionate to its frequency for most drivers, since the risk per mile is significantly elevated.
- Speed events are factored in, though some programs exclude speed entirely for legal and regulatory reasons.
- Total mileage affects eligibility for low-mileage discounts as a separate calculation rather than feeding into the behavioral score directly.
The rate impact at the end of a monitoring period can range from a discount of 5% to 40% for top performers, to a surcharge of 10–20% for drivers who score poorly. Not all programs impose surcharges — some are discount-only — but the trend in the industry is shifting toward two-directional pricing where poor scores carry real cost consequences.
For strategies on performing well once you've enrolled, getting the most out of a telematics program without hurting your rate covers practical behavioral adjustments that actually move the needle.
Progressive Snapshot Program Details
Progressive publishes a detailed breakdown of how Snapshot scores driving behavior, including the thresholds used for hard-braking events and how the monitoring period affects your renewal rate.
NHTSA Crash Statistics by Time of Day
The National Highway Traffic Safety Administration's fatality analysis data lets you see how crash rates vary by hour, providing actuarial context for why nighttime driving penalties appear in telematics scoring.
J.D. Power Insurance Shopping Study
J.D. Power's annual insurance studies include data on telematics program satisfaction, average discount amounts, and how UBI participation affects policyholder retention — useful for benchmarking your own program experience.
Root Insurance Driving Test App
Root Insurance's app-first model lets you take a test drive before committing to a policy, giving you a real-time preview of how your driving behavior scores under a modern telematics system.
How Usage-Based Insurance Policies Compare to Traditional Coverage
An in-depth comparison of telematics programs versus standard auto insurance policies, covering tradeoffs in pricing, privacy, and suitability for different driver profiles.
What You Can — and Can't — Control
The most useful frame for working within a telematics program is separating the signals you can actively manage from those that reflect life circumstances rather than skill.
Highly Controllable
- Following distance: Maintaining three or more seconds of following distance is the single most effective behavioral change for reducing hard-braking events. At highway speeds, this means a gap of roughly 250–300 feet.
- Acceleration habits: Gradual throttle application from stops — allowing 4–5 seconds to reach 30 mph — eliminates nearly all hard-start events without meaningfully slowing your commute.
- Cornering speed: Deliberately reducing entry speed on turns, especially on ramps and curves, removes a risk signal many drivers don't even realize is being measured.
Partially Controllable
- Nighttime exposure: Shifting flexible trips away from the midnight–4 a.m. window reduces risk penalties, but some schedules don't allow that flexibility.
- Highway speed: Maintaining speeds at or just below the threshold flagged by your specific program protects your score on monitored segments.
Largely Outside Your Control
- Total mileage: Long-distance commuters or rideshare drivers face structural disadvantages in mileage-weighted programs regardless of their behavioral scores.
- Emergency braking: Unavoidable hard stops — a child running into the street, a sudden freeway slowdown — will register as events. Most programs have appeal or exclusion mechanisms, but they are rarely used proactively.
- Passenger phone use: App-based programs that detect phone handling cannot reliably distinguish between driver and passenger activity in all vehicles.
Telematics is not a perfect mirror of driving skill. It's a statistical approximation built from sensor signals. Understanding that distinction helps set realistic expectations — and points toward the behaviors most worth changing.

All claims are backed by peer-reviewed research. Sources on request.