Key Takeaways
Our Verdict
Usage-based insurance and traditional coverage offer the same core protection — liability, collision, comprehensive — but arrive at your premium by entirely different routes. UBI rewards demonstrably safe and low-mileage drivers with real savings, while traditional coverage gives everyone a predictable, stable rate regardless of how the app scored last Tuesday's commute. Neither is universally better; the right choice depends on how, when, and how much you actually drive.
| Best for | Recommended |
|---|---|
| Low-mileage drivers who rarely exceed 7,500 miles annually | Usage-Based Insurance |
| High-mileage commuters or those who frequently drive at night | Traditional Coverage |
| Privacy-conscious drivers unwilling to share behavioral data | Traditional Coverage |
| Young or new drivers looking to prove safe habits and offset high base rates | Usage-Based Insurance |
What Actually Separates These Two Policy Types
The phrase "usage-based insurance" gets thrown around loosely, but it describes a specific pricing mechanism — not a different class of coverage. Both UBI and traditional auto policies can include the same liability limits, collision, comprehensive, uninsured motorist protection, and optional add-ons like roadside assistance. What changes is how the insurer calculates your premium.
With a traditional policy, your rate is built from static risk factors: your age, ZIP code, vehicle type, credit score in most states, driving record, and claims history. The insurer runs your profile through actuarial models and assigns you a rate that reflects how people statistically similar to you have performed. You pay that rate for six or twelve months, and it changes only at renewal — assuming your record stays clean.
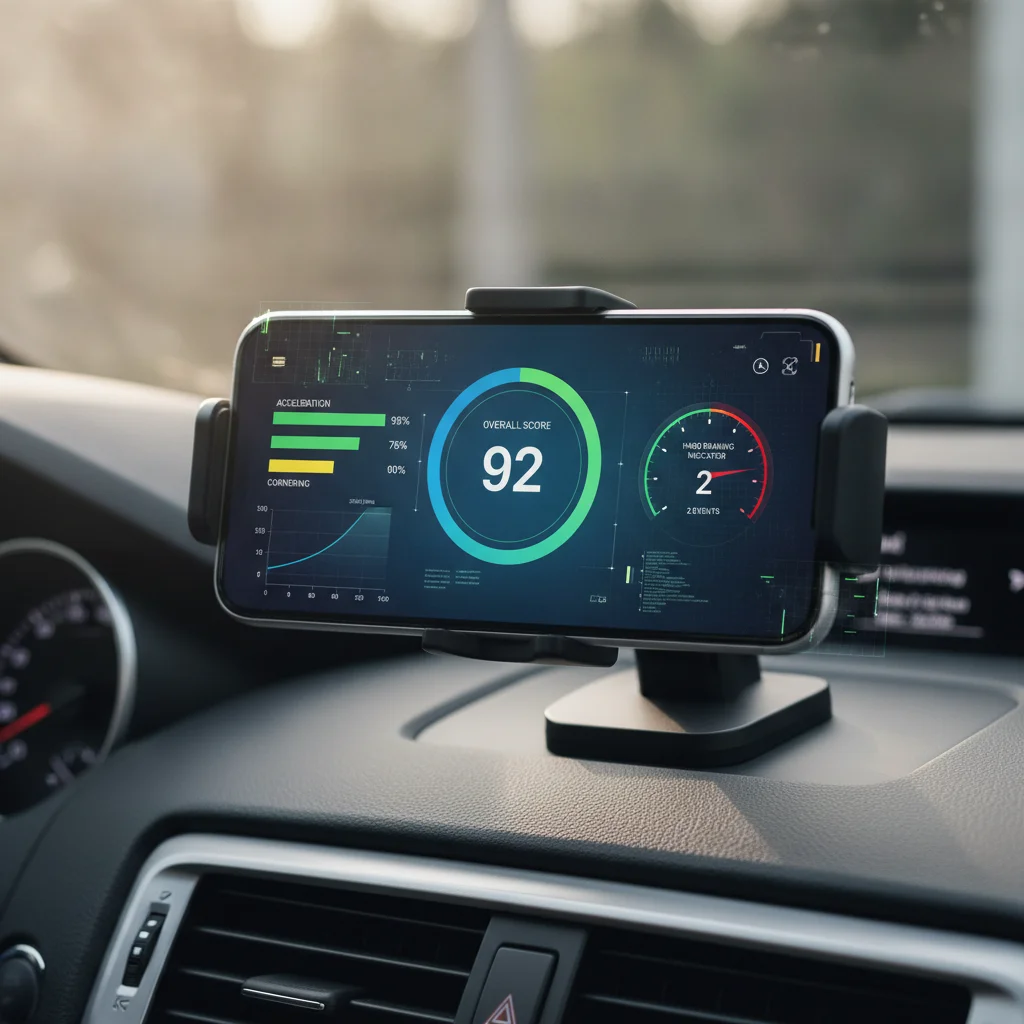
With a usage-based insurance (UBI) policy, your rate incorporates real-time or near-real-time behavioral data collected through a smartphone app, a plug-in OBD-II device, or — increasingly — through your car's factory-installed telematics hardware. The insurer scores you on variables like hard braking, rapid acceleration, cornering, phone handling while driving, time of day, and total miles driven. That score then modifies your base rate, either downward (discount) or in some programs, upward (surcharge).
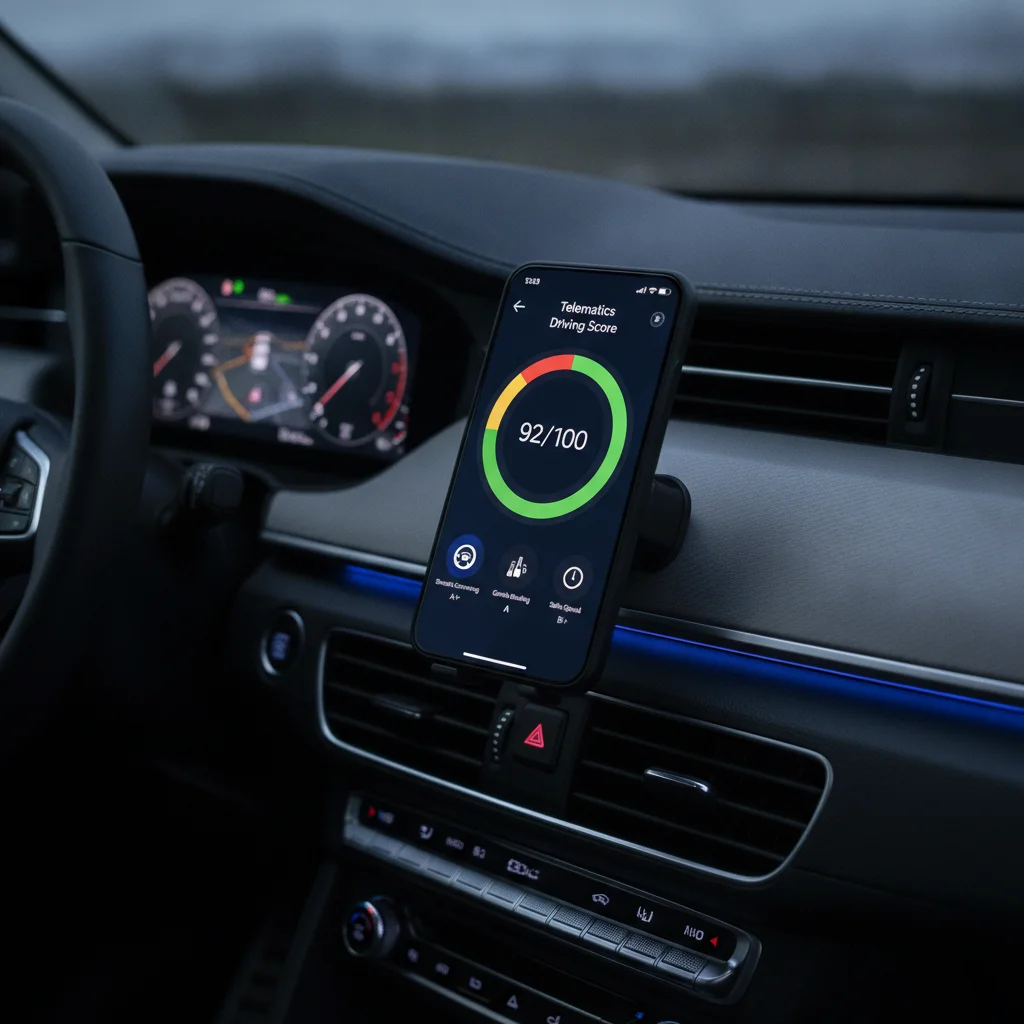
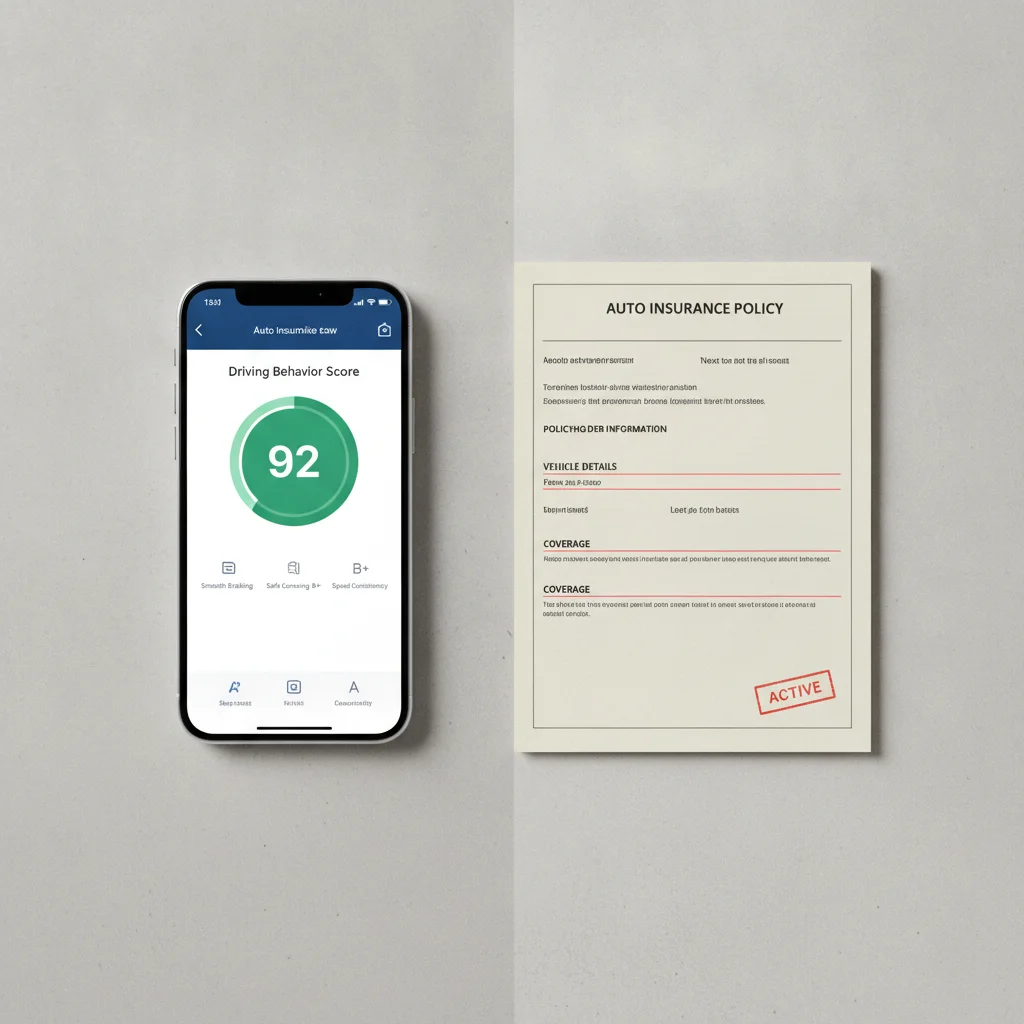
The key distinction most drivers miss: coverage quality is not the variable here. A UBI policy from a major insurer pays claims the same way a traditional policy does. What you're actually comparing is pricing transparency and behavioral risk-sharing — and whether you'd come out ahead or behind in that bargain.
How Pricing Mechanics Work in Each Model
Understanding how each model generates your bill is the most important part of this comparison. The numbers can look similar on day one and diverge dramatically over time.
Traditional Pricing: Stable but Imprecise
Traditional insurers group you with thousands of drivers who share your demographic and geographic profile. If young male drivers in your ZIP code file frequent claims, you pay for that statistical reality — even if you personally drive like a retired librarian. This is the core inefficiency of traditional pricing: good drivers subsidize bad ones within the same risk pool.
Your rate adjusts at renewal based on your personal claims history and any new violations, but day-to-day driving behavior is invisible to the insurer. That's either a feature or a bug, depending on your driving habits.
UBI Pricing: Personalized but Variable
Usage-based programs try to solve that inefficiency by individualizing the data. Most programs run an initial monitoring period — typically 90 days — then apply a discount based on your score. Insurers use telematics data to price your policy using a weighted algorithm that emphasizes hard braking and nighttime driving above other factors, since those correlate most strongly with accident risk.
The tricky part: not all UBI programs are structured the same way. There are three common models:
- Discount-only programs: Enrollment gets you a small upfront discount (usually 5–10%), and a safe monitoring period locks in a larger discount at renewal. Your rate can't go higher than the standard rate — the only direction is down. Progressive Snapshot historically worked this way in most states.
- Score-based two-way adjustment: Your final rate can go up or down based on your score. Drivers who perform poorly during the monitoring period end up paying more than they would have under a traditional policy. These programs carry real risk for high-mileage or aggressive drivers.
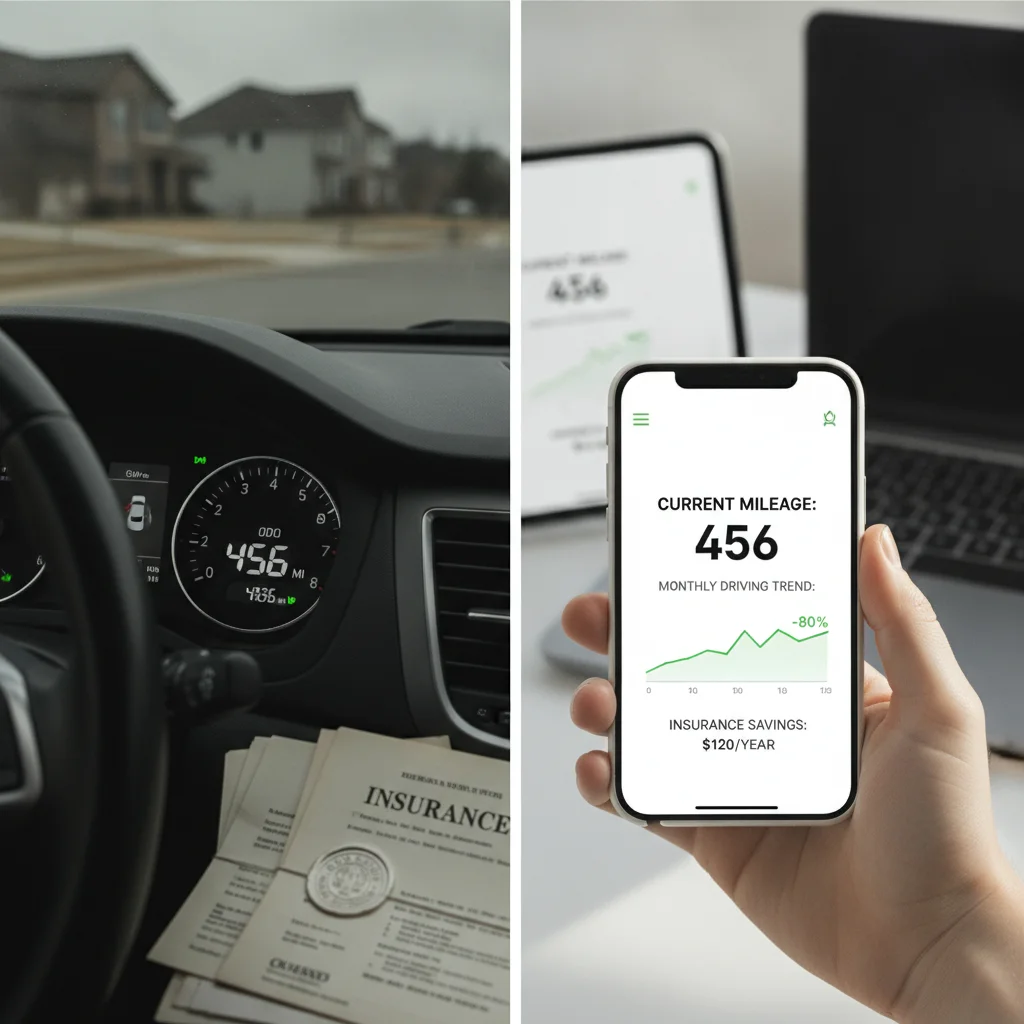
- Pay-per-mile: A hybrid model charging a flat monthly base rate plus a per-mile rate. Structurally different from behavioral scoring, though some programs combine both. Pay-per-mile vs. traditional coverage is its own comparison worth exploring if you drive under 7,500 miles a year.
| Traditional Insurance | UBI (Discount-Only) | UBI (Two-Way Adjustment) | Pay-Per-Mile | |
|---|---|---|---|---|
| Pricing basis | Demographics & history | Behavior scores (discount only) | Behavior scores (up or down) | Base rate + miles driven |
| Can rate increase from behavior? | No | No | Yes | Only if mileage rises |
| Data collection required | None ongoing | App or OBD device | App or OBD device | App or OBD device |
| Best savings potential | None (static pricing) | Up to 30% | Up to 40% | 40–50% for very low mileage |
| Privacy exposure | Minimal | Moderate | Moderate to high | Moderate (mileage + location) |
| Rate predictability | High | High after monitoring period | Low — score-dependent | Medium — mileage-variable |
| Best fit for | High-mileage or night drivers | Safe low-mileage drivers | Confident low-risk drivers | Under 7,500 miles/year |
Before enrolling in any program, confirm which model it uses. That single detail changes the risk calculus significantly.
What Telematics Actually Measures — and What Gets Scored
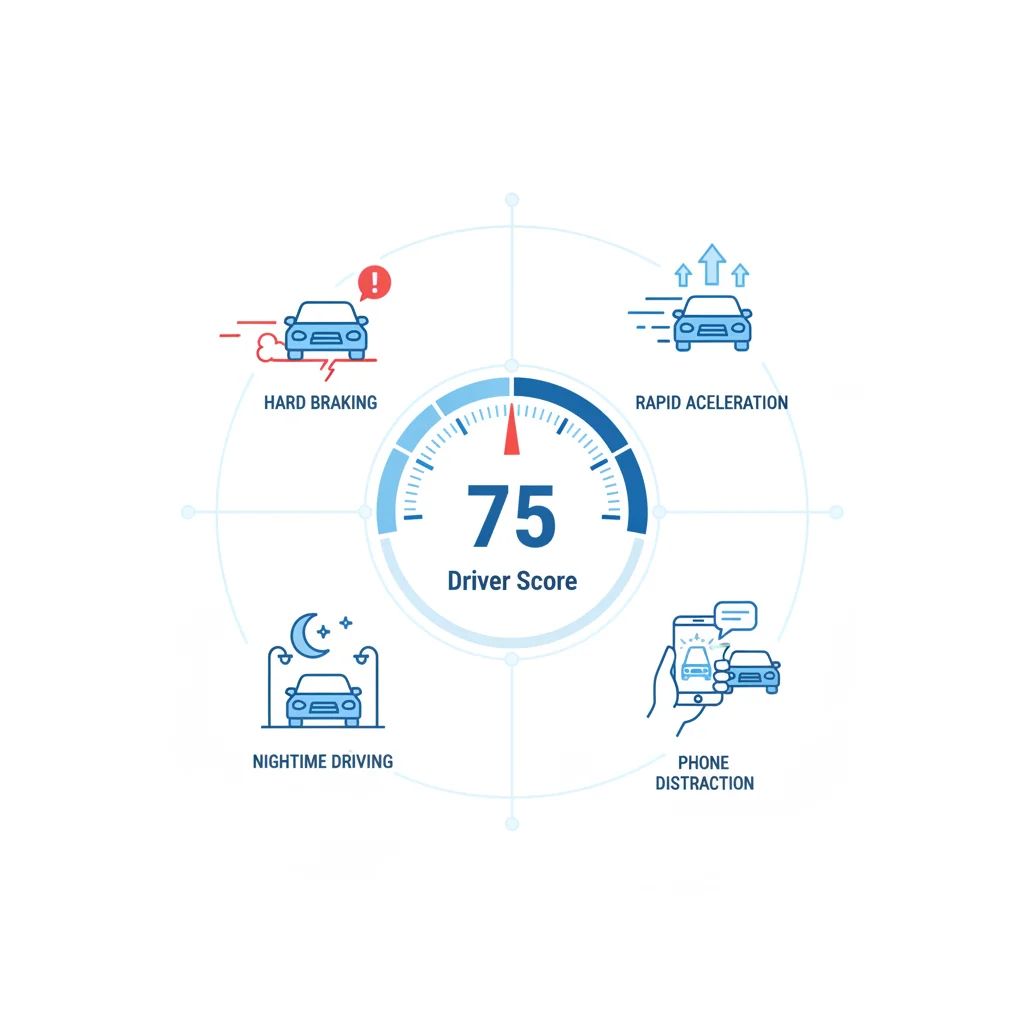
The behavioral signals that drive your UBI score are more granular than most drivers expect. It's not simply whether you speed — it's a composite of dozens of micro-behaviors aggregated over hundreds of trips. Telematics measures specific behaviors, not just speed, and some of those signals carry far more weight than others.
The factors most commonly scored across major programs include:
- Hard braking events — Deceleration beyond a set threshold (often 8–9 mph per second). This is consistently the highest-weighted negative factor across most insurers' algorithms.
- Rapid acceleration — Less predictive of accidents than braking, but still scored negatively.
- Time of day — Driving between midnight and 4 a.m. is heavily penalized. Accident rates spike during these hours regardless of individual behavior.
- Phone use while driving — Detected via app-based motion and sensor analysis. Some programs score this separately; others fold it into an overall distraction metric.
- Total mileage — More miles driven means more exposure to risk. High-mileage drivers rarely see UBI savings unless their behavioral scores are exceptional.
- Highway vs. surface street driving — Some programs differentiate by road type, since highway miles at consistent speeds are statistically safer than stop-and-go urban driving.
What doesn't get scored directly: your routes, your destinations, or the content of your conversations in the car. That said, location data is collected by most apps as part of trip reconstruction. If privacy is a concern, read the data retention and sharing policies before you opt in — they vary considerably between insurers.
Test Your Score Before You Commit
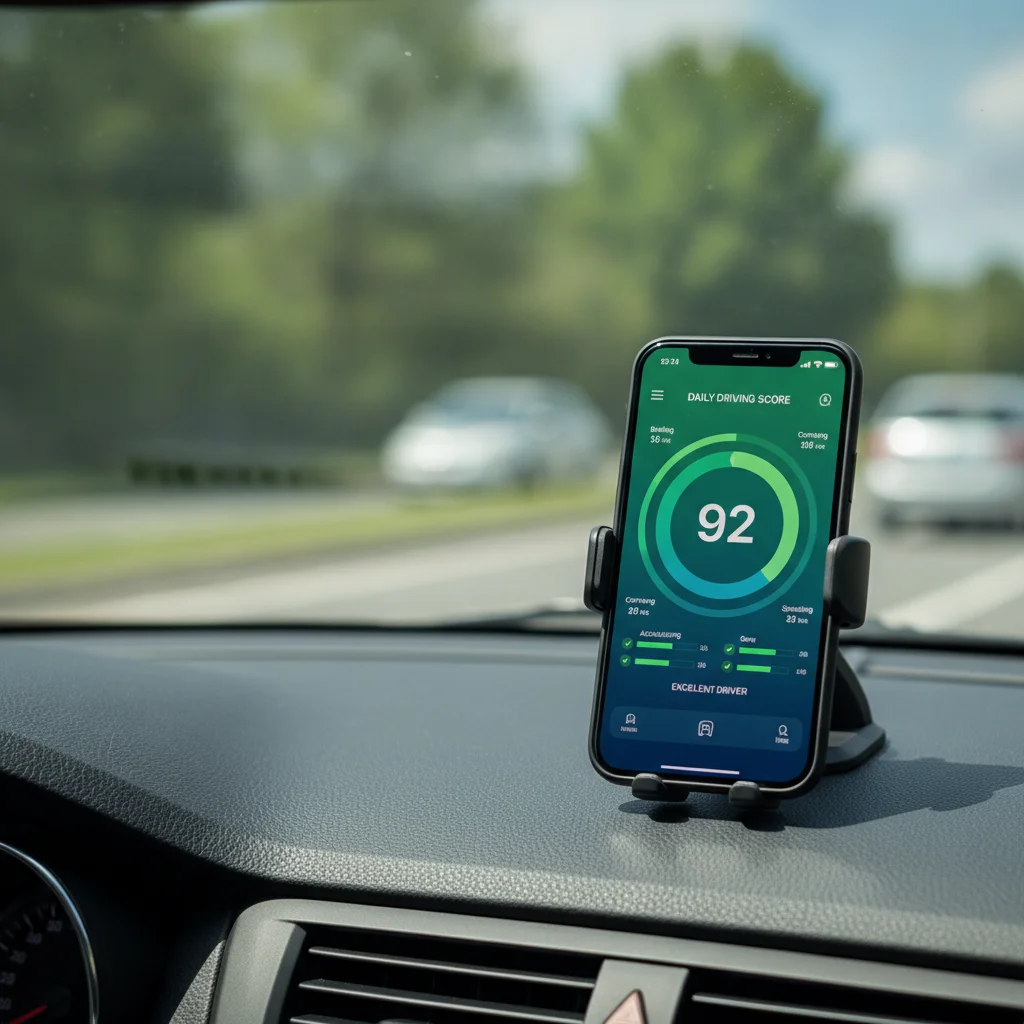
Most UBI programs allow you to monitor your score throughout the initial enrollment period — use that visibility actively. Drive normally for the first two weeks and check your scores. If you're consistently rating poorly on braking or time-of-day factors, you'll have data to decide whether to adjust your habits or exit the program before renewal. Don't wait until the monitoring period ends to review your performance.
Stacking Discounts Can Amplify Savings
UBI savings don't have to stand alone. Many insurers allow telematics discounts to stack with multi-policy, good student, or loyalty discounts. Before enrolling, ask your agent explicitly whether the UBI discount is additive or whether it replaces other discounts you currently receive. Losing a 15% loyalty discount to gain a 10% UBI discount is a net loss.
The Savings Potential: Realistic Numbers
Insurers market UBI programs heavily on savings potential, and the top-line numbers are real — for some drivers. The honest picture is more segmented.
~30%
Maximum UBI discount advertised by major insurers
Figures from Progressive, State Farm, and Allstate program marketing; average realized discounts are typically 10–15% for enrolled drivers.
20%
Share of U.S. drivers enrolled in some UBI program
According to a 2023 J.D. Power U.S. Auto Insurance Study, UBI adoption has roughly doubled in five years as smartphone-based programs replaced plug-in devices.
4x
Higher nighttime accident risk vs. daytime
NHTSA data shows fatal accident rates per mile driven are roughly four times higher between midnight and 4 a.m. than during daytime hours, which is why insurers weight time-of-day heavily.
$905
Average annual U.S. auto insurance premium (full coverage)
Based on 2024 Bankrate analysis; individual premiums vary significantly by state, vehicle, and driver profile — UBI savings are a percentage of this baseline.
The full savings potential of telematics programs depends on how you score relative to your insurer's benchmark — and that benchmark isn't published. You're essentially auditioned over 90 days without knowing exactly what passing looks like.
In practice, most enrolled drivers see modest discounts in the 5–15% range. The headline savings (up to 30–40%) are achievable, but they require consistently high behavioral scores across all tracked categories. Drivers who commute daily, drive in dense urban environments with frequent hard stops, or have young secondary drivers on the policy regularly see smaller discounts than projected — or no discount at all in two-way programs.
The comparison against traditional pricing also depends on your starting rate. A 25-year-old male driver with a clean record might pay $1,800/year on a traditional policy. A 30% UBI discount brings that to $1,260 — a meaningful $540 annual savings. But a 45-year-old driver already paying $900/year saves only $270 at the same discount percentage. The absolute dollar value of UBI savings is highest for drivers who face elevated base rates under traditional pricing.
Two-Way Programs Can Raise Your Premium
Not all UBI programs are discount-only. Some insurers reserve the right to increase your renewal rate if your behavioral score falls below their benchmark during the monitoring period. If you drive frequently at night, commute in heavy traffic, or share your vehicle with a teen driver who also gets scored, a two-way program can leave you paying more than a standard policy would have charged. Confirm the program structure in writing before you opt in.
Telematics Data Can Surface in Claims
If you're in an accident while enrolled in a UBI program, your insurer has access to your trip data from the moments surrounding the collision. That data can be factored into liability assessments and claims investigations. In most states, there are no explicit regulations prohibiting this use. Read your program's terms on claims data usage before you decide that a 20% discount is worth the tradeoff.
Privacy Tradeoffs and Data Transparency
No discussion of UBI is complete without addressing the data question directly. When you enroll in a telematics program, you're granting an insurer (and often its data partners) ongoing access to your vehicle's movement and behavioral data. What they do with that data beyond rate-setting varies by company and state regulation.
Some programs share anonymized data with third parties for research. Some retain trip-level data indefinitely. A few state insurance regulations restrict how long insurers can hold behavioral data and whether it can be used in claims investigations. Most don't have explicit protections. Before enrolling, it's worth reading three specific sections of the program's terms: data retention period, third-party sharing policy, and whether telematics data can be used in a claims dispute.
That last point matters more than most drivers realize. If you're in an accident and your insurer has telematics data showing hard braking or phone use in the minutes before the collision, that data could be relevant to a liability determination. It could work in your favor (you braked hard because the other driver cut you off) or against you (phone distraction signal logged at the time of impact). How major insurer safe driver programs actually work differs significantly on this point — it's worth comparing specific program terms.
Traditional insurance generates no behavioral data. Your insurer knows your history; they don't know your habits. For drivers who value that separation, the case for traditional coverage is straightforward regardless of potential savings.
Who Should Seriously Consider UBI — and Who Should Skip It
The decision isn't about which policy type is objectively better. It's about whether your specific driving profile benefits from behavioral pricing or gets penalized by it.
Strong Candidates for UBI
- Low-mileage drivers who drive under 10,000 miles annually and primarily during daytime hours on familiar routes.
- Remote workers or retirees who've reduced their driving significantly since their last renewal but whose traditional rate hasn't reflected that change.
- Young drivers in their mid-20s who are statistically penalized by age under traditional pricing and can demonstrate safe habits through scoring.
- EV drivers, who often already generate driving data through their vehicles' systems. Pairing EVs with usage-based insurance can produce meaningful savings if the driving profile fits.
Better Off with Traditional Coverage
- High-mileage daily commuters accumulating 15,000+ miles annually. Mileage is a direct risk factor; the savings math rarely works out.
- Frequent nighttime drivers — shift workers, rideshare drivers, or anyone whose schedule pushes them onto the road after midnight.
- Urban drivers in stop-and-go traffic where hard braking is routine and unavoidable, not a reflection of poor judgment.
- Privacy-conscious drivers who are uncomfortable with continuous location and behavioral data collection regardless of potential savings.
- Drivers with elevated base rates for non-behavioral reasons (credit score, ZIP code, vehicle type) who can't overcome those static factors with behavioral discounts.
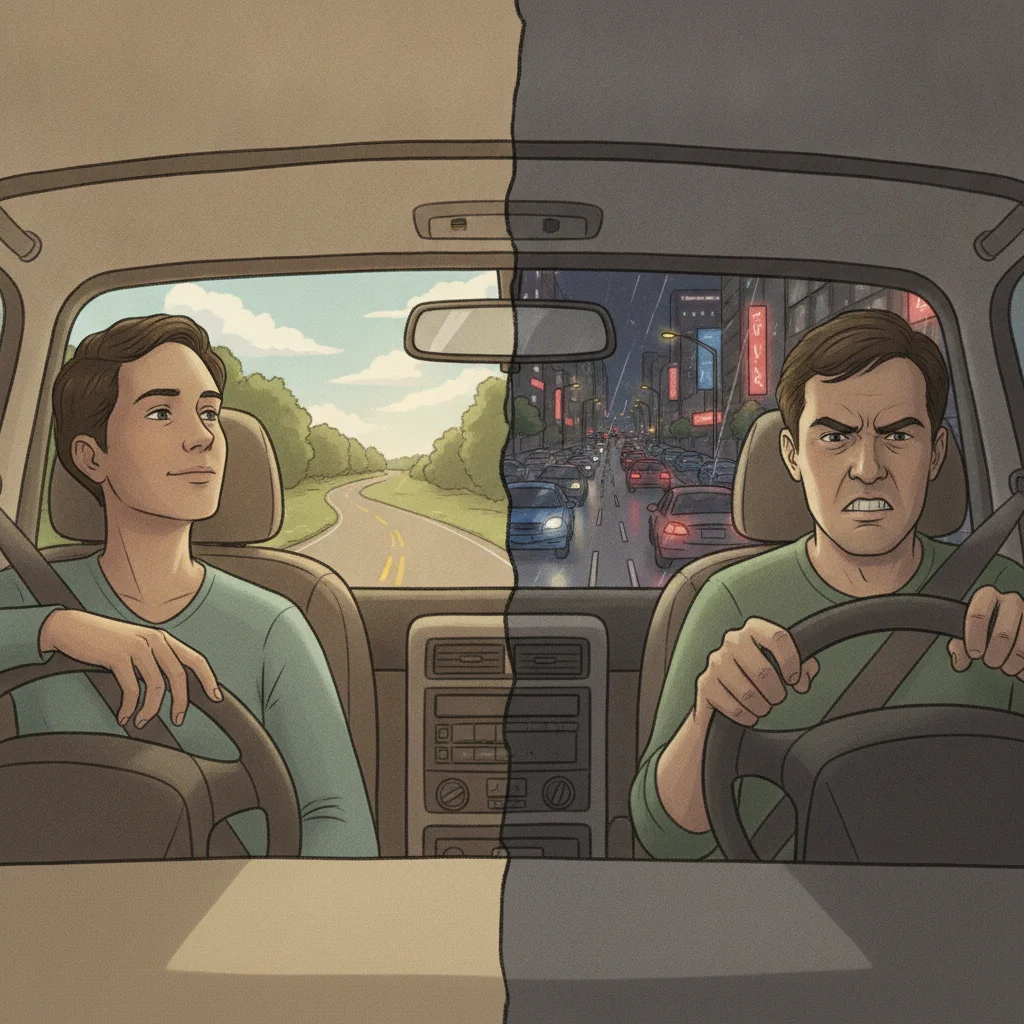
If you're on the fence, most UBI programs allow you to enroll and assess your score during the monitoring period before committing to a renewal. Use that window as a diagnostic — if your score is mediocre, opt out and stick with traditional pricing at renewal. For a detailed breakdown of how to navigate that process, see how to get the most from a telematics program without hurting your rate.
Making the Comparison: Beyond the Sticker Price
When shopping between a UBI offer and a traditional quote, resist the instinct to compare only the upfront premiums. The quoted UBI rate at enrollment is typically not the rate you'll pay after the monitoring period ends. Ask these questions before making a decision:
- Is this a discount-only program or a two-way adjustment? If your score can raise your rate, understand the maximum possible surcharge before agreeing to be scored.
- What does the insurer's average customer actually save? Advertised maximums and average outcomes are different numbers. Some insurers publish their average discount — ask specifically if they don't.
- How long is the monitoring period, and does scoring continue indefinitely? Some programs score you perpetually; others set your rate after an initial window. Perpetual scoring means a bad month can affect renewal pricing.
- What happens if you switch from phone app to OBD device mid-term? Data collection methods differ in accuracy and in what behaviors they detect. Know what you're agreeing to monitor.
- Does the program offer bundled discounts? Some UBI programs stack with multi-policy, multi-vehicle, or other discounts drivers commonly overlook. Others don't allow stacking.
The comparison that matters most isn't UBI versus traditional at a single moment in time. It's the projected 12-month cost under each model, accounting for your realistic driving habits — not your best-case driving habits. Be honest about your commute, your schedule, and how you actually drive when you're running late. That honest assessment will tell you more than any marketing comparison chart.

All claims are backed by peer-reviewed research. Sources on request.