
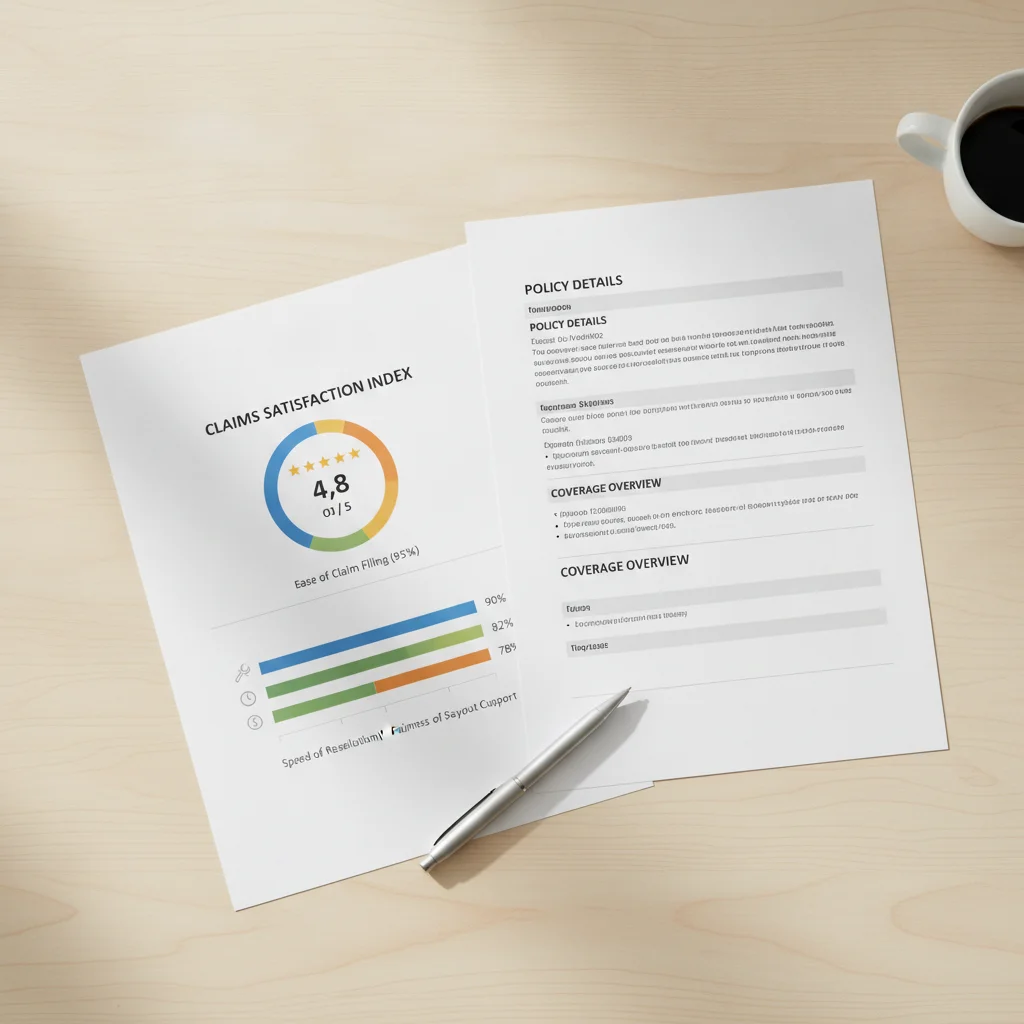
Key Takeaways
Why Claims Satisfaction Is the Metric That Actually Matters
When most drivers shop for car insurance, they go straight to price comparison sites, collect a handful of quotes, and pick the lowest number. That instinct is understandable — insurance feels like a commodity, and saving $200 a year is real money. The problem is that a policy's value isn't what you pay for it. It's what you get when something goes wrong.
Think about what insurance is actually for. You're not buying a product you plan to use on a Tuesday afternoon for fun. You're buying a financial backstop for one of the worst days you'll have as a driver — a collision, a theft, a hailstorm that totals your car. The quality of that backstop depends entirely on how your insurer handles claims. And that quality varies enormously from carrier to carrier.
Price comparison sites show costs but obscure coverage quality. An insurer can offer a low premium precisely because they make the claims process difficult — slow payouts, aggressive depreciation calculations, low settlement offers. You'll never see that in a quote.
This article walks you through a concrete process for evaluating insurers on claims quality alongside price, so you're making a genuinely informed decision rather than a cheap one.

What You Need Before You Start
This process uses free, publicly available data sources. You don't need to pay for any rating service or subscribe to anything. Here's what to have ready before you begin:
What you will need
Once you have these in place, set aside about 30–60 minutes. The research itself isn't complicated — it's mostly knowing where to look and what the numbers actually mean.
J.D. Power Auto Claims Satisfaction Study
Provides annual survey-based satisfaction scores for major insurers based on real claimants' experiences.
NAIC Consumer Information Source (content.naic.org)
Free government database that shows each insurer's complaint ratio adjusted for market share.
AM Best Financial Strength Ratings (ambest.com)
Industry-standard ratings that assess an insurer's financial ability to pay claims.
Your state's Department of Insurance website
Provides state-specific complaint data that may reveal regional performance issues not visible in national averages.
Spreadsheet or comparison table
Organizes premium, satisfaction, complaint, and financial data side by side for easy decision-making.
How to Compare Insurers on Claims Satisfaction
Follow these steps in order. Each one builds on the last. By the end, you'll have a side-by-side comparison of every insurer you're considering — not just their price, but their track record of actually delivering on their promises.
Collect quotes from at least three insurers
Start with price — it's a legitimate input, just not the only one. Get quotes from at least three insurers using identical coverage parameters: same liability limits, same deductible, same add-ons. If you change any variable between quotes, you're comparing different products. Use a single comparison tool or go directly to each carrier's site, but keep the inputs consistent.
Write down each quote alongside the insurer name and the exact coverage terms quoted. You'll be adding claims satisfaction data to this list in the next steps.
Look up each insurer's J.D. Power Auto Claims Satisfaction score
J.D. Power publishes an annual Auto Claims Satisfaction Study that surveys thousands of drivers who filed a claim within the past year. It covers key dimensions: first notice of loss, service interaction, appraisal, settlement, repair process, and rental experience. Go to jdpower.com and search for the most recent Auto Claims Satisfaction Study. Find each insurer you're evaluating and record their score and ranking relative to the industry average.
Note whether each insurer is rated "among the best," "better than most," "about average," or "the rest" — J.D. Power uses these segment labels to make relative performance immediately readable.
Check the NAIC Complaint Ratio for each insurer
The National Association of Insurance Commissioners (NAIC) maintains a free public database called the Consumer Information Source at content.naic.org. Search for each insurer by name, select "Auto" as the line of business, and find their complaint ratio — a number that compares their complaint volume to the industry median, adjusted for market share.
A complaint ratio of 1.00 means the insurer generates exactly the median number of complaints per premium dollar written. Ratios above 1.50 are a yellow flag; ratios above 2.00 are a red flag. Record each insurer's ratio next to their J.D. Power score.
Check AM Best financial strength ratings
An insurer's claims satisfaction score tells you how they treat claimants. Their financial strength rating tells you whether they can afford to pay those claims at all. AM Best is the industry standard for insurance financial strength. Go to ambest.com and search each insurer. Look for their Financial Strength Rating (FSR).
Ratings of A, A+, or A++ indicate strong financial health. A- and B++ are generally acceptable. Anything below B+ warrants scrutiny, especially if you're carrying high liability limits or insuring a vehicle with significant replacement value.
Check your state insurance department's complaint data
National complaint ratios are useful benchmarks, but your state's insurance department publishes complaint data specific to your market. Go to your state's department of insurance website (searchable via the NAIC's state map at naic.org) and look for their consumer complaint comparison tool or annual report. Filter for auto insurance and compare the carriers you're evaluating.
State-level data can surface regional issues — a carrier that handles claims well in low-catastrophe states may perform poorly in areas prone to hail, hurricanes, or high theft rates.
Build a side-by-side comparison and weight the metrics
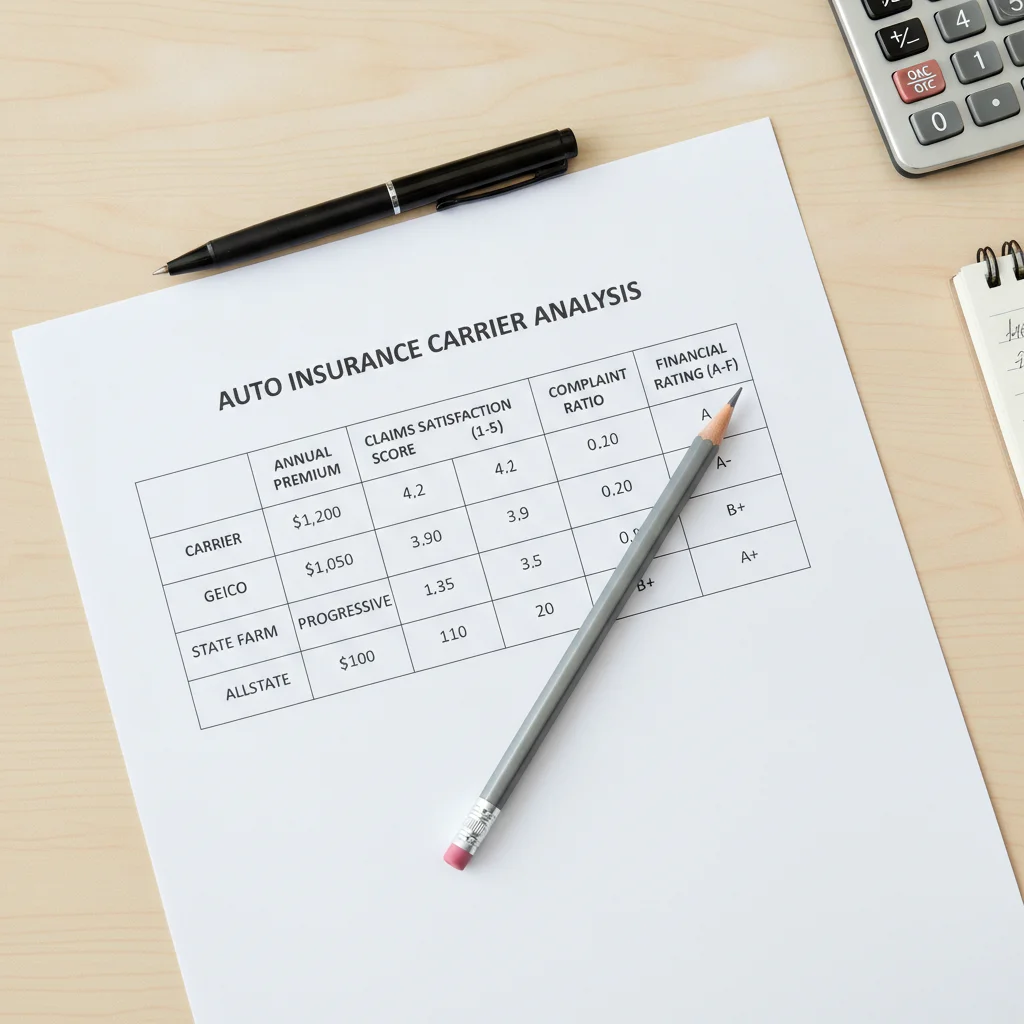
You now have four data points per insurer: annual premium, J.D. Power claims satisfaction score, NAIC complaint ratio, and AM Best financial strength rating. Put them in a simple table — a spreadsheet or even a piece of paper works fine.
How you weight these factors depends on your situation. If you're driving a paid-off older car with minimal coverage, financial strength matters less than if you're carrying full coverage on a $45,000 vehicle. If you've filed claims before and experienced adjuster disputes, J.D. Power and complaint ratios deserve heavy weight. If you've never had a claim and your primary concern is price, weight accordingly — but at least do it consciously.
Reading the Data: What Good and Bad Scores Actually Mean
Once you've collected scores across multiple sources, you need to know how to interpret them together. No single metric tells the whole story.
J.D. Power Scores
J.D. Power's Auto Claims Satisfaction Study scores insurers on a 1,000-point scale. Scores above 880 are generally strong; anything below 850 should prompt closer scrutiny. More important than the raw score is where an insurer lands relative to the industry average, which J.D. Power publishes alongside results. A carrier scoring 20+ points below the segment average is a meaningful red flag.
NAIC Complaint Ratios
The National Association of Insurance Commissioners publishes a complaint ratio for every licensed insurer in the country. A ratio of 1.00 is the national median — meaning that insurer generates exactly as many complaints per premium dollar as the average carrier. Ratios above 1.50 indicate meaningfully elevated complaint volume. Ratios above 2.00 are serious warning signs. You can find this data free at the NAIC Consumer Information Source.
AM Best Financial Strength Ratings
AM Best rates insurers on their ability to meet ongoing financial obligations — essentially, can they actually pay claims? Ratings of A or higher (A, A+, A++) indicate strong financial health. B++ is acceptable. Anything below B+ deserves caution, particularly if you're insuring a high-value vehicle or carrying significant liability limits. Learn how to read financial strength ratings before committing to a policy.
State Insurance Department Reviews
State-level complaint data gives you a geographically relevant view that national aggregates can miss. An insurer that performs well nationally might have a poor track record in your state — sometimes due to regional catastrophe handling or local claim adjuster quality. Most state insurance department websites publish complaint data by insurer and line of business.
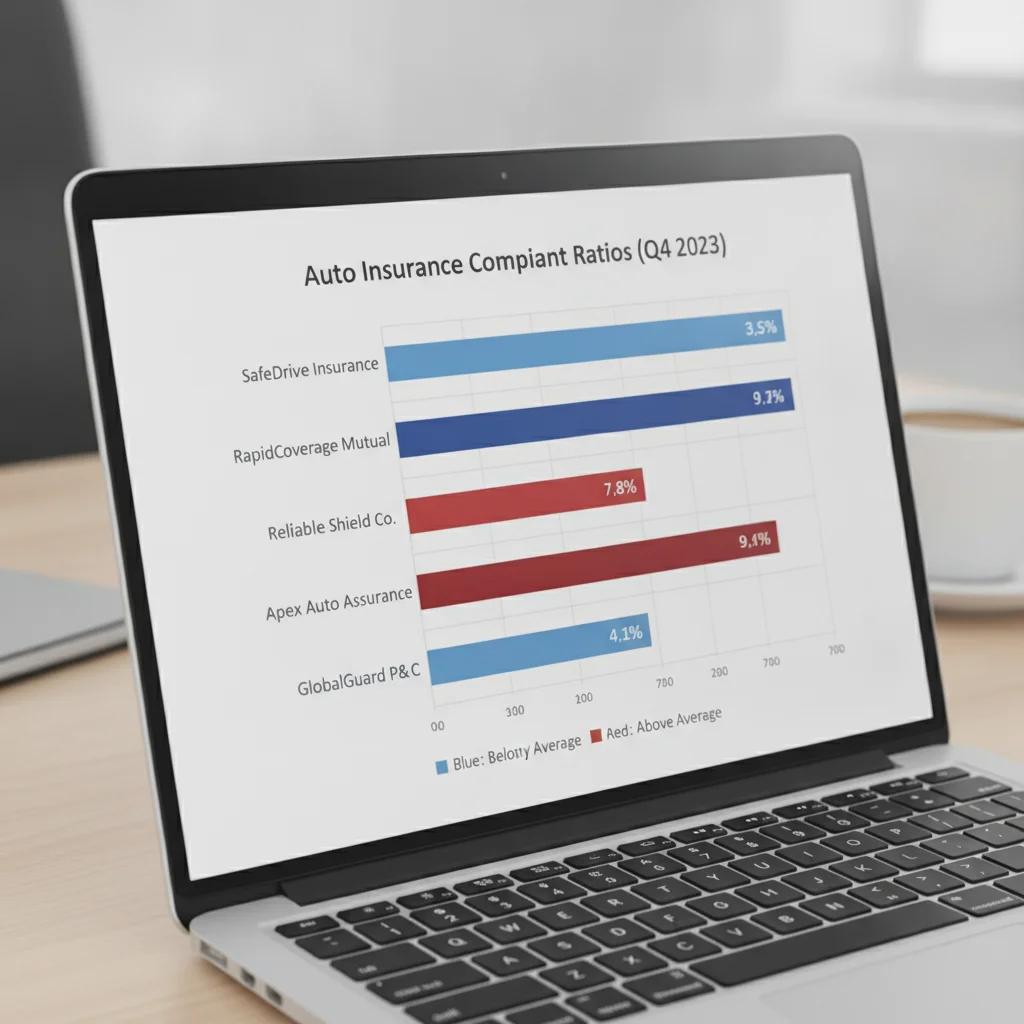
Cross-Reference Multiple Sources
No single data source gives you the complete picture. J.D. Power surveys real claimants but only covers larger carriers. NAIC complaint ratios cover all licensed insurers but don't capture satisfaction among drivers who didn't complain. AM Best tells you about solvency, not service quality. Use all three together — and add state data for local context — to get a genuinely reliable assessment.
When an insurer scores poorly on complaints but offers a significantly lower premium, that gap is telling you something. The savings may be real upfront — but the cost often surfaces later, in lower settlements, slower repairs, or protracted disputes over fault. Understanding what adjusters look for can help you advocate for a fair settlement — but your starting position is much better with a carrier that settles fairly in the first place.
Common Pitfalls When Evaluating Insurer Quality
A few mistakes show up repeatedly when drivers try to do this kind of research. Knowing them in advance saves you from drawing the wrong conclusions.
Confusing name recognition with quality
Large insurers spend heavily on advertising. Brand familiarity is not a claims satisfaction signal. Some of the most heavily marketed carriers in the U.S. score below industry average on J.D. Power's claims study. Look at the data, not the jingle.
Treating reviews as representative samples
Online reviews skew toward extreme experiences. People who had a smooth, fast claim rarely bother writing about it. People who felt wronged almost always do. Aggregate satisfaction data from structured surveys — like J.D. Power, which surveys thousands of actual claimants — is far more reliable than star ratings on review sites.
Ignoring your specific coverage type
J.D. Power's auto claims study looks at the overall claims experience. But if you drive an EV, your claims profile involves different considerations — battery damage, specialized parts, longer repair cycles. Learn how to evaluate EV-specific coverage details that standard comparison tools often miss.
Not accounting for repair shop access
Claims satisfaction is partly shaped by how quickly and cleanly repairs get done. Some insurers maintain networks of preferred repair shops with pre-negotiated rates and guaranteed quality. Others leave you to figure it out yourself. Insurers may steer you toward preferred shops, but you often have the right to choose your own.
Online Reviews Are Not Satisfaction Data
Yelp and Google reviews for insurance companies are systematically skewed toward negative experiences. A carrier with 2.5 stars on a review site might have an above-average J.D. Power claims satisfaction score — because the vast majority of satisfied claimants never wrote a review. Don't substitute anecdotal reviews for structured survey data when making a coverage decision.

Putting It All Together Before You Switch
Once you've run through this process for each insurer you're evaluating, you should have a comparison that looks something like this:
| Insurer | Annual Premium | J.D. Power Score | NAIC Complaint Ratio | AM Best Rating |
|---|---|---|---|---|
| Carrier A | $1,240 | 891 (above avg) | 0.82 | A+ |
| Carrier B | $1,080 | 847 (below avg) | 1.74 | A- |
| Carrier C | $1,190 | 873 (at avg) | 1.05 | A |
In this example, Carrier B is the cheapest by $160 per year — but its claims satisfaction score is meaningfully below average and its complaint ratio is more than double Carrier A's. That's a $160 savings in exchange for significantly higher odds of a frustrating claims experience. Whether that trade-off is worth it is your call, but at least now you're making it with full information.
Before finalizing any switch, run through a coverage-level audit as well. Common myths about what your policy covers can hurt your claim outcome, and switching without checking coverage limits, exclusions, and deductibles can leave you exposed. Use this checklist to audit coverage limits, exclusions, discounts, and claim service quality before moving to a new insurer.
Also be skeptical of switching savings promises. Ads promise hundreds in savings when you switch — here's what those claims actually mean. The advertised savings are real for some drivers and irrelevant for others; always get a quote that reflects your actual driving profile before assuming the number applies to you.
Don't Switch Without Verifying Coverage Continuity
Switching insurers to save money can inadvertently reduce your coverage if you don't verify every line item. A new policy might carry a higher deductible, lower liability limits, or exclude an endorsement you relied on — like rental reimbursement or gap coverage. Always confirm that your new policy matches or improves on your current coverage before canceling your existing policy. Never let your old policy lapse before the new one is confirmed active in writing.

All claims are backed by peer-reviewed research. Sources on request.