Key Takeaways
Option A
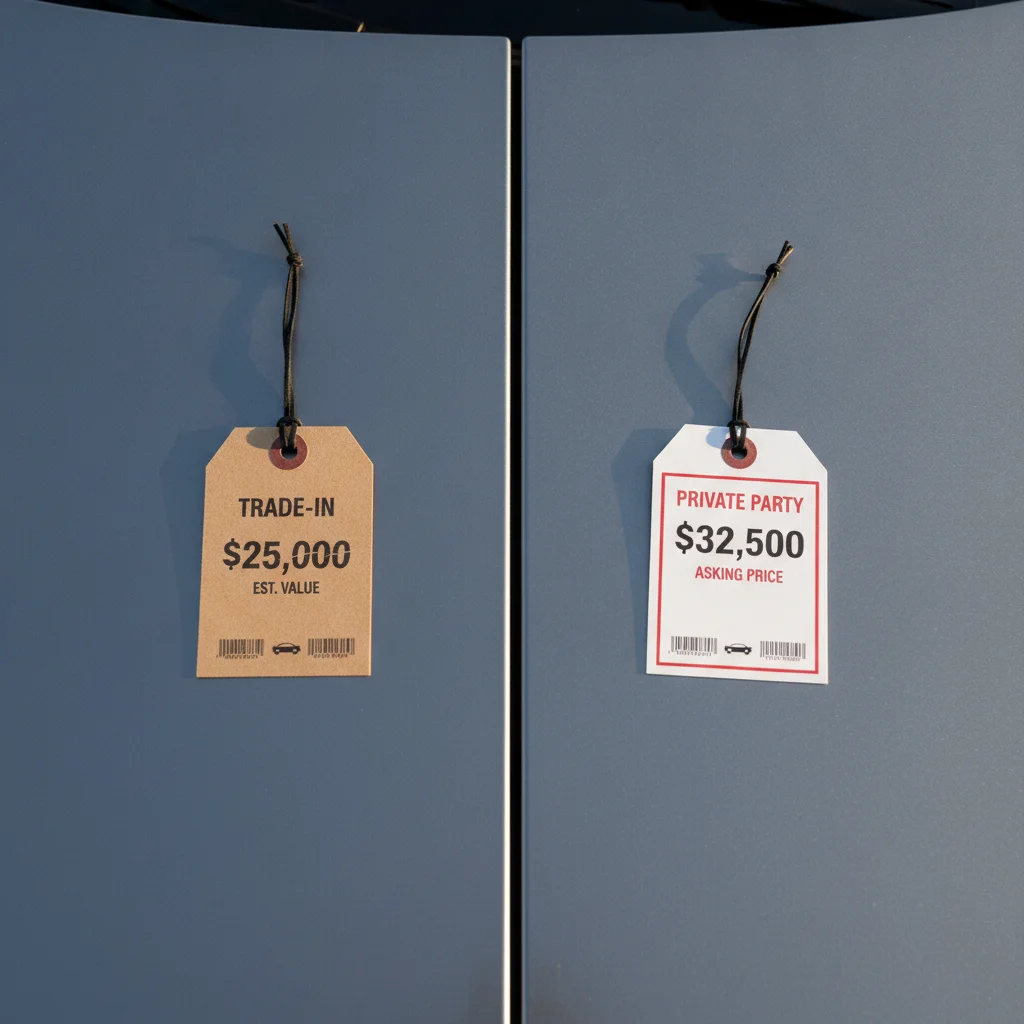
Private Party Value
The higher number most sellers never fully capture.
Best for: Sellers willing to list, show, and negotiate directly with individual buyers to maximize net proceeds.
Option B
Trade-In Value
The convenient, lower-yield path through a dealership.
Best for: Sellers who prioritize speed, simplicity, and rolling equity directly into a new vehicle purchase.
If you want to maximize the dollar amount from your vehicle
Private Party Value
The private party channel consistently returns more cash, often enough to cover several months of loan payments on your next vehicle.
If you're buying another car at a dealership immediately
Trade-In Value
Trading in is seamless, and in many states the trade-in offsets the taxable sale price of your new purchase, partially closing the gap.
If your car has high mileage, cosmetic damage, or mechanical issues
Trade-In Value
Dealers are better positioned to absorb problem vehicles; private buyers discount aggressively for condition issues and may walk away entirely.
If your vehicle is a popular model in strong local demand
Private Party Value
High-demand vehicles command premium private party prices, and motivated individual buyers often pay at or above guidebook estimates.
If you need to sell within a week
Trade-In Value
Dealer offers close in hours; a private sale realistically takes one to four weeks depending on price, condition, and listing quality.
Why the Same Car Has Two Very Different Price Tags
Pull up Kelley Blue Book or Edmunds for any used vehicle and you'll immediately see the problem: there's a private party value, a trade-in range, and sometimes a dealer retail estimate. Most sellers glance at the highest number, assume that's what their car is worth, and start from there. That's how they end up disappointed — or worse, accept a dealer offer that's $3,000 below what the market would actually pay.
These aren't interchangeable figures. Each one represents a specific transaction type, a specific set of costs, and a specific group of buyers. The private party value assumes you're selling directly to an individual. The trade-in value assumes you're handing keys to a dealer who will then recondition and resell the vehicle at a profit. Conflating them is one of the most expensive mistakes sellers make.
Before you price your listing or walk into a dealership, you need a clean understanding of what each number represents, how it's calculated, and which one actually applies to your situation. The valuation terminology guide covers the full vocabulary — this article focuses on the specific contrast between these two numbers and what that gap means in real dollars.
How Each Value Is Calculated — and Why They Diverge
Valuation platforms build their estimates from a mix of wholesale auction data, dealer transaction records, and private-listing sale prices. The critical difference is which slice of that data feeds each estimate.
Private Party Value
Private party value is derived from actual completed sales between individual sellers and individual buyers — listings on platforms like Craigslist, Facebook Marketplace, and AutoTrader where no dealer intermediary is involved. It reflects what a private buyer, shopping on their own time, is willing to pay after inspecting the vehicle and sometimes negotiating. The number already factors in typical haggling: most guidebook private party values represent a realistic transaction price, not the aspirational asking price you'll see in listings.
Because there's no dealer overhead baked in, private party values are structurally higher. The seller keeps margin that would otherwise go to the dealership.
Trade-In Value
Trade-in value is anchored in wholesale data — what dealers bid at auction and what they offer consumers at the counter. Dealers price trade-ins below private party market value for concrete business reasons:
- Reconditioning costs: Most vehicles need detailing, minor repairs, and a safety inspection before going on the lot. Budget $500–$1,500 for average vehicles, more for older or high-mileage ones.
- Carrying costs: The car sits on their lot, depreciating slightly and tying up capital, typically for 30–60 days.
- Retail profit margin: Dealers need room between acquisition cost and retail sale price to run a business.
- Market risk: If demand softens before they sell, they absorb the loss.
Strip all of that out, and the trade-in offer is structurally discounted — not because the dealer is being unfair, but because these are real costs they're accepting that a private buyer doesn't.
| Criterion | Private Party Value | Trade-In Value |
|---|---|---|
| Who pays you | Individual buyer | Dealership |
| Typical price vs. retail | 10–20% below dealer retail | 20–35% below dealer retail |
| Average gap between the two | Higher by $1,500–$5,000+ | Lower baseline |
| Time to close | 1–4 weeks typically | Same day |
| Logistics complexity | High — listing, showings, title transfer | Low — one appointment |
| Best condition for this channel | Clean, documented, popular models | High mileage, issues, niche vehicles |
| Sales tax benefit on next purchase | None | Yes, in most states |
| Price negotiation | Direct with buyer | With dealer (often bundled with new car deal) |
| Who absorbs reconditioning cost | Seller (disclosed or discounted) | Dealer |
$3,100
Average private party vs. trade-in gap
Edmunds data consistently shows the private party value exceeds trade-in value by roughly $2,500–$3,500 on mainstream used vehicles in average condition.
30–45 days
Average private sale listing to close
Industry estimates from platforms like AutoTrader suggest the median private party vehicle sale closes within 30–45 days of first listing.
7%
Average U.S. auto sales tax rate
The combined average state and local auto sales tax in the U.S. sits near 7%, making the trade-in tax offset significant for higher-value vehicles.
18%
Typical dealer gross margin on used vehicles
According to NADA data, used vehicle dealer gross profit margins average around 15–20%, explaining why trade-in offers sit well below private party values.
The Real Dollar Gap: What the Data Shows
The spread between private party value and trade-in value varies by vehicle segment, age, and market conditions, but the pattern is consistent. For a mainstream used sedan with 60,000 miles in good condition, the gap typically runs $1,500–$3,500. For trucks and SUVs in high demand, it can push past $5,000. For older vehicles or those with mechanical concerns, the gap can widen further because dealers apply more aggressive reconditioning buffers.
Here's a concrete example: A 2020 Honda CR-V EX AWD with 55,000 miles in clean condition might show a KBB trade-in range of $22,500–$24,500 and a private party value around $26,500–$28,000. The midpoint difference is roughly $3,000–$4,000. If you're in a state without a trade-in sales tax credit, you pocket that entire difference by selling privately. If your state does offer a tax credit on the trade-in amount, the effective gap shrinks — often to $1,000–$2,500 — but rarely disappears entirely.
That tax credit calculation is worth doing before you decide anything. Understanding trade-in value vs. market value walks through exactly how to run that math for your state.
The Tax Credit Varies Significantly by State
Not every state offers a trade-in sales tax credit. States like California and Hawaii do not reduce the taxable purchase price based on trade-in value, which makes private party sales relatively more attractive there. Always check your state's DMV or department of revenue policy before assuming the tax offset applies. This one factor can shift the break-even calculation by over $1,000.
Condition Categories Matter More Than Most Sellers Realize
Valuation tools typically use four condition tiers: Excellent, Good, Fair, and Poor. Most sellers rate their vehicle one tier higher than buyers and dealers will. Plugging in 'Good' when your car realistically grades 'Fair' can inflate your private party estimate by $800–$1,500. Run the valuation in the condition category a picky buyer would assign, not the one that makes you feel best about your car.
Which Valuation Tools Report Which Numbers — and How to Read Them
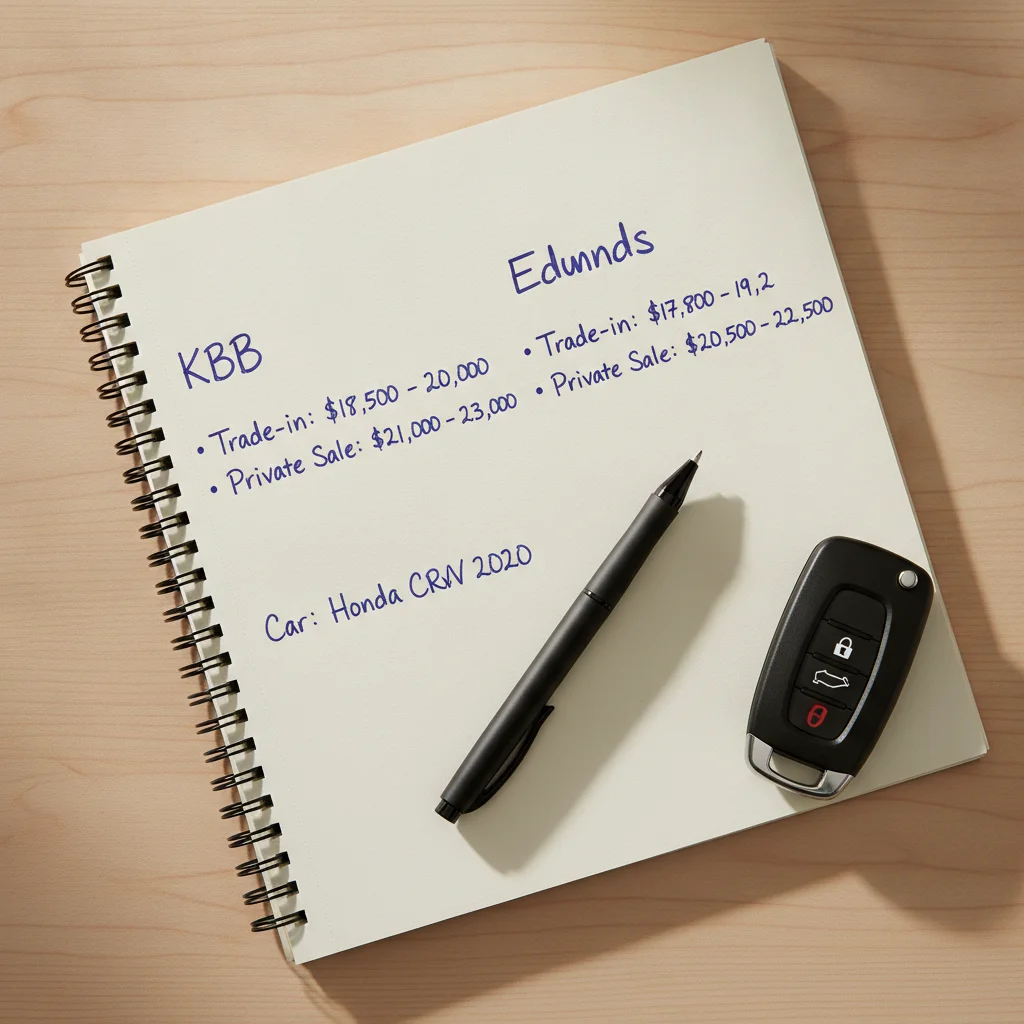
The two dominant resources are Kelley Blue Book (kbb.com) and Edmunds. Both report multiple value types, but they present them differently, and sellers frequently misread the outputs.
Kelley Blue Book
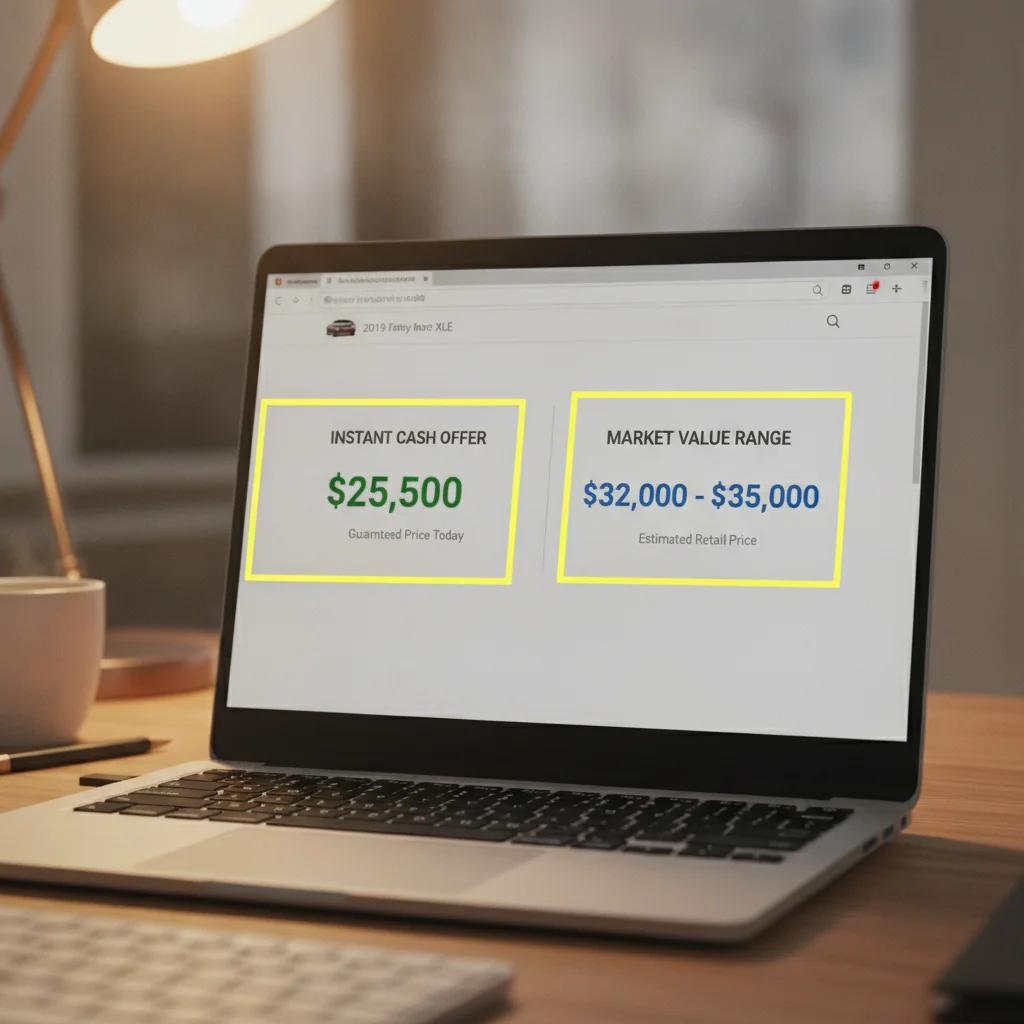
KBB surfaces three primary consumer-facing numbers: the private party range, the trade-in range (low to high), and the KBB Instant Cash Offer, which is a real dealer bid you can take to participating locations. The private party range is the most useful benchmark if you're selling on your own. KBB adjusts for condition via a questionnaire — be honest, because buyers will negotiate hard against any overstatement. The trade-in range gives you a floor for dealer negotiations.
Edmunds
Edmunds calls their figures True Market Value (TMV). They report private party price, trade-in value, and dealer retail separately. Edmunds TMV tends to weight recent regional sales data more heavily, which can make it more accurate in volatile markets. If KBB and Edmunds diverge significantly for your vehicle, that spread itself is informative — it signals either data uncertainty or a rapidly shifting market.
How to Use Both Together
- Run your vehicle through both tools in the same condition category.
- Note the private party range from each source.
- Note the trade-in range from each source.
- Use the overlap between the two tools as your working benchmark — if KBB says $26,000–$28,000 private party and Edmunds says $25,500–$27,500, your realistic private party target is $26,000–$27,500.
- The trade-in ranges from both tools give you the minimum you should accept from a dealer before walking out.
For a deeper look at how these values are calculated and why they sometimes conflict, see what private party value actually means.
Factors That Widen or Narrow the Gap
The private party vs. trade-in spread isn't fixed. Several variables push it in either direction, and understanding them helps you decide which channel makes sense for your specific vehicle.
Factors That Widen the Gap (favoring private sale)
- Popular models with strong private demand: Trucks, three-row SUVs, and reliable commuter cars get multiple private offers. Dealers know this and shade their trade-in offer down because they know you have options.
- Clean title, single owner, full service history: Private buyers pay a premium for documented peace of mind. Dealers treat service records as expected, not premium.
- Low mileage for the year: Private buyers respond to below-average mileage more aggressively than dealers, who are primarily working from auction comps.
Factors That Narrow the Gap (favoring trade-in)
- Mechanical issues or known defects: Private buyers discount hard and may walk away. Dealers absorb the risk at scale with in-house mechanics.
- Unpopular or niche vehicles: Limited private buyer pool means fewer competing offers and slower sale timelines.
- Body damage or high cosmetic wear: Similar to mechanical issues — private buyers are harsh on visible problems.
- Significant remaining loan balance: Managing a private sale payoff is logistically complex. Many sellers find the trade-in path cleaner when there's a lienholder involved.
If you want to think through the full decision — not just the numbers but the logistics — the dealer trade-in vs. private party sale comparison covers both the financial and time trade-offs in detail.
Making the Decision: A Practical Framework
Here's how to turn the numbers into an actual decision without overthinking it.
Step 1: Get both valuations before you talk to anyone
Run KBB and Edmunds for your vehicle in honest condition. Write down the private party midpoint and the trade-in midpoint. The spread between them is your maximum potential gain from selling privately.
Step 2: Apply the tax credit offset
In most U.S. states, trade-ins reduce the taxable purchase price of your next vehicle. If you're buying a $35,000 car and trade in at $24,000, you pay sales tax on $11,000 rather than $35,000. At 7% tax, that's a $1,680 effective savings. Subtract that from the gap. If the adjusted gap is still above $1,000–$1,500, private sale is probably worth the effort for most sellers.
Step 3: Factor in your time and risk tolerance
A realistic private sale takes 2–4 weeks from listing to closed title transfer. You'll handle inquiries, no-shows, test drives, and negotiation. If your time has high value or you're on a tight timeline for your next purchase, those friction costs are real. Some sellers correctly decide the trade-in convenience is worth $1,500 to them. That's a legitimate call — just make it consciously.
Step 4: Get a real dealer offer before committing to private sale
Use KBB Instant Cash Offer or walk into a CarMax, AutoNation, or similar buyer to get a written offer with no trade-in purchase obligation. This gives you a guaranteed floor. If you list privately and the best offer you get is below that dealer number, you can always fall back. Having that floor in hand also sharpens your private listing negotiation — you know exactly at what point to stop accepting counteroffers.
The full breakdown of where the money goes in each channel is worth reviewing before you make a final call. And if you're ready to list, the private party sales hub walks through everything from writing your ad to closing the deal safely.


All claims are backed by peer-reviewed research. Sources on request.