Key Takeaways
Vehicle Depreciation
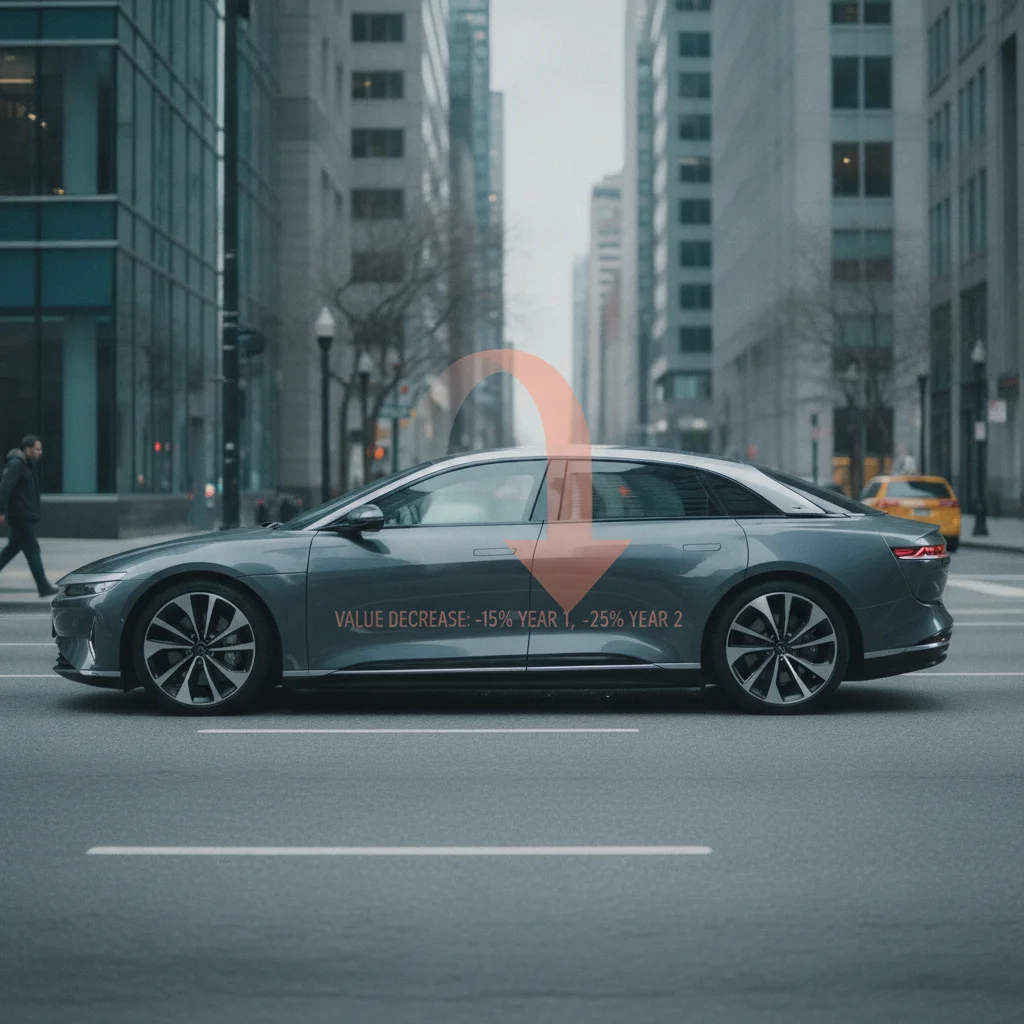
Vehicle depreciation is the reduction in a car's market value over time. It begins the instant you take ownership and accelerates fastest in the first few years. When you sell or trade in a car, you receive whatever value remains after depreciation has done its work — which is almost always less than what you paid.
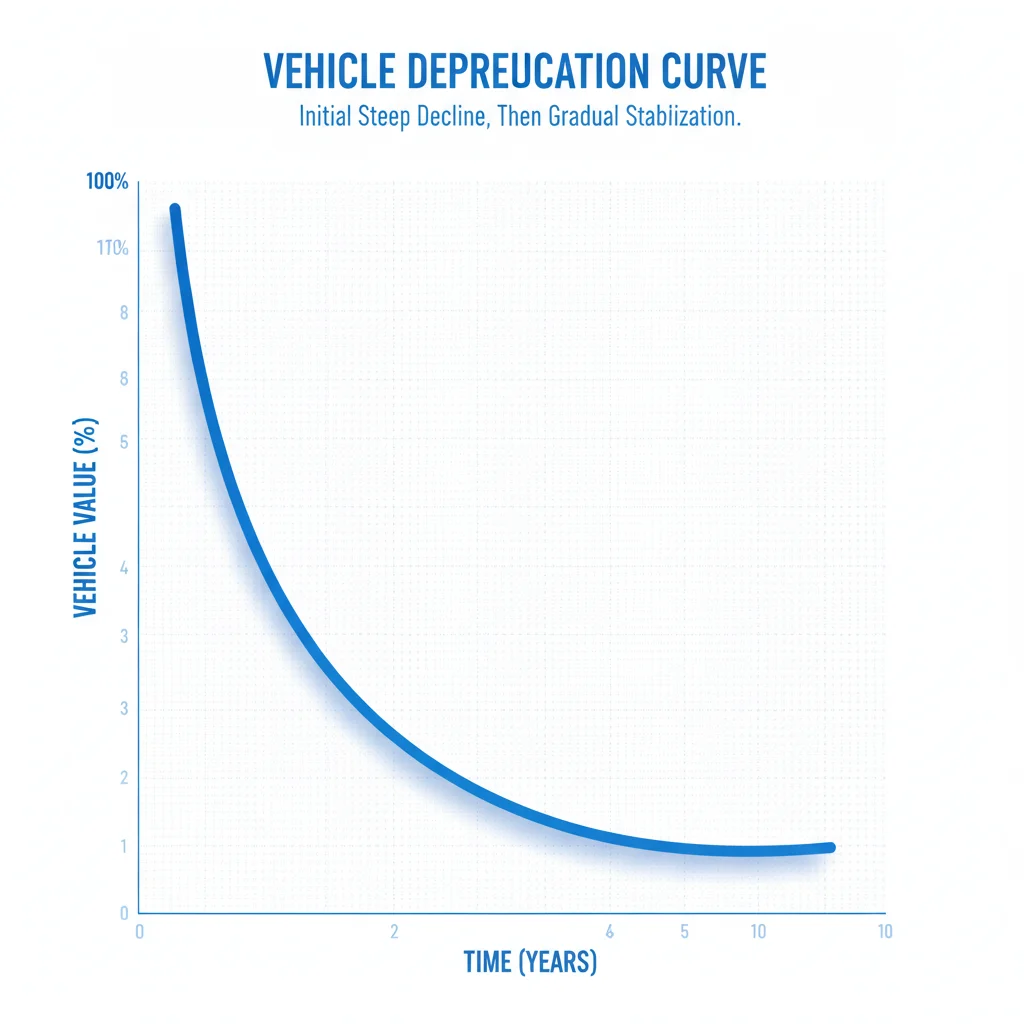
Depreciation is typically modeled as a declining-balance curve: the percentage lost each year applies to the current value, not the original purchase price, meaning the dollar amount of loss shrinks over time even as ownership costs stabilize.
What Depreciation Actually Means for Car Sellers
When most people think about selling a car, they anchor their expectations to what they paid for it — or what they still owe on it. Depreciation makes both of those numbers almost irrelevant. The market doesn't care about your purchase price or your loan balance. It cares about what the car is worth right now.
Depreciation is simply the difference between what you paid and what you can get. That gap is unavoidable — every car depreciates — but it's not random. It follows a predictable curve that you can learn, measure, and use to your advantage when it's time to sell.
Understanding that curve is the difference between setting a realistic price that attracts buyers quickly and chasing a number that keeps your car sitting unsold for months. Let's break it down step by step.
For a broader foundation on how depreciation affects car owners throughout the ownership lifecycle, see A Complete Owner's Introduction to Vehicle Depreciation.
The Depreciation Curve: How Value Drops Over Time
Depreciation doesn't happen evenly. It front-loads — the loss is largest in absolute terms in the early years and gradually flattens as the car ages. Here's what a typical depreciation curve looks like for a $35,000 new vehicle:
| Year | Approximate Value Retained | Estimated Market Value |
|---|---|---|
| Day 1 (after purchase) | 89–91% | $31,150–$31,850 |
| End of Year 1 | 75–80% | $26,250–$28,000 |
| End of Year 2 | 63–68% | $22,050–$23,800 |
| End of Year 3 | 53–58% | $18,550–$20,300 |
| End of Year 5 | 40–50% | $14,000–$17,500 |
| End of Year 10 | 20–30% | $7,000–$10,500 |
Notice that the biggest dollar drop happens in year one. A car that lost $7,000 in its first twelve months might only lose $3,500 in year three — even though the percentage loss is similar. This is the declining-balance effect: each year's depreciation is calculated against a smaller base.
20%
Average first-year depreciation for new cars
According to iSeeCars and Edmunds data, the average new vehicle loses approximately 20% of its MSRP in the first twelve months of ownership.
49%
Average value retained after five years
A 2023 iSeeCars study found that the average vehicle retains about 49% of its original value after five years, with significant variation by brand and segment.
~$7,000
First-year dollar loss on a $35,000 new car
At a 20% depreciation rate, a $35,000 vehicle loses roughly $7,000 in its first year — the steepest single-year loss across a typical ownership lifecycle.
10–25%
Additional value loss from accident history
CarFax research indicates that a reported structural collision can reduce a vehicle's resale value by 10–25% compared to an equivalent clean-title car.
60–70%
Value retained by top-ranked trucks after 3 years
Models like the Toyota Tacoma consistently retain 60–70% of their original MSRP after three years, outperforming the industry average by a wide margin.
For sellers, the practical implication is this: if you've owned your car for four or five years and maintained it well, you're past the steepest part of the curve. The car has already absorbed most of its lifetime depreciation loss. Buyers at this stage are getting a better deal relative to initial price — which means you need to price competitively to attract them.
Depreciation vs. Market Fluctuation
Depreciation is the long-term, structural decline in a vehicle's value due to age and use. Market fluctuations — like the used-car price surge of 2021–2022 — can temporarily push values above the depreciation curve, but they always revert. When pricing your car, prioritize current transaction data over peak-market comparisons from two or three years ago.
Trade-In vs. Private-Party: Know Which Number Applies
Valuation tools give you both trade-in and private-party estimates, and the gap between them is typically 15–20%. Trade-in value reflects what a dealer will offer — they need margin to resell the car profitably. If you're selling privately, you should be targeting the private-party range. Confusing the two numbers is one of the most common seller mistakes.
Why Cars Lose Value the Moment You Drive Away
The instant drop — that 9–11% loss on day one — isn't arbitrary. It reflects a real structural difference in how new and used cars are sold.
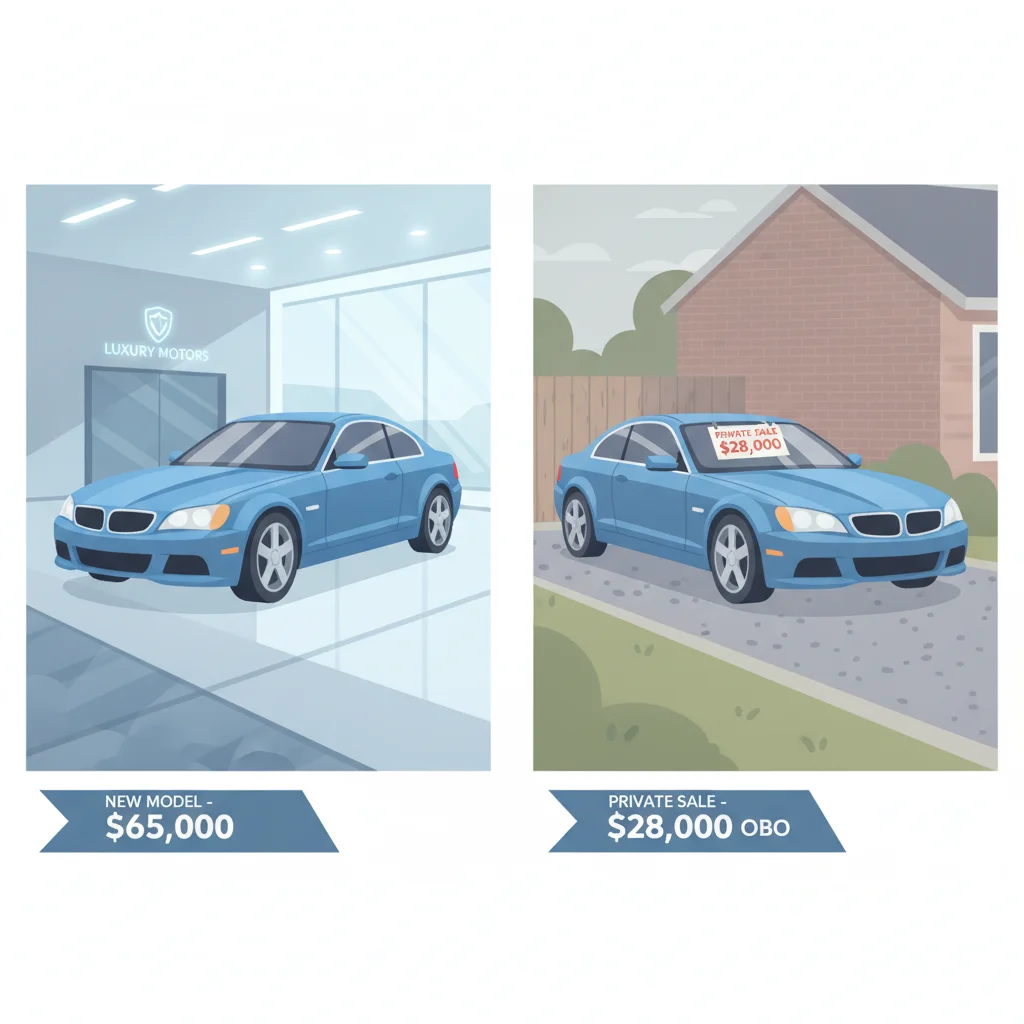
When you buy a new car, you're paying a retail price that includes dealer margin, manufacturer incentives, and the premium of being the first owner. The moment you leave the lot, the car is classified as used — and used cars are sold at wholesale-influenced prices with no new-car warranty on the sale itself. The market immediately reprices the vehicle to reflect that reality.
There are three forces driving that immediate drop:
- Reclassification from new to used. No buyer will pay new-car retail for a vehicle with miles on it. The used-car market has its own pricing structure, and it starts below MSRP.
- Dealer margin evaporation. New-car prices include dealer profit. Private sellers and used-car dealers can't command that same margin.
- Loss of first-owner status. Some buyers pay a small premium to be the first owner — fresh from the factory, no unknown history. Once that's gone, so is the premium.
“The single biggest financial mistake new-car buyers make is underestimating how much of their purchase price evaporates in the first twelve months. Depreciation is not a fee — it's the cost of being first.”
— Philip Reed, Senior Consumer Advice Editor, Edmunds
This is why financial advisors often suggest buying a car that's one to two years old: you let the first owner absorb that initial cliff-drop, and you step in at a price that more accurately reflects the vehicle's actual depreciated value. You can learn more about how this plays out at purchase in our article on what depreciation does to a new car's value the moment you drive away.
Factors That Speed Up or Slow Down Depreciation
The average curve is a starting point — your specific car may depreciate faster or slower depending on several variables. Sellers need to know which factors work in their favor and which ones they'll need to account for in their pricing.
Factors That Accelerate Depreciation
- High mileage. The standard benchmark is roughly 12,000–15,000 miles per year. Every 10,000 miles over the average can reduce value by 1–2%. A car with 90,000 miles at age five is worth noticeably less than a comparable five-year-old car with 50,000.
- Accident history. A Carfax or AutoCheck report showing a structural collision can cut value by 10–25% compared to a clean-title equivalent. Even minor reported accidents carry a stigma in resale markets.
- Poor condition. Valuation tiers (Excellent, Good, Fair, Poor) can differ by $1,500–$4,000 on a mid-range vehicle. Scratches, worn interiors, cracked windshields, and deferred maintenance all push the car down a tier.
- Discontinued or unpopular models. When a manufacturer discontinues a model or a brand exits the market, parts become harder to source and buyer demand shrinks. Both accelerate depreciation.
- Color and trim choices. Unusual colors (bright yellow, neon green) and stripped-down base trims often sell at a discount because the buyer pool is smaller.
Factors That Slow Depreciation
- Strong brand reputation for reliability. Toyota, Honda, and Subaru consistently top residual value rankings because buyers trust their long-term reliability.
- Body styles with persistent demand. Pickup trucks and compact SUVs depreciate more slowly than sedans in most markets because demand outpaces supply.
- Low mileage with documented service history. A car with full dealership service records signals to buyers that maintenance wasn't skipped — and reduces their risk.
- Popular color and trim combinations. Silver, white, and gray move faster and often command slight premiums. Popular trim levels with desirable option packages also hold value better.
Condition Tier Is Worth Real Money
Before you list your car, spend $150–$300 on a professional detail. A clean, well-presented car photographs better, attracts more buyers, and can justify moving from a 'Fair' to a 'Good' condition tier on valuation tools — a jump that often represents $1,500–$3,000 in asking price. That's a strong return on a few hundred dollars.
Always Run Both KBB and Edmunds
Kelley Blue Book and Edmunds use different data sources and methodologies, which means their estimates can vary by $500–$2,000 for the same vehicle. Run both tools with the same inputs and average the results. If one is significantly higher, investigate why before anchoring to it — it may reflect a data lag or regional variation that doesn't apply to your specific market.
Depreciation by Segment: What Your Category of Car Actually Does
Not all cars depreciate at the same rate. Segment matters enormously. Here's a practical breakdown of how different vehicle types typically behave over a five-year window:
| Segment | Typical 5-Year Value Retained | Notes |
|---|---|---|
| Compact pickup trucks | 55–70% | Toyota Tacoma routinely leads all segments |
| Full-size pickup trucks | 48–62% | F-150, Silverado, Ram hold strong in most markets |
| Compact SUVs / Crossovers | 45–58% | Demand driven; varies by brand significantly |
| Minivans | 40–50% | Toyota Sienna and Honda Odyssey outperform segment |
| Midsize sedans | 38–52% | Japanese brands significantly outperform domestic |
| Luxury sedans | 30–42% | German luxury depreciates fastest in segment |
| Electric vehicles | 25–50% | Highly variable; rapid model updates erode older EV values |
If you're selling a vehicle in a high-depreciation segment — a three-year-old German luxury sedan, for instance — your pricing needs to reflect that reality aggressively. Buyers in that market are sophisticated, have access to the same valuation data you do, and will walk away from overpriced listings quickly.
Electric vehicles deserve a special note. The EV market is moving fast: new models with longer range and lower prices are hitting the market constantly, which compresses the value of older EVs. Some three-year-old EVs have lost 40–50% of their MSRP. If you're selling a used EV, check current market prices carefully — don't rely on your car's original sticker price as any kind of anchor.
How to Use Depreciation Data to Price Your Car Correctly
Knowing the curve is useful; translating it into an actual list price is the practical step. Here's a straightforward process:
- Start with a valuation tool. Kelley Blue Book and Edmunds are the industry standards. Both pull real transaction data from their networks to estimate private-party and trade-in values. Enter your car's year, make, model, trim, mileage, ZIP code, and condition honestly. The valuation tools hub explains how KBB, Edmunds, and other tools generate their estimates.
- Check the private-party value, not just the trade-in value. Trade-in values reflect what a dealer will give you — which is typically 15–20% below what a private buyer would pay. If you're selling on your own, target the private-party range. If you're trading in, the trade-in figure is your actual baseline.
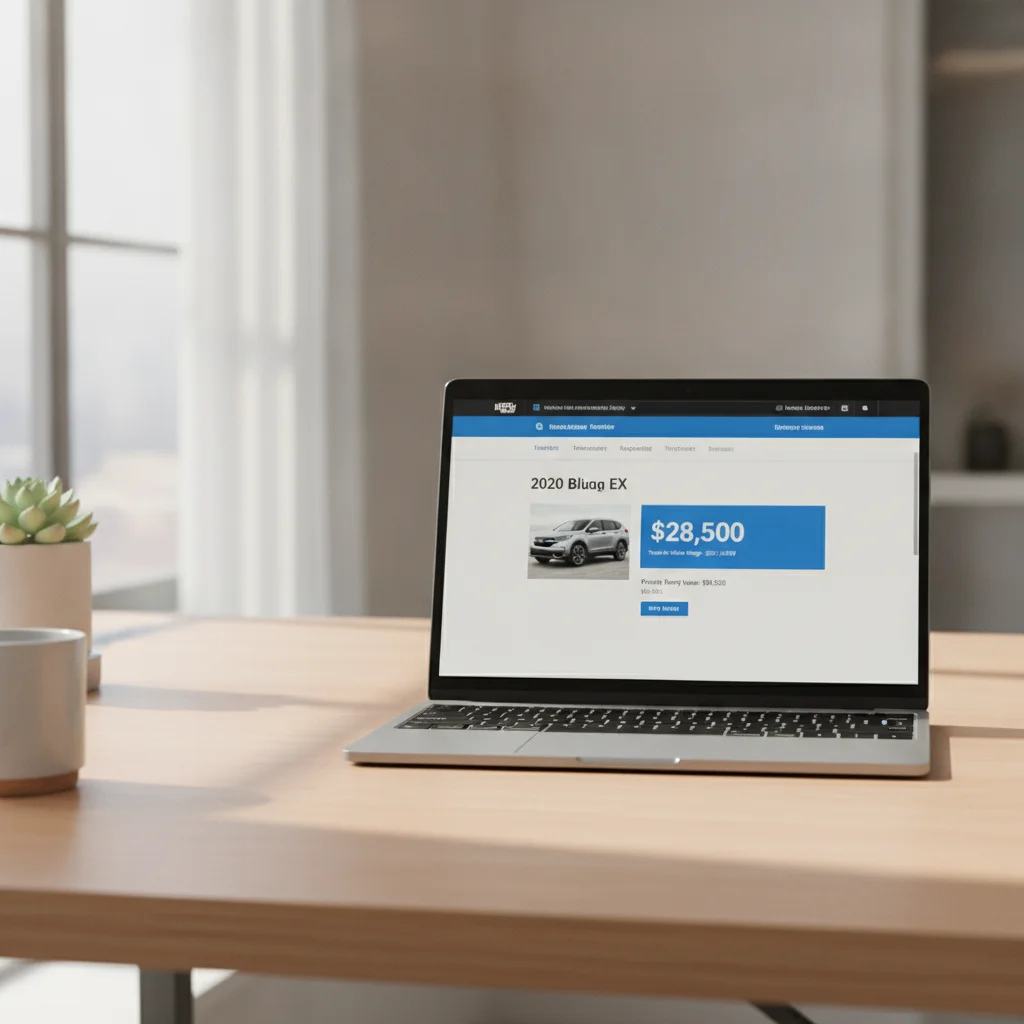
- Search active listings for your specific car. Go to CarGurus, AutoTrader, or Facebook Marketplace and filter for the same year, make, model, trim, and similar mileage in your region. What are competing cars actually listed for? This is your market anchor.
- Price 3–5% above your floor, not 15% above market. Most buyers negotiate. Leaving yourself a modest buffer allows you to meet a reasonable offer without going below your target. Pricing 15–20% above market just keeps buyers away.
- Adjust for condition tier honestly. If your car has an accident on its Carfax, a worn interior, or deferred maintenance, factor that into your price proactively. Buyers will discover these issues anyway — pricing as if they don't exist creates friction and wasted time.
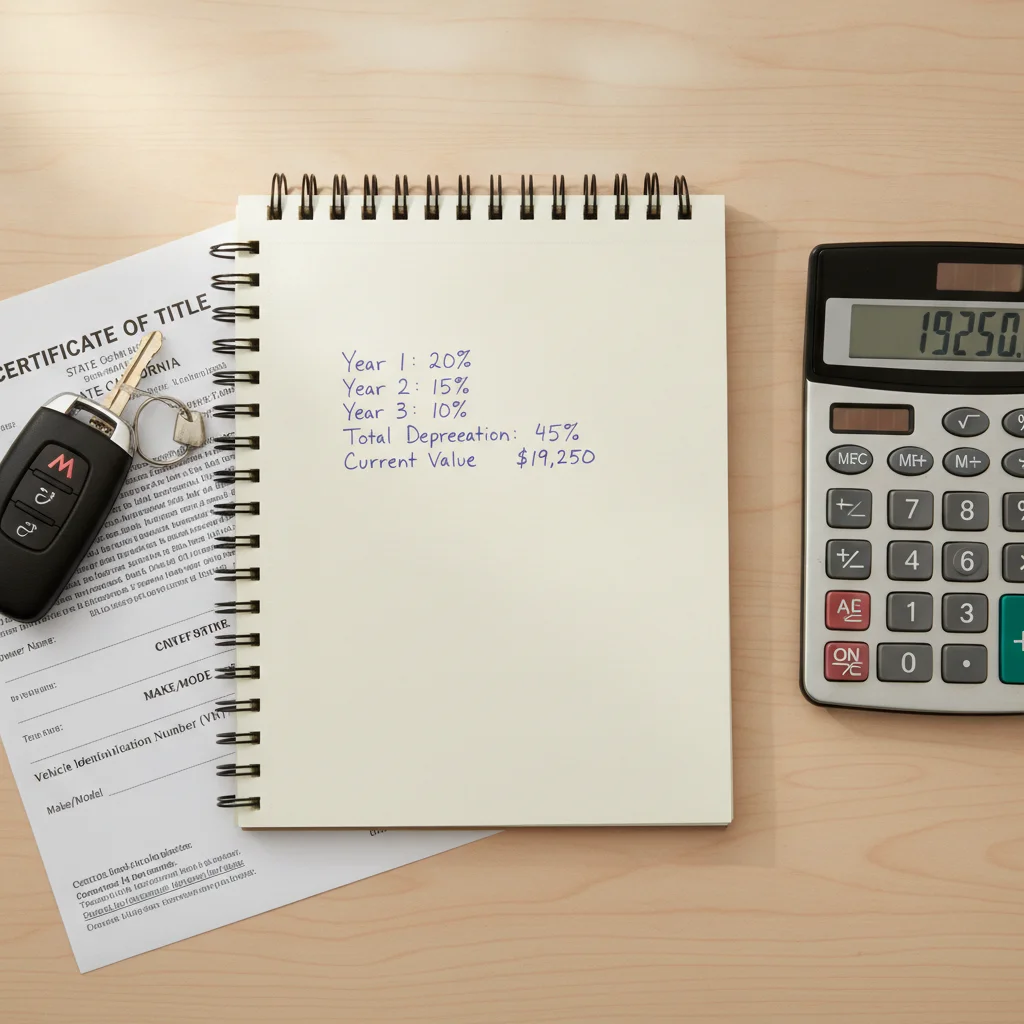
For a deeper dive into the math behind these calculations, Calculating Your Car's Depreciation: A Practical Walkthrough walks through the numbers step by step using real examples.
Condition Tier Is Worth Real Money
Before you list your car, spend $150–$300 on a professional detail. A clean, well-presented car photographs better, attracts more buyers, and can justify moving from a 'Fair' to a 'Good' condition tier on valuation tools — a jump that often represents $1,500–$3,000 in asking price. That's a strong return on a few hundred dollars.
Always Run Both KBB and Edmunds
Kelley Blue Book and Edmunds use different data sources and methodologies, which means their estimates can vary by $500–$2,000 for the same vehicle. Run both tools with the same inputs and average the results. If one is significantly higher, investigate why before anchoring to it — it may reflect a data lag or regional variation that doesn't apply to your specific market.
Common Pricing Mistakes Sellers Make Because of Depreciation Denial
Most overpriced private listings share the same root cause: the seller is anchoring to the wrong number. Here are the most common mistakes — and why they're costly.
Anchoring to the Original Purchase Price
What you paid is irrelevant to a buyer. They're comparing your car against every other car in their price range. If you paid $38,000 for a car now worth $22,000 on the open market, listing it at $28,000 because you 'can't afford to lose that much' simply means it won't sell. The depreciation loss is already baked in — refusing to price for it just delays the inevitable.
Anchoring to the Loan Payoff Amount
This is a painful situation, but common: you owe more than the car is worth (being 'underwater' or 'upside down'). Listing the car at your payoff amount doesn't make the car worth that much — it just means you'd need to cover the gap out of pocket. Pricing above market value in hopes of breaking even will keep your car unsold.
Using a Neighboring State's or Different Market's Prices
Car values vary by region. A pickup truck commands a premium in rural Texas that it won't get in a dense urban market. A convertible moves faster in Southern California than in Minnesota. Always use local listing data to benchmark your price.
Ignoring the Condition Tier Effect
KBB and Edmunds separate values by condition for a reason — it can mean a $2,000–$4,000 difference on a mid-range vehicle. Sellers frequently rate their own car as 'Excellent' when it's realistically 'Good' or even 'Fair.' Be objective. Better yet, ask a detail shop or mechanic to assess condition before you price it.
Depreciation vs. Market Fluctuation
Depreciation is the long-term, structural decline in a vehicle's value due to age and use. Market fluctuations — like the used-car price surge of 2021–2022 — can temporarily push values above the depreciation curve, but they always revert. When pricing your car, prioritize current transaction data over peak-market comparisons from two or three years ago.
Trade-In vs. Private-Party: Know Which Number Applies
Valuation tools give you both trade-in and private-party estimates, and the gap between them is typically 15–20%. Trade-in value reflects what a dealer will offer — they need margin to resell the car profitably. If you're selling privately, you should be targeting the private-party range. Confusing the two numbers is one of the most common seller mistakes.
For a comprehensive look at all the variables that shape your car's value — including depreciation tables by segment — see Vehicle Depreciation: The Complete Owner's Reference.
Timing Your Sale to Work With the Depreciation Curve
Depreciation doesn't happen in a straight line, and that creates strategic windows for sellers. Understanding those windows can mean recovering an extra $1,000–$3,000 on the same vehicle.
Sell Before a Major Mileage Milestone
Buyers and valuation tools treat 30,000, 60,000, and 100,000 miles as psychological thresholds. A car with 58,000 miles is worth more than one with 61,000 — sometimes by more than the difference in miles would justify. If you're approaching one of those thresholds, consider selling before you cross it.
Sell in the Right Season for Your Vehicle Type
Convertibles sell faster and for more in spring and early summer. AWD crossovers and SUVs spike in value before winter in northern climates. Pickup trucks are relatively consistent year-round but can soften in late fall in agricultural markets. Timing your listing to peak demand periods for your vehicle type can improve both speed and price.
Sell Before the Warranty Expires
Remaining factory warranty transfers with the car in most cases — and buyers value it. A car with two years of powertrain warranty left is worth more than one that's out of coverage. If your car has remaining warranty and you're planning to sell, doing so before coverage lapses protects your asking price.
Don't Wait for the Market to 'Come Back'
Some sellers wait, convinced that used-car prices will rebound to the highs of 2021–2022. Those conditions — driven by pandemic-era inventory shortages — were an anomaly. Waiting for those prices to return is not a sound strategy. Depreciation continues regardless of your timeline, and the longer you hold, the more it costs you in maintenance, insurance, and opportunity cost.

The Depreciation Basics hub covers the full landscape of how vehicles lose value over time — useful reading before you finalize any sale strategy.

All claims are backed by peer-reviewed research. Sources on request.