Key Takeaways
First-Year Depreciation
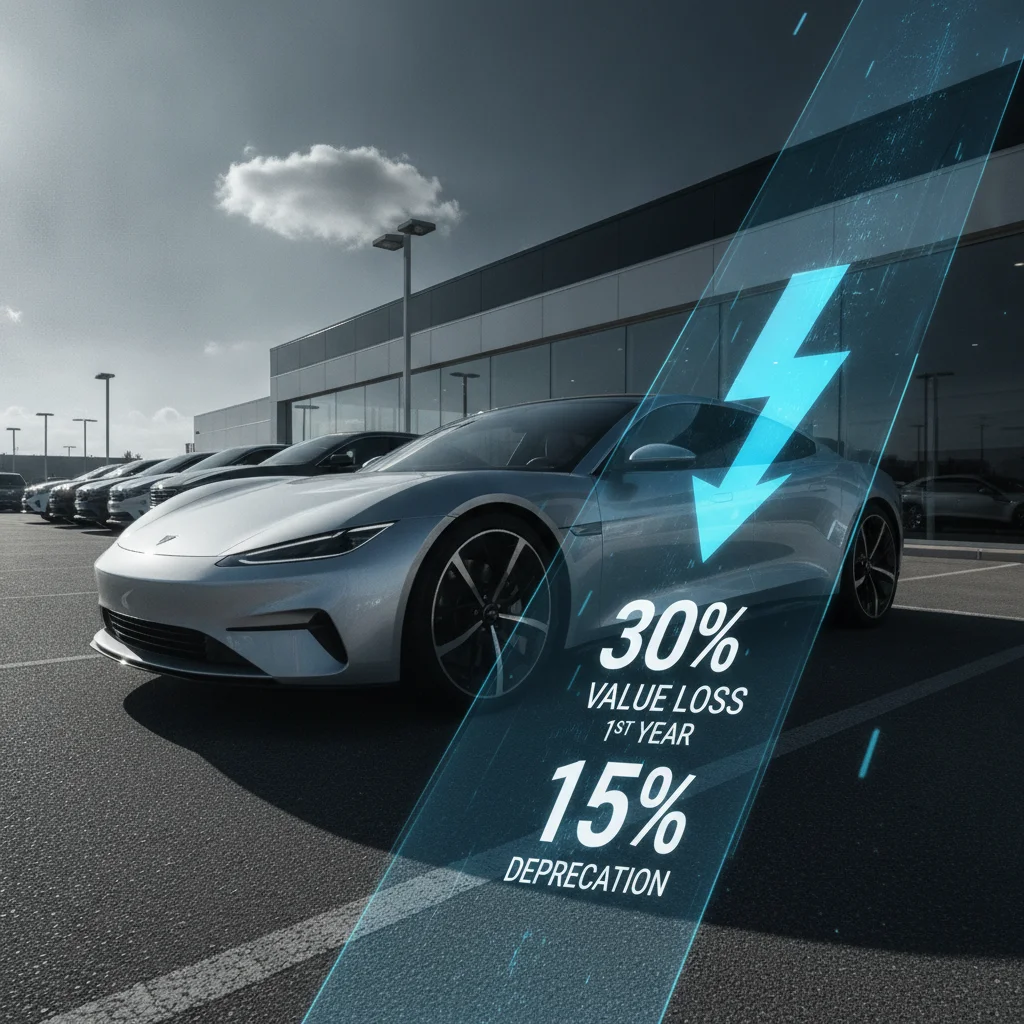
First-year depreciation is the reduction in a vehicle's market value during the first 12 months after it is purchased new. On average, a new car loses between 15% and 20% of its original purchase price in that first year alone — often more if the model is unpopular or heavily incentivized. This drop is steeper than any other single year in a car's life and is driven by factors like the "new-to-used" status change, high dealer markups, and buyer psychology.
Depreciation is distinct from amortization or loan payoff schedules. A car can depreciate faster than its loan balance decreases, creating a condition known as negative equity or being "underwater" on the loan.
Why the First Year Hits Hardest
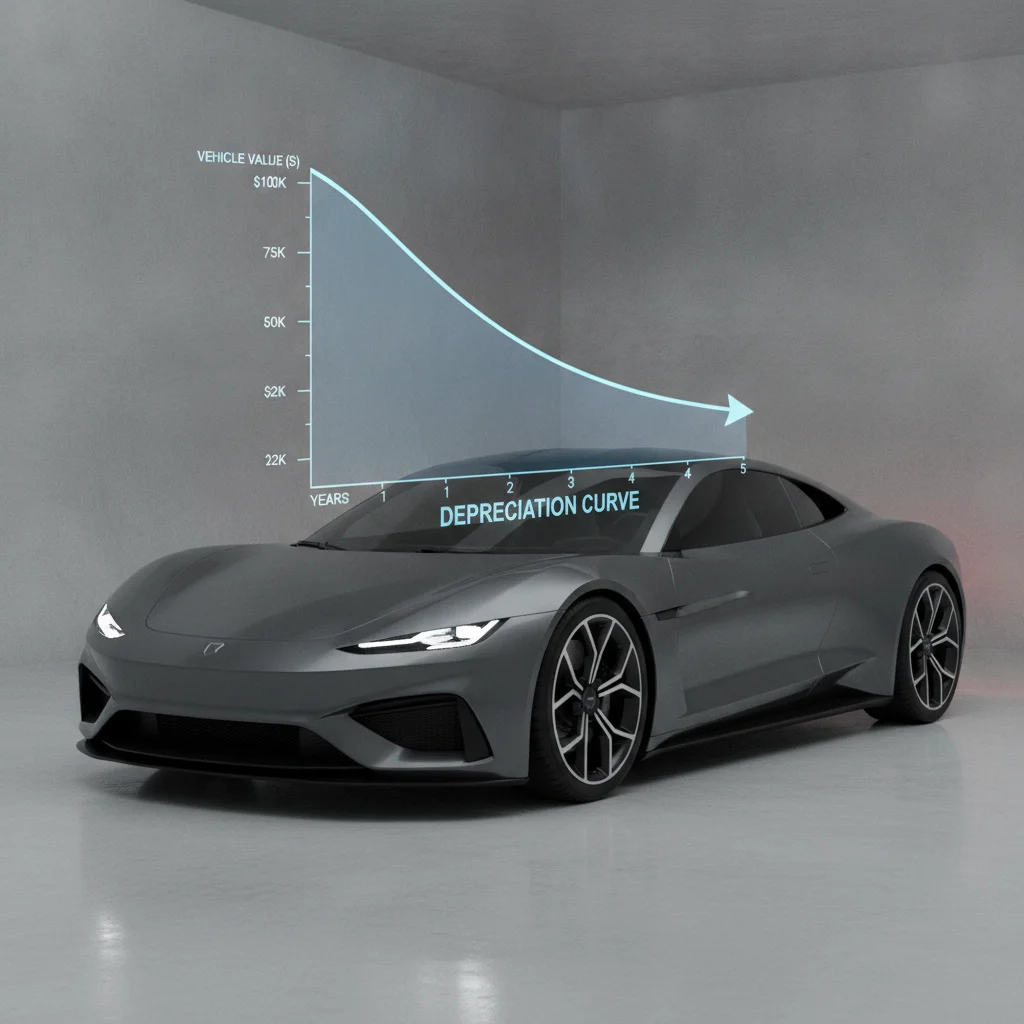
Depreciation is not a straight line. It is a curve — steep at first, then gradually flattening as a vehicle ages. And the steepest single drop happens in year one. Understanding why requires looking at what actually changes the moment you drive a new car off the dealer lot.
The most immediate factor is a status change: your car is no longer new. In the eyes of lenders, insurers, and future buyers, it is now a used vehicle. That label alone strips value, because the market applies a discount to anything that cannot be sold with a factory warranty still fully intact from day one. Buyers expect to pay less for a used car, so the pool of potential buyers for your vehicle shrinks and so does the price they are willing to offer.
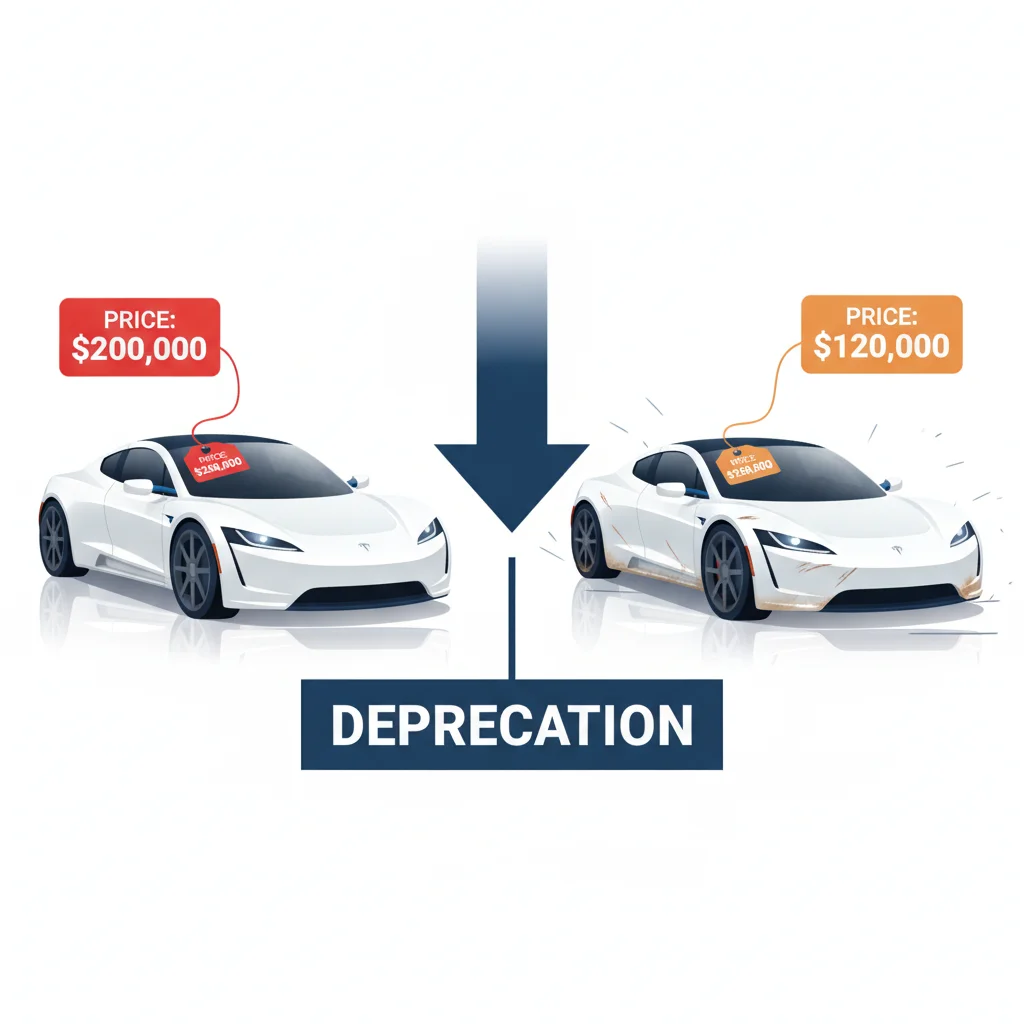
There is also the issue of dealer pricing. When a car is sold new, the transaction price often includes dealer profit margin, advertising fees, destination charges, and sometimes market-adjustment markups. Those costs evaporate the moment you take ownership — you cannot recapture them when you resell. If you paid $42,000 for a vehicle with an MSRP of $40,000 during a period of high demand, your effective depreciation hit in year one is even larger.
Finally, there is simple market supply. Thousands of cars identical to yours — same make, model, trim, and color — are being sold new every month. Your used car competes against all of them, and it loses on one key variable: mileage. Even 10,000 miles creates a meaningful price gap in the used-car market.
The "Lot Drop" Is Real but Misunderstood
You have probably heard that a car loses thousands of dollars the moment you drive it off the lot. This is true in a structural sense — the car is now officially used and cannot be sold at new-car prices — but the actual dollar figure varies widely by market conditions. In periods of high used-car demand (like 2021–2022), the lot drop was much smaller than usual because used prices were elevated. In a normal market, the status change alone can account for 5–8% of the purchase price immediately.
Negative Equity Risk in Year One
If you financed the purchase with a low down payment and a long loan term, first-year depreciation can leave you owing more on the loan than the car is worth. This is called being "underwater" or having negative equity. It becomes a serious problem if you want to sell or trade in the vehicle before the loan balance catches up with the car's declining value. A down payment of at least 10–20% significantly reduces this risk.
Depreciation Is Not a Cash Expense — Until You Sell
Depreciation does not show up as a line item on your monthly budget the way insurance or a car payment does. It is a paper loss that only becomes real when you sell or trade in the vehicle. This makes it easy to ignore — but it is one of the largest costs of vehicle ownership and should be factored into any decision about whether to buy new, buy used, lease, or hold a vehicle longer.
How Much Value Does a Car Actually Lose?
The commonly cited figure is 20%, but the real answer depends heavily on the vehicle. Some models depreciate far more slowly — think trucks and SUVs with strong resale reputations. Others fall off a cliff. Here is what the data generally shows:
- Average car: loses 15–20% in year one
- Luxury sedans: can lose 25–30% or more in year one
- Popular trucks and SUVs: may lose only 10–15% in year one
- Electric vehicles (many models): some shed 30–40% in the first 12 months due to rapid technology turnover and high MSRP
20%
Average value lost in year one
Industry data from Edmunds and Kelley Blue Book consistently shows new cars lose approximately 15–20% of their purchase price in the first 12 months.
$8,000
Typical dollar loss on a $40,000 car
At a 20% depreciation rate, a $40,000 new vehicle loses roughly $8,000 in value by the end of its first year of ownership.
30–40%
First-year loss for some EVs
Certain electric vehicle models, particularly those in the luxury segment, have seen first-year depreciation rates of 30–40% due to rapid technology advancement and high initial MSRPs.
10–15%
Year-one loss for top-rated trucks/SUVs
Models like the Toyota Tacoma and Ford F-150 have historically depreciated at just 10–15% in year one due to consistently high demand and limited used supply.
49%
Average 5-year total depreciation
According to Carfax and iSeeCars data, the average vehicle loses approximately 49% of its original value over five years, with year one accounting for the largest single portion.
To put this in dollar terms: a $40,000 sedan losing 20% in year one means you have absorbed $8,000 in depreciation before you have even completed a full year of ownership. At that same rate, your car is worth $32,000 twelve months after purchase — regardless of how well you maintained it.
It is worth noting that "the lot drop" — the depreciation that occurs the literal moment you drive away — is not a myth, but it is also somewhat misunderstood. That instant drop reflects the shift from new to used pricing, but the bulk of first-year depreciation accumulates over the full 12 months as mileage climbs and the model-year clock ticks. See how this plays out over a longer timeline in our guide on the depreciation curve across a car's lifetime.
Use Three Valuation Sources, Not One
No single valuation tool is perfectly accurate. Kelley Blue Book, Edmunds, and NADA each use different methodologies and data sets, which means they often produce different numbers for the same vehicle. Use all three to establish a realistic price range, then check actual listings in your local market to see where buyers are really transacting.
Sell Before the Model Year Turns
If you are planning to sell a lightly used vehicle, timing matters. Once the next model year arrives at dealerships — typically in the fall — your current model year becomes one step further removed from "new," and prices slip further. Selling in late summer, just before the new model year launches, often yields a better price than waiting until October or November.
The Factors That Accelerate or Slow First-Year Depreciation
Not every car depreciates at the same rate. Several variables determine whether your vehicle sits closer to the 10% end or the 30% end of the spectrum.
Brand Perception and Reliability Reputation
Brands with strong long-term reliability reputations — Toyota, Honda, Subaru — tend to retain value better in year one because buyers trust that a lightly used example is still a good bet. Brands with weaker reliability track records often depreciate faster because buyers demand a discount to absorb the perceived risk.
Model Popularity and Inventory
Supply and demand operates the same way in the used-car market as anywhere else. A model in high demand with limited used inventory holds its value better. Conversely, a model that sits on dealer lots or sees heavy lease return volume depreciates faster because supply outpaces buyer interest.
Trim Level and Options
Heavily optioned vehicles often depreciate more in raw dollar terms because there are fewer buyers willing to pay for premium packages on a used car. A base-trim vehicle at a lower price point may retain a higher percentage of its value simply because its buyer pool is larger.
Mileage
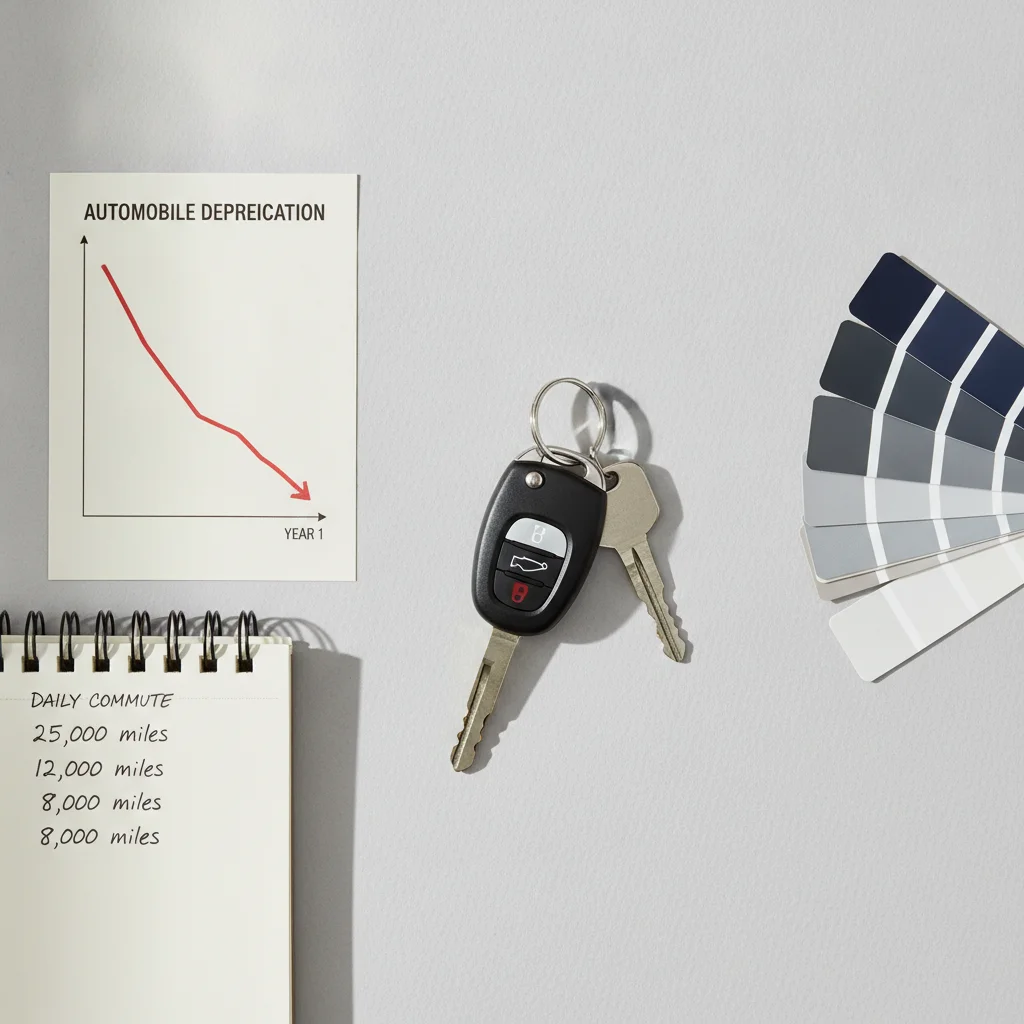
The average American drives around 12,000–15,000 miles per year. If you drive significantly more — say 25,000 miles in year one — your depreciation curve will be steeper than the average. Buyers price in mileage heavily, especially on vehicles under three years old.
Color and Configuration
Unusual colors (think lime green or bright orange) appeal to a narrower buyer pool, which suppresses resale prices. Neutral colors — white, silver, grey, black — consistently outperform in resale value studies because they appeal to the widest possible audience.
“The single most expensive moment in a car's financial life is often the first mile. That transition from new to used is priced by the market instantaneously, and most buyers are not prepared for how much it costs them.”
— Philip Reed, Senior consumer advice editor and automotive finance analyst
What First-Year Depreciation Means If You're Selling
If you are trying to sell a car that is less than 12 months old, the most important thing to understand is this: your benchmark is not what you paid. Your benchmark is what the market says the car is worth today, as a used vehicle.
Many sellers make the mistake of anchoring their asking price to their original purchase price minus a small discount. This almost always results in overpricing, longer time on market, and ultimately a lower final sale price after repeated reductions. Instead, start with real-time market data.
- Check multiple valuation tools — Kelley Blue Book, Edmunds, and NADA all provide used-car value estimates. Check all three and treat the results as a range, not a single number.
- Search actual listings — Look for your exact make, model, trim, model year, and color on Autotrader, Cars.com, and CarGurus. What are comparable cars actually listed for in your region? What have they sold for recently?
- Account for your mileage honestly — Most valuations are calibrated to a mileage benchmark. If your mileage is above average, your price needs to reflect that.
- Factor in condition realistically — Minor wear, small dents, and interior scuffs all affect buyer perception even if they do not appear in valuation formulas. Buyers will negotiate these down.
For a fuller picture of everything first-year ownership costs — not just depreciation but also insurance, registration, and maintenance — see The True Cost of Owning a New Car in Year One. Understanding all those costs together gives you a more accurate sense of your total loss if you sell early.
Use Three Valuation Sources, Not One
No single valuation tool is perfectly accurate. Kelley Blue Book, Edmunds, and NADA each use different methodologies and data sets, which means they often produce different numbers for the same vehicle. Use all three to establish a realistic price range, then check actual listings in your local market to see where buyers are really transacting.
Sell Before the Model Year Turns
If you are planning to sell a lightly used vehicle, timing matters. Once the next model year arrives at dealerships — typically in the fall — your current model year becomes one step further removed from "new," and prices slip further. Selling in late summer, just before the new model year launches, often yields a better price than waiting until October or November.
The Buyer's Angle: Capturing Depreciation as Savings
First-year depreciation is bad news for the seller, but it is a significant opportunity for the buyer. When you purchase a vehicle that is 12–18 months old with modest mileage, you are essentially letting the original owner absorb the steepest part of the value curve. You get a nearly-new car at a meaningful discount.
This is why certified pre-owned (CPO) programs at dealerships have become so popular. A one- or two-year-old CPO vehicle has already absorbed its first-year depreciation, often still carries most of the original factory warranty, and has been inspected and reconditioned to meet manufacturer standards. The math can be compelling.
Consider this comparison:
| Scenario | Purchase Price | Year-One Value | First-Year Loss |
|---|---|---|---|
| Buy new at $40,000 | $40,000 | ~$32,000 | ~$8,000 |
| Buy 1-year-old CPO at $32,500 | $32,500 | ~$28,000 | ~$4,500 |
Even in year two, the CPO buyer loses less in absolute dollars because the base price is lower. And year two depreciation is typically less severe than year one — usually around 10–15% of remaining value — so the curve has already begun to flatten.
For a detailed look at how the depreciation curve evolves from year one through year ten, see our breakdown of vehicle depreciation from year one to year ten. You will see exactly when the steepest drops occur and when the curve levels off.
How to Protect Yourself from Excessive First-Year Depreciation
If you are buying new and you know you might sell within a few years, there are concrete steps you can take to minimize your exposure to first-year and early depreciation losses.
Choose Models with Strong Residual Values
Before you buy, look up the projected residual value of the model you are considering. Automotive data providers like ALG (Automotive Lease Guide) publish residual value awards each year — these measure how much of the original MSRP a vehicle retains after three years. Models that win these awards lose less value in early years.
Avoid Overloaded Option Packages
Adding $5,000 in technology and appearance packages rarely returns that investment at resale. Stick to packages that are commonly requested by buyers — things like safety technology bundles or popular sunroof and navigation packages — and skip the exotic colors and rare configurations.
Consider Lease Instead of Buy
If you know you want a new car every two to three years, leasing transfers the depreciation risk to the leasing company. Your monthly payment is essentially paying for the predicted depreciation plus a finance charge. You return the car at the end without worrying about resale value — though you also walk away with no equity.
Mind Your Mileage
Staying close to the average mileage benchmark (12,000–15,000 miles per year) prevents you from amplifying depreciation beyond what the market already expects. High mileage at the time of sale compresses your price significantly.
For more context on how these costs compound over the first five years — not just year one — see what the first five years of ownership really cost you. Years two through five follow year one's lead, and knowing what's coming helps you plan your sell or trade-in timing strategically.
The "Lot Drop" Is Real but Misunderstood
You have probably heard that a car loses thousands of dollars the moment you drive it off the lot. This is true in a structural sense — the car is now officially used and cannot be sold at new-car prices — but the actual dollar figure varies widely by market conditions. In periods of high used-car demand (like 2021–2022), the lot drop was much smaller than usual because used prices were elevated. In a normal market, the status change alone can account for 5–8% of the purchase price immediately.
Negative Equity Risk in Year One
If you financed the purchase with a low down payment and a long loan term, first-year depreciation can leave you owing more on the loan than the car is worth. This is called being "underwater" or having negative equity. It becomes a serious problem if you want to sell or trade in the vehicle before the loan balance catches up with the car's declining value. A down payment of at least 10–20% significantly reduces this risk.
Depreciation Is Not a Cash Expense — Until You Sell
Depreciation does not show up as a line item on your monthly budget the way insurance or a car payment does. It is a paper loss that only becomes real when you sell or trade in the vehicle. This makes it easy to ignore — but it is one of the largest costs of vehicle ownership and should be factored into any decision about whether to buy new, buy used, lease, or hold a vehicle longer.
The broader picture of how cars lose value over their entire lifetime is covered in the Depreciation Basics hub, which is a useful reference point whether you are buying, selling, or simply trying to understand total cost of ownership.

All claims are backed by peer-reviewed research. Sources on request.