Key Takeaways
Why Sellers Get the Price Wrong — And How Depreciation Math Fixes It
Most private sellers start the pricing process with one of two bad anchors: what they originally paid for the car, or what a neighbor got for a vaguely similar vehicle last year. Neither tells you what your specific car is worth today, in your market, in its current condition. The result is a listing price that either leaves money on the table or repels every serious buyer who walks in knowing the real numbers.
Depreciation — the systematic loss of a vehicle's value over time — follows a predictable curve that you can actually calculate. Once you understand it, setting a realistic price stops feeling like guesswork. For a solid conceptual foundation, vehicle depreciation explained covers how and why cars shed value from the moment they leave the lot.
This guide goes one step further: it walks you through the actual math — plugging in your car's age, mileage, and condition — so you arrive at a current market value you can defend in a conversation with any buyer.

Before you run any numbers, gather the four data points you'll need throughout this process:
- Original MSRP or purchase price — what the car cost new (or what you paid used)
- Current mileage
- Model year and trim level
- An honest condition assessment (more on how to do this objectively in Step 3)
With those in hand, you're ready to work through the steps below.
What you will need
Tools You'll Use Throughout the Process
You don't need specialized software, but having the right references open saves significant time. The tools below cover both the calculation phase and the final cross-check against real market data.
Kelley Blue Book (KBB)
Provides private-party, trade-in, and dealer-retail value estimates based on year, make, model, mileage, and condition.
Edmunds True Market Value (TMV)
Generates price estimates based on actual transaction data, giving a ground-level view of what buyers are paying right now.
NADA Guides
Offers the benchmark values that banks and dealerships use internally — useful for understanding trade-in ceilings.
Calculator (phone or spreadsheet)
Used to apply manual depreciation-rate calculations and condition adjustments to your baseline figures.
Vehicle History Report (Carfax or AutoCheck)
Confirms accident history and title status — both of which affect condition grade and final market value.
Local listing platforms (Facebook Marketplace, AutoTrader, Cars.com)
Used to cross-check your calculated value against what sellers in your area are actively asking for comparable vehicles.
A word on the valuation sites: each uses a slightly different methodology. Kelley Blue Book tends to reflect retail transaction prices; Edmunds True Market Value leans on actual sales data from dealers; NADA is often the benchmark lenders and dealers use internally. Running all three and averaging the range gives you a price that holds up under scrutiny. The valuation tools hub breaks down exactly how each platform calculates its estimates if you want to go deeper.
Step-by-Step: Calculating Your Car's Depreciated Value
Follow these steps in order. Each builds on the last, and skipping ahead — especially skipping the condition adjustment in Step 3 — is the single most common reason sellers end up with an unrealistic number.
Establish Your Depreciation Baseline Using the Standard Curve
Start with the annual depreciation rates that apply to most mainstream vehicles. These aren't universal — luxury cars and trucks with strong resale hold value differently — but they give you a working estimate before you plug in the valuation tools:
- Year 1: ~20–25% of original value lost
- Year 2: ~15–18% of remaining value lost
- Year 3: ~13–15% of remaining value lost
- Years 4–5: ~10–12% per year
- Years 6–10: ~6–8% per year, flattening gradually
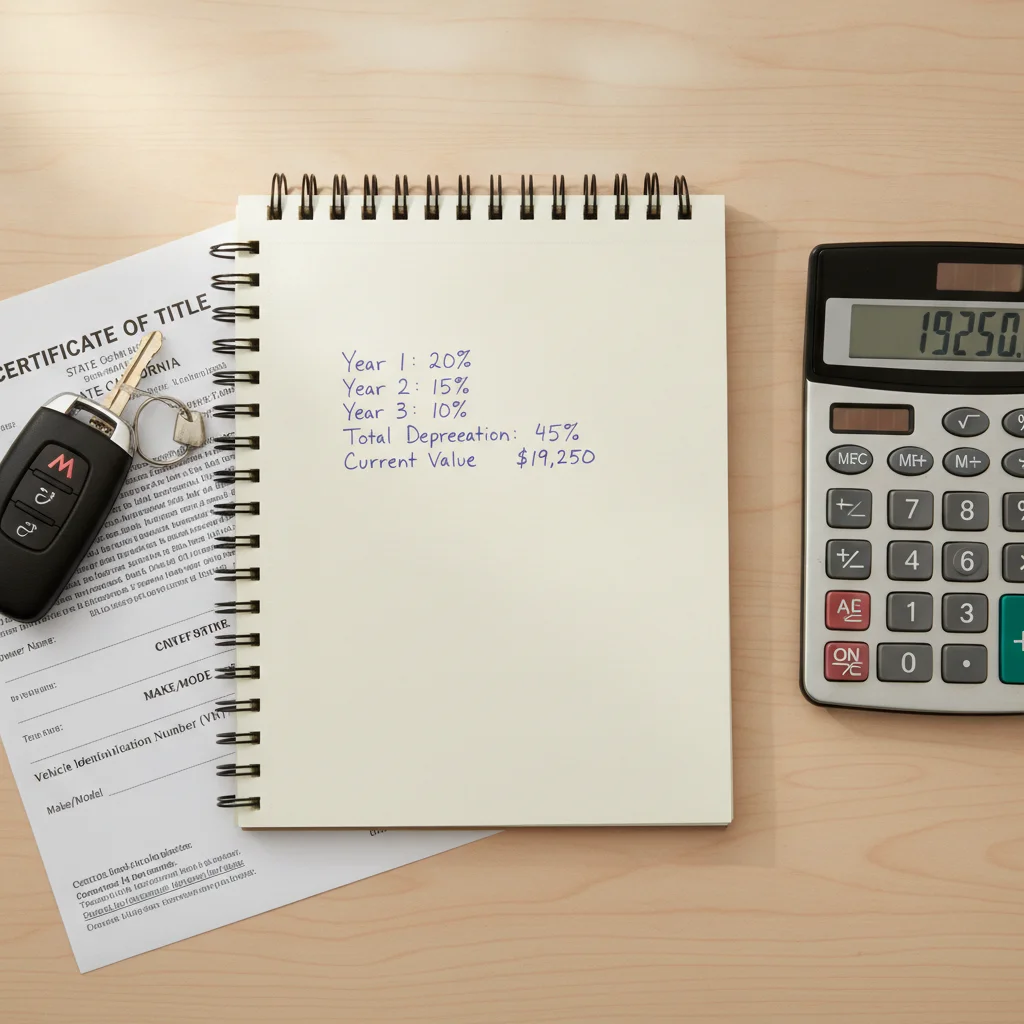
Use these rates to calculate a rough depreciated value from your original price. For example: a $30,000 car after three years of average depreciation looks like this:
- End of Year 1: $30,000 × (1 − 0.22) = $23,400
- End of Year 2: $23,400 × (1 − 0.16) = $19,656
- End of Year 3: $19,656 × (1 − 0.14) = $16,904
This baseline figure — roughly $16,900 — is your starting point. It tells you the ballpark before mileage and condition are factored in. The depreciation basics hub has model-specific rate data if your vehicle falls outside mainstream categories.
Adjust for Mileage Above or Below the Average
The standard depreciation curve assumes roughly 12,000–15,000 miles per year. Your actual mileage may push the value up or down from your baseline. Here's how to apply the adjustment:
Step 2a: Calculate expected mileage.
Multiply your car's age in years by 13,500 (the midpoint average). A 3-year-old car would be expected to have 40,500 miles.
Step 2b: Find your mileage delta.
Subtract expected mileage from your actual mileage. A positive delta (more miles than expected) reduces value; a negative delta (fewer miles) adds value.
Step 2c: Apply the per-mile adjustment.
Most valuation tools use roughly $0.05–$0.10 per mile above or below average for mainstream vehicles in the $15,000–$30,000 range. Use $0.07 as a working figure.
Example: Your 3-year-old car has 55,000 miles. Expected: 40,500. Delta: +14,500 miles.
Adjustment: 14,500 × $0.07 = −$1,015 from your baseline.
Updated estimate: $16,904 − $1,015 = $15,889.
Grade Your Vehicle's Condition Objectively
Condition is where sellers most often overstate their car's worth — and where buyers push back hardest. Use the industry-standard grading scale below, applied honestly:
- Excellent / Outstanding
- No mechanical issues. Exterior paint is flawless or near-flawless. Interior has no staining, tears, or significant wear. All electronics function perfectly. This is the top 10% of used cars — dealers could put it on the lot without reconditioning.
- Good
- Minor cosmetic wear: small door dings, light interior scuffs, a stone chip or two in the paint. Mechanically sound. Tires with reasonable life remaining. This describes most well-maintained used cars.
- Fair
- Noticeable cosmetic damage (dents, faded paint, worn interior surfaces). May need minor mechanical attention — brakes getting low, a rattling heat shield, a non-critical warning light. Buyers will want to negotiate.
- Poor
- Significant cosmetic or mechanical issues. Requires meaningful repair investment before it's retail-ready.
Be honest: if a buyer drives 45 minutes to see your car and disagrees with your condition grade, you'll either lose the sale or be forced to drop the price on the spot — the worst possible negotiating position.
[in_content_images:3]Run Your Numbers Through at Least Two Valuation Tools
With your baseline depreciated estimate, mileage-adjusted figure, and honest condition grade in hand, open KBB and Edmunds (and NADA if you want a third data point). Enter your information consistently across all platforms:
- Select Private Party sale — not Trade-In and not Dealer Retail. You're selling to an individual.
- Enter your actual current mileage, not a rounded figure.
- Select the condition grade you determined in Step 3. Resist the urge to bump up one level.
- Include optional packages or features your vehicle has — navigation, sunroof, towing package, premium audio. These do add value, though typically less than buyers expect.
- Enter your ZIP code. Regional demand affects the output significantly — the same car can be worth $1,200 more in one market than another.
Record the private-party value each tool returns. Calculate the average of your two or three results. This average is your market-validated estimate.
Set Your Asking Price Range and Listing Strategy
You now have a market-validated estimate. Translate it into an asking range using this simple framework:
- List price: Market estimate + 5–8% (negotiating room)
- Accept price: Market estimate (your true floor for a private sale)
- Walk-away price: Market estimate − 3% (absolute minimum; below this, consider a dealer offer)
Example: Market estimate = $15,800.
List at $16,800. Accept offers down to $15,800. Walk away if pushed below $15,324.
Write these three numbers down before you receive your first inquiry. Having predetermined thresholds prevents emotional decision-making during negotiation — especially if a buyer is pressuring you on the spot.
Finally, document your sources. When a buyer questions your price, saying "KBB private-party value in good condition for this zip code is $15,900" is more persuasive than any assertion that you "looked it up." Data wins negotiations. For a deeper look at how to use that same data offensively when you're on the buying side, see using depreciation data to negotiate.
Understanding What Your Number Actually Means
Once you've completed the five steps, you should have a price range — not a single figure. That range is intentional. The low end represents what a dealer would likely offer at trade-in; the high end reflects an optimistic private-sale ceiling. Your realistic private-sale asking price sits in the upper-middle of that band.

Here's a concrete example to illustrate. Say you own a 2020 mid-size sedan that cost $28,000 new. It now has 52,000 miles and you'd call the condition "good" — a few door dings, no mechanical issues, original tires with life left. Running that through the depreciation curve and valuation tools might produce:
| Source | Condition | Estimated Value |
|---|---|---|
| KBB Private Party | Good | $17,400 |
| Edmunds TMV | Good | $16,900 |
| NADA Clean Retail | Good | $17,800 |
| Your asking range | — | $17,200 – $17,600 |
Notice that the range is narrow — under $500 wide. When your three sources agree that closely, you have strong confirmation that your math is right. When they diverge by more than $1,500, it usually signals a regional demand factor or an unusual trim/package the tools aren't weighting correctly. In that case, check active local listings (not sold listings — active ones set buyer expectations) on Facebook Marketplace and AutoTrader for the same model year and mileage range.
When Your Three Sources Diverge Widely
If KBB, Edmunds, and NADA return values more than $1,500 apart, don't average blindly — investigate why. Common causes include an unusual trim or package that one tool weights differently, a regional demand spike in your ZIP code, or a recent model recall that's dampening buyer interest. Check active local listings for the same year and trim to see what the real-world market is accepting right now. <a href="/selling-your-car/pricing-your-car/depreciation-basics-2/reading-a-depreciation-chart-a-practical-guide-for-private-sellers">Reading a depreciation chart</a> can help you interpret divergent data points more confidently.
Best Time to List for Maximum Value
Timing your listing to seasonal demand can add a meaningful premium without changing anything about the car itself. Convertibles peak in spring, four-wheel-drive SUVs and trucks fetch more in fall, and fuel-efficient compacts sell fastest when gas prices spike. If you have flexibility on timing, list when your vehicle type is most in demand in your region.
One more consideration: your depreciated value also clarifies the trade-in versus private-sale question. If a dealer offers $15,500 and your private-sale range is $17,200–$17,600, the $1,700–$2,100 gap is your premium for the effort of a private sale. Whether that's worth it depends on your time, your comfort negotiating, and how quickly you need to close. For context on how depreciation data shapes negotiations with dealers and private buyers alike, see using depreciation data to negotiate.
Don't Let Your Loan Balance Set the Price
What you owe on a car and what it's worth in the market are entirely independent figures. If you're underwater on your loan — meaning the payoff balance exceeds the market value — you cannot simply price the car higher to cover the gap. Buyers have access to the same valuation tools you do. Price to market, and plan separately for how you'll cover any remaining loan balance at the time of sale.
Common Mistakes That Skew Your Number
Even sellers who run the tools carefully can land on a bad number. Here are the most frequent errors — and how to avoid them.
Using MSRP Instead of Invoice or Actual Purchase Price
MSRP is the starting point for new-car depreciation, but if you bought at invoice or below sticker, that's the number to use. Depreciation is a percentage of what the car was actually worth, not what the manufacturer hoped to get for it.
Ignoring High-Mileage or Low-Mileage Adjustments
Valuation tools default to an "average" mileage assumption — typically around 12,000–15,000 miles per year. If your car has 80,000 miles on a five-year-old vehicle, that's above average, and the tool should adjust downward. If it has 30,000 miles on the same five-year-old car, expect a positive adjustment. Always input your actual mileage rather than accepting a default.
Grading Condition Generously
This is the single most common seller error. "Excellent" on KBB means near-showroom condition — the kind of car that could sit on a dealer lot today with no reconditioning. If your car has any visible exterior wear, any interior staining, or any mechanical quirks, it is "Good" at best and possibly "Fair." Honest grading costs you maybe $800 on paper; overpricing because of inflated grading costs you weeks of stale listing time.
Overgrading Condition Is the Costliest Seller Mistake
Listing a "Fair" car at "Good" prices doesn't just hurt your credibility — it actively kills deals. A buyer who drives out to inspect your car, discovers the actual condition, and feels misled will either walk or make an aggressively lowball offer to compensate for the wasted trip. Be conservative with your condition grade. The $400 difference between Good and Fair on the sticker is worth far less than the deal you'll lose by inflating it.
Forgetting Regional Demand
Trucks command premiums in rural markets; fuel-efficient compacts are worth more in dense urban areas with high gas prices. National tools give you a national average. If you're in a market where your vehicle type is in short supply, you may be able to price toward the top of your range. Check local listings to calibrate.
Not Accounting for Negative Equity
If you still owe money on the car, your depreciated market value may be less than your payoff balance — a situation called being underwater or upside down. The car's market value and your loan balance are separate numbers; the market doesn't care what you owe. If your payoff is $19,000 and the market value is $17,200, you'll need to cover that $1,800 gap at sale. Calculating your car's total depreciation shows how to work through the full cost-of-ownership picture, including loan considerations.
Taking Your Price to Market With Confidence
A data-backed price does two things: it speeds up your sale and it arms you for the inevitable negotiation. Buyers who research values — and serious buyers always do — will push back on any number that isn't supported by the tools they've already consulted. When you know your sources, you can hold your ground or make informed concessions instead of caving to pressure.
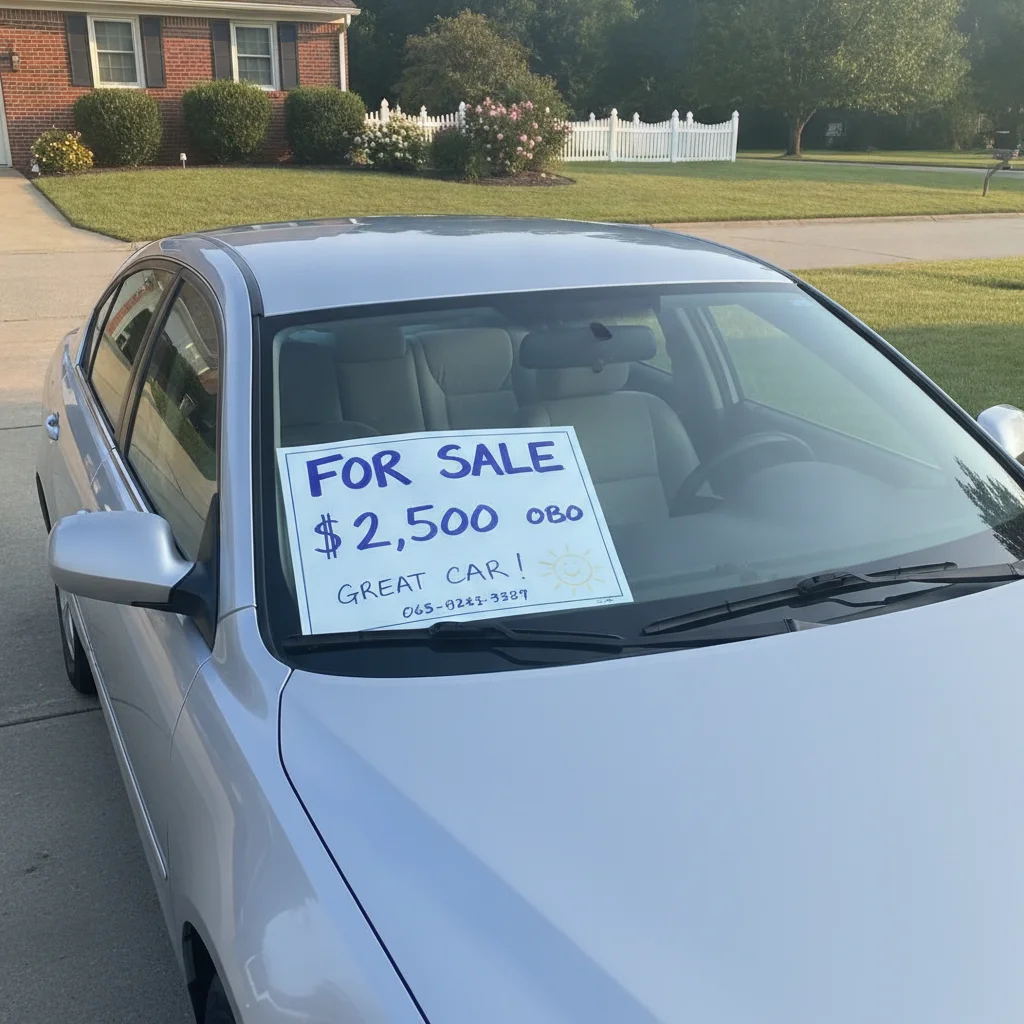
List at the upper end of your range and expect offers near the midpoint. Build in roughly $300–$500 of negotiating room so both parties feel like the deal was earned. If you receive no serious inquiries within 10–14 days at your initial price, drop to the midpoint. If you're still stalled after another week, revisit your condition grading — buyers viewing the car in person may be mentally downgrading it.
Also consider timing. Cars that fit a particular season — convertibles in spring, 4WD trucks before winter — fetch stronger prices when demand peaks. If you're listing in an off-season for your vehicle type, that can justify pricing conservatively toward the midpoint rather than reaching for the top of your range.
If interpreting the data from the valuation tools feels confusing, reading a depreciation chart walks you through how to extract actionable numbers from the graphs and tables those platforms produce. And if you're still in the research phase — perhaps comparing whether to sell your current car or keep it — assessing remaining depreciation risk gives you the buyer-side perspective that rounds out your understanding of how the market actually prices used cars.
Pricing your car well isn't about squeezing every dollar out of the transaction — it's about knowing what your asset is actually worth so you can make a rational decision about how and when to sell it. The math in this guide makes that possible.

All claims are backed by peer-reviewed research. Sources on request.