
Key Takeaways
Why Depreciation Data Is a Negotiating Tool, Not Just a Finance Concept
Most buyers walk into a dealership knowing roughly what they want to spend — but not specifically what the car in front of them is actually worth at this moment in its life. Dealers know that gap exists, and the asking price reflects it.
Depreciation data closes that gap. When you know what a vehicle was worth new, how fast its model segment typically loses value, and where this specific car sits on that curve, you have a concrete, reproducible number that represents fair market value. That number is not your opinion — it's derived from the same underlying data the dealer used to price the car in the first place.
The difference is that they're using it to set a price that maximizes their margin, and you can use it to justify a price that reflects actual market reality.
The complete owner's depreciation reference breaks down key terms, segment-specific rates, and the formulas you'll need before running your own numbers. If you're new to thinking about depreciation as a dollar figure rather than a vague concept, start there.
This guide assumes you have a specific vehicle in mind — a year, make, model, and trim — and walks you through converting depreciation data into a documented, defensible offer price.
What you will need
Kelley Blue Book (KBB)
Provides baseline used-car valuations segmented by condition grade and trim level.
Edmunds True Market Value (TMV)
Shows what buyers in your area are actually paying — often more accurate than book value in real time.
Carfax or AutoCheck Vehicle History Report
Reveals accident history, ownership count, and title events that accelerate real-world depreciation.
NADA Guides
Widely used by lenders and dealers; provides an independent valuation baseline for negotiation anchoring.
iSeeCars Depreciation Data Tool
Tracks model-specific depreciation curves by year and mileage bracket, useful for validating your calculations.
Spreadsheet Software (Excel or Google Sheets)
Lets you model depreciation curves, calculate residual values, and document your offer justification.
Local Listings Aggregator (AutoTrader, Cars.com)
Provides real-time comparable listings to validate that your depreciation-derived price reflects what's actually on the market.
How to Read a Depreciation Curve Before You Negotiate
A depreciation curve plots a vehicle's retained value — expressed as a percentage of original MSRP — against its age in years. The shape of that curve tells you several things that directly affect your negotiating position.
Steep early drop: Luxury vehicles, EVs with fast-evolving technology, and certain domestic brands lose 20–30% of their value in year one alone. If you're buying a three-year-old version of one of these, you're absorbing someone else's massive first-year loss at a fraction of the original cost — that's leverage, because the car is still worth substantially less than the seller may be pricing it.
Flat middle section: Most mainstream vehicles stabilize their depreciation rate between years four and seven, losing 8–12% per year rather than 20%+. This is the phase where relative value is most predictable — good for budgeting, but less dramatic as a negotiating tool.
Accelerating late depreciation: Past 80,000–100,000 miles or beyond year eight, many vehicles resume faster value loss driven by buyer reluctance around reliability and approaching major service intervals. If a high-mileage older vehicle is priced as if it's in the flat zone, you have documented grounds to argue for a steeper discount.
Understanding which part of the curve your target vehicle occupies is the first filter you run before any other analysis. The step-by-step depreciation calculation walkthrough gives you the exact math to pin a dollar value to each segment of the curve.

Don't Conflate Book Value With Market Value
KBB and NADA values are baselines derived from aggregate data — they lag real market conditions by weeks or months. In hot or cold markets, actual transaction prices can be 5–15% above or below book. Use listing data to confirm what the market is actually paying today.
High-Depreciation Models Aren't Always a Bargain
A vehicle that has lost 60% of its value in four years looks like a deal until you factor in reliability costs, parts availability, and the next buyer's reluctance. Steep depreciation curves often track real-world reliability reputations. Check owner forums and repair frequency data before assuming cheap equals smart.
Look Up the Model's Historical Depreciation Curve
Every vehicle model has a depreciation fingerprint — a pattern of how fast it loses value in years one through ten. Your first job is to find that fingerprint for the specific vehicle you're targeting.
Start with iSeeCars, Edmunds, or a dedicated depreciation database. Search for your target year, make, model, and trim. What you want to see is the percentage of original MSRP retained at each year mark. For most mainstream vehicles, year-one loss runs 15–25%, years two and three add another 10–15% each, then the curve flattens into a slower bleed through years five to eight.
Write those numbers down. You're building a value timeline, and every dollar the car has already dropped is a dollar the seller has already absorbed — not you. See how depreciation progresses from day one to year ten for detailed benchmarks by age.
Calculate the Car's Expected Current Value
With the depreciation curve in hand, calculate what the car should be worth right now based on its age and the model's established rate. This is your depreciation-derived baseline value — and it's separate from what any dealer is asking.
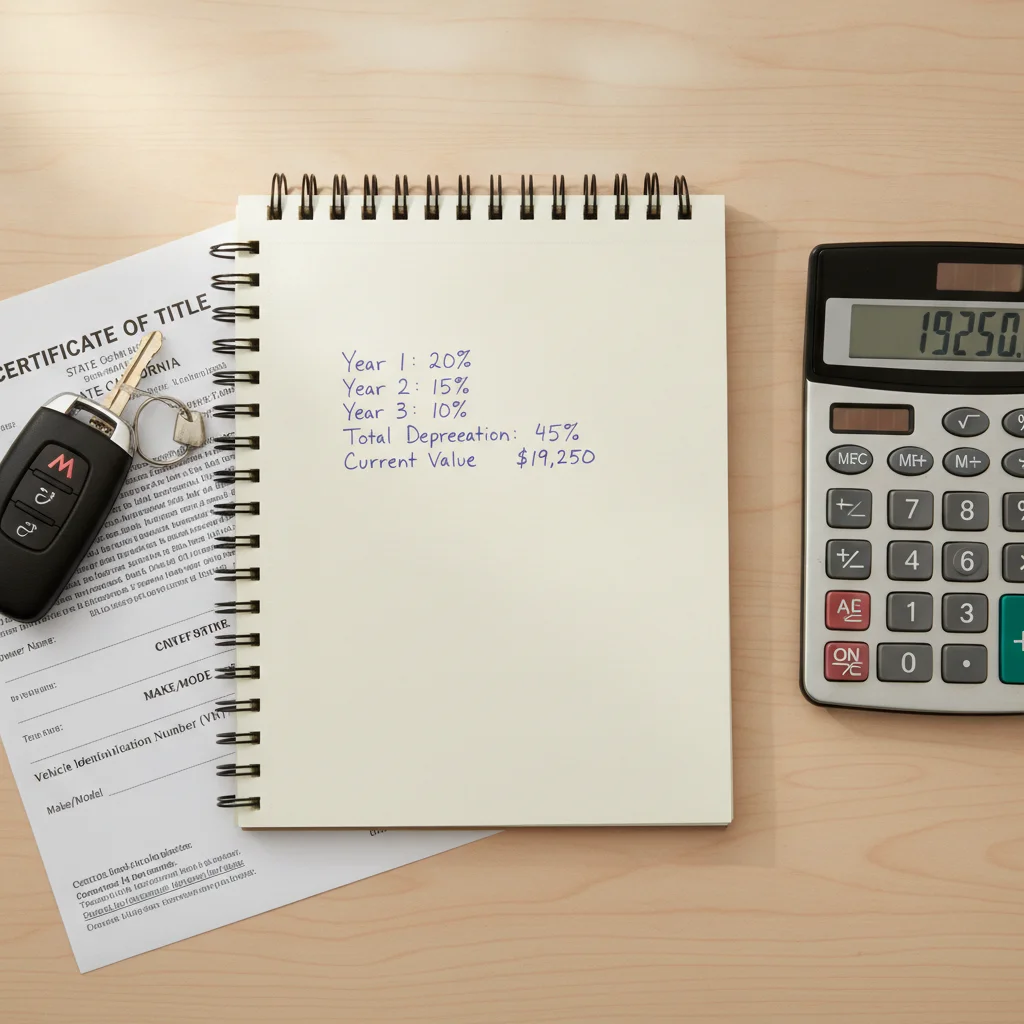
The formula is straightforward: Current Value = Original MSRP × (1 − Cumulative Depreciation Rate). If the original MSRP was $32,000 and the model typically loses 45% of its value over four years, the expected current value is $32,000 × 0.55 = $17,600.
Cross-check that number against KBB, Edmunds TMV, and NADA. If your calculation lands within $500–$1,000 of their figures, you're calibrated. If there's a wider gap, figure out why — it usually means the model has above- or below-average depreciation for its segment, which is itself useful information. The practical depreciation calculation walkthrough shows you how to run this math with your actual numbers.
Adjust for Mileage Deviation from the Norm
Depreciation rate benchmarks assume average annual mileage — typically 12,000–15,000 miles per year. Any vehicle that's significantly above or below that average needs a value adjustment before you use the number in negotiation.
A car with 20,000 miles per year on it has been used harder than the market expects. As a rule of thumb, most pricing guides apply a $0.06–$0.10 per-mile deduction for every mile above the expected total, and a smaller credit for below-average miles. Do the math: a four-year-old car should have roughly 48,000–60,000 miles. If it has 85,000, that's 25,000–37,000 extra miles, which can justify a $1,500–$3,700 reduction off the baseline.
High-mileage cars also tend to be closer to major maintenance intervals — timing belts, transmission service, brake replacements — so factor those upcoming costs into your adjusted offer as well.
Pull the Vehicle History Report and Quantify Accident Impact
Accidents aren't just safety red flags — they're financial events that accelerate depreciation beyond the model's typical curve. A vehicle with a reported accident trades at a discount to a clean-title comparable, and that discount is your negotiating ammunition.
Pull the Carfax or AutoCheck report for the specific VIN. Look for:
- Structural or frame damage — the biggest value killer, often 20–30% below clean-title market value
- Airbag deployment — signals a significant collision event, reduces value by 10–20% typically
- Multiple owners in a short window — suggests the previous owner discovered a problem and moved on quickly
- Odometer rollback flags — a deal-breaker, not a discount
Each of these line items is a documented, factual argument for a lower price. "Your Carfax shows a front-end collision in 2022, and comparable clean-title vehicles are listed at $X" is a statement the dealer can't simply dismiss. See every factor that affects depreciation at sale time to understand how these events compound.
Benchmark Against Real Active Listings
Your depreciation-derived value needs to be validated by what's actually on the market right now. Pull at least five comparable listings — same year, same trim, within 5,000 miles of your target's odometer reading — from AutoTrader, Cars.com, or similar platforms. Filter by your region first, then expand nationally if the sample is too thin.
Look at where your target vehicle's asking price sits relative to that comp pool. Is it priced at the top of the range? The median? Below? Dealers routinely list at the top of the comp pool hoping to catch an uninformed buyer. If you can show that three out of five comparable vehicles are listed for less, that's a market-based argument — not just your preference.
[in_content_images:0]
Record each comparable listing with the dealer name, mileage, price, and any notable condition differences. This is your comparison table, and you'll reference it directly in the negotiation.
Set Your Offer Price and Build Your Argument
Now you assemble the data into a single, defensible offer price. Here's how I typically structure it:
- Start with your depreciation-derived baseline value from Step 2.
- Apply mileage adjustment from Step 3 — add or subtract accordingly.
- Apply accident/history discount from Step 4 — document the specific event and your discount rationale.
- Validate against your comp pool from Step 5 — confirm your final number is consistent with real market listings.
- Set your opening offer 5–8% below your target price, leaving room to move toward your actual ceiling without exceeding it.
Write this out as a one-page summary: original MSRP, model depreciation rate, expected value at current age, mileage adjustment, history adjustments, comp pool range, and your offer. You don't have to hand it to the dealer — but having it in your hand, physically, signals preparation in a way that verbal claims never do.
For more context on how to carry this into the room, the dealer negotiation hub covers tactics for structuring the conversation once you're at the table.
Present Your Case at the Dealership
Walk in with your documentation organized. You don't need to lead with it — in fact, it's often more effective to let the salesperson make their pitch first, then introduce your data when they present the price.
When the moment comes, lay out your reasoning clearly and without apology: "I looked at the depreciation curve for this model, pulled the Carfax, and compared five active listings in the area. Based on all of that, the market value for this vehicle lands around $X. That's what I'm prepared to pay today."
[in_content_images:1]
Then stop talking. The silence after a well-documented offer is not your problem to fill. Let the dealer respond. Their counter will tell you how much room exists. If they push back without addressing your data specifically, ask them to explain what in your analysis is wrong. Most won't have a data-based answer.
[important_callout]
Know When to Walk — and When the Data Says You Won
The walk-away is only credible if you're actually willing to use it. Before you sit down, decide your absolute ceiling — the highest price at which this car still makes financial sense given its depreciation trajectory, history, and your planned ownership period.
If the dealer won't come within 3–4% of your documented market value, walk. You've done the work; another comparable vehicle exists, and you now know exactly what it's worth before you even call about it. The depreciation basics hub has more on how age and mileage continue to affect value if you decide to revisit the purchase later.
When the deal does close at or below your target, confirm the out-the-door price includes all fees before signing. Dealers sometimes recover margin through documentation fees, dealer add-ons, or paint protection packages. Your depreciation-based price argument covers the vehicle — not optional extras added at close.
What to Do When the Dealer Pushes Back
Even with solid data, you'll face resistance. Here's how common pushback usually goes — and how to handle it without abandoning your position.
"That's what the market is asking right now."
This is the most common deflection. Respond by referencing your comp pool specifically: "The market I'm seeing shows three comparable vehicles between $X and $Y. Can you help me understand what justifies pricing this one above that range?" Force them to address the data, not restate the asking price.
"We just put $2,000 into it."
Reconditioning costs are real, but they don't automatically add $2,000 to the car's value — they bring it up to the condition baseline the market already expects. If a car needs $2,000 in work to be sellable, that's a cost of doing business, not a buyer's premium. Ask for documentation of what was done and use it to verify the car actually meets the condition grade they're pricing it at.
"Someone else is coming to look at it this afternoon."
This is a pressure tactic, not information. Data-based buyers are insulated from artificial urgency because they know comparable vehicles exist and know what those comparables are worth. Your walk-away number makes the "other buyer" irrelevant — if this car sells above your ceiling, you move to the next one already knowing your offer.
Pull Data Before You Step on the Lot
Compile your depreciation analysis, comparable listings, and Carfax report before any dealer visit. Walking in with printed or phone-accessible data signals preparation and immediately changes the negotiation dynamic. Dealers routinely offer better starting prices to buyers who demonstrate they've done their homework.
Use Depreciation to Set Your Walk-Away Number
Before negotiations begin, calculate the price at which you are overpaying relative to the car's depreciation trajectory — that's your hard ceiling. Having a pre-committed walk-away number prevents the in-the-moment pressure that dealers rely on to close above market.
Factor Future Depreciation Into Your Offer
Ask yourself: what will this car be worth in two years? If the answer is significantly less than what you're paying minus typical use, you're front-loading someone else's loss. Build the next depreciation leg into your initial offer as justification for a lower price.
The broader dealer negotiation resource hub covers additional tactics for navigating price, trade-in, and financing conversations in the same visit — because dealers often make margin in places buyers aren't watching.
Don't Conflate Book Value With Market Value
KBB and NADA values are baselines derived from aggregate data — they lag real market conditions by weeks or months. In hot or cold markets, actual transaction prices can be 5–15% above or below book. Use listing data to confirm what the market is actually paying today.
High-Depreciation Models Aren't Always a Bargain
A vehicle that has lost 60% of its value in four years looks like a deal until you factor in reliability costs, parts availability, and the next buyer's reluctance. Steep depreciation curves often track real-world reliability reputations. Check owner forums and repair frequency data before assuming cheap equals smart.

All claims are backed by peer-reviewed research. Sources on request.