Key Takeaways
Why Tracking Your Own MPG Matters
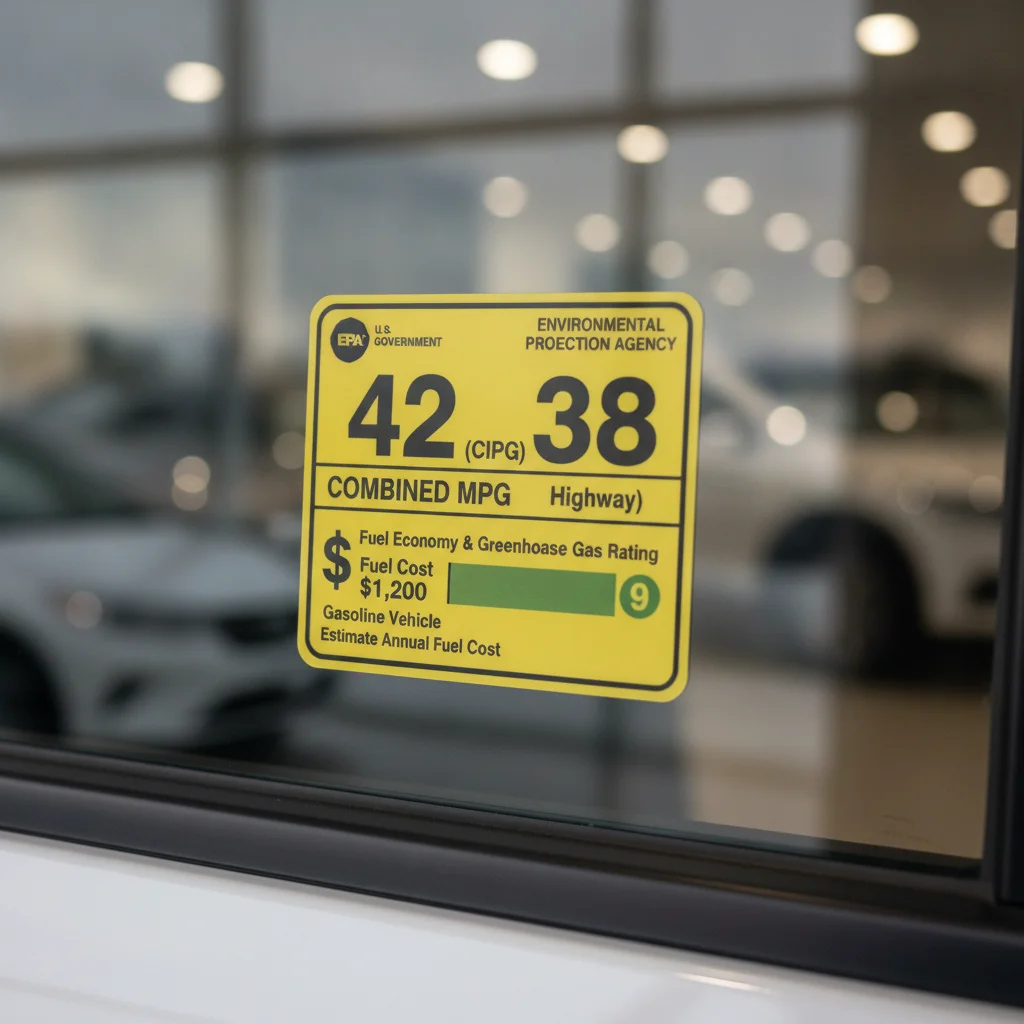
The EPA fuel economy estimate on the window sticker is a useful benchmark — but it was measured under controlled lab conditions, not your commute. Your real-world number depends on how you drive, where you drive, what fuel you're buying, and even the season. That gap between sticker and reality can be 10%, 20%, or more. Understanding what the label is actually telling you is a good starting point, but it's only half the picture.
Tracking your own fuel economy gives you something the sticker can't: a personal baseline. Once you know what your car actually gets under your conditions, you can measure the impact of driving habit changes, compare fuel types, and — critically — catch a sudden efficiency drop that could signal a mechanical problem before it becomes expensive.
The good news is that tracking doesn't require much effort or technical know-how. Whether you prefer pencil and paper, a smartphone app, or a plug-in data device, there's a method that fits how you already think about your car.
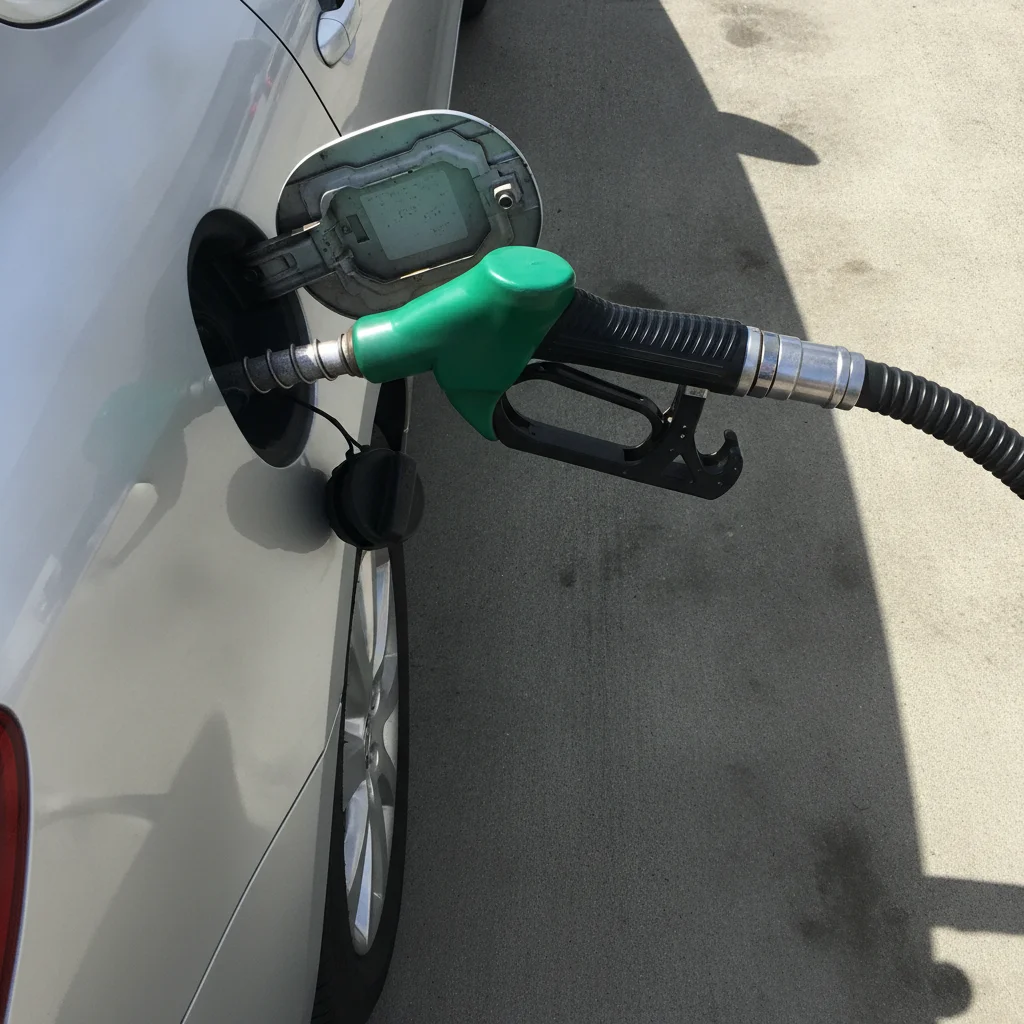
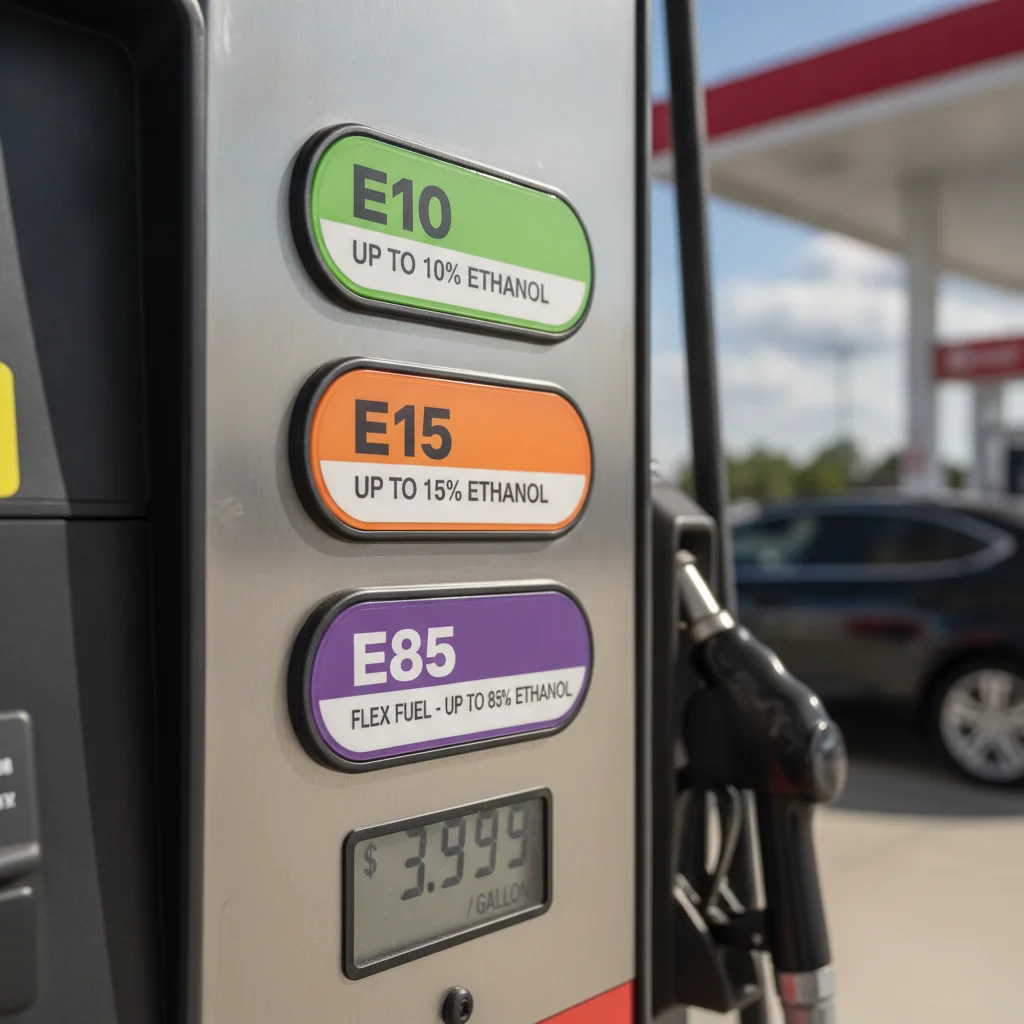
Before you start, it helps to understand what can legitimately shift your MPG from week to week. Ethanol content in pump gas, for example, has a measurable effect — E10, E15, and E85 blends each deliver different energy content, which means your MPG will vary depending on the blend you're pumping. Cold weather thickens engine oil and increases rolling resistance. Highway miles return better figures than stop-and-go urban driving. Knowing these variables helps you interpret your data intelligently instead of reacting to every small fluctuation.
Tools You Can Use
There's a range of options for tracking fuel economy, from free and manual to moderately priced and automated. The right choice depends on how much detail you want and how hands-on you're willing to be.
Pocket notebook or fuel log pad
Records gallons, miles, and calculated MPG at each fill-up for the manual tracking method.
Smartphone calculator
Performs the miles-divided-by-gallons calculation at the pump in seconds.
Fuel tracking app (e.g., Fuelio, GasBuddy, Road Trip MPG)
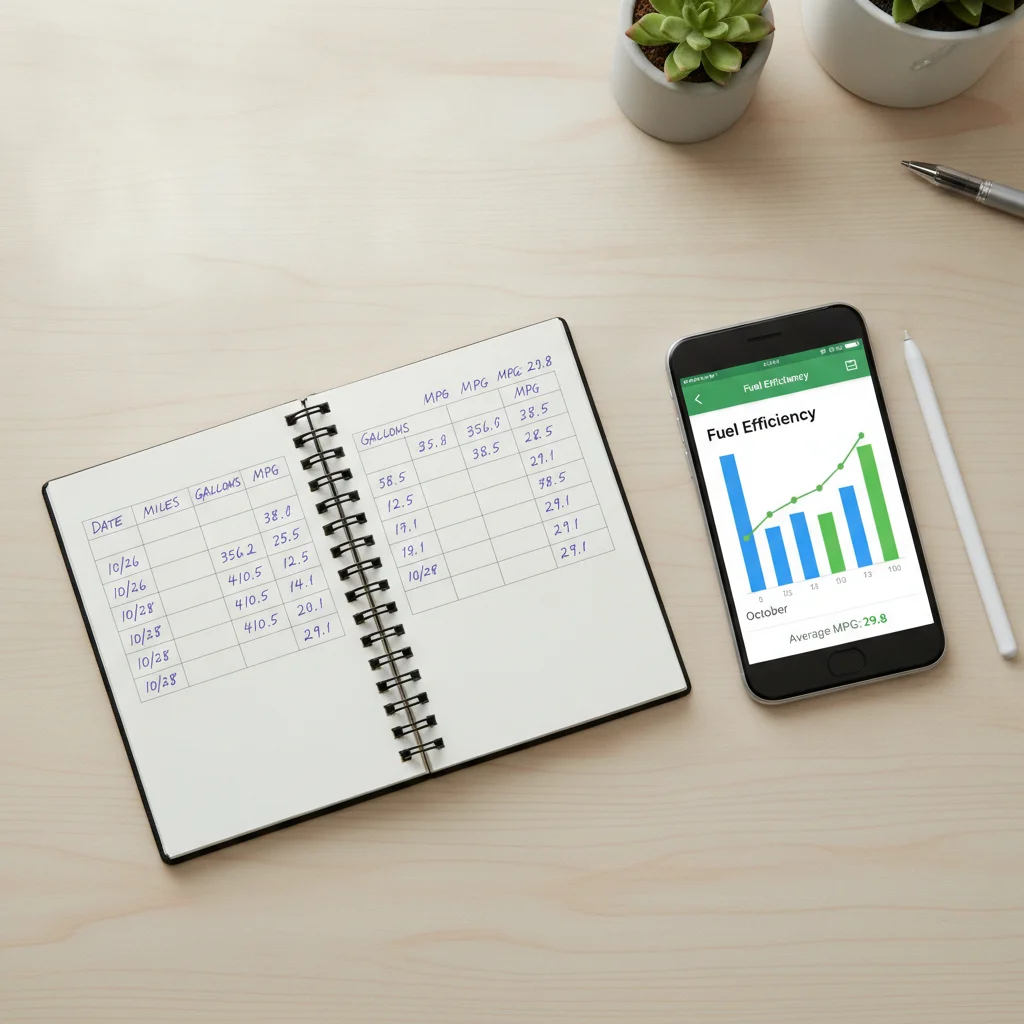
Stores fill-up history, calculates MPG automatically, and charts trends over time.
OBD-II Bluetooth or Wi-Fi adapter
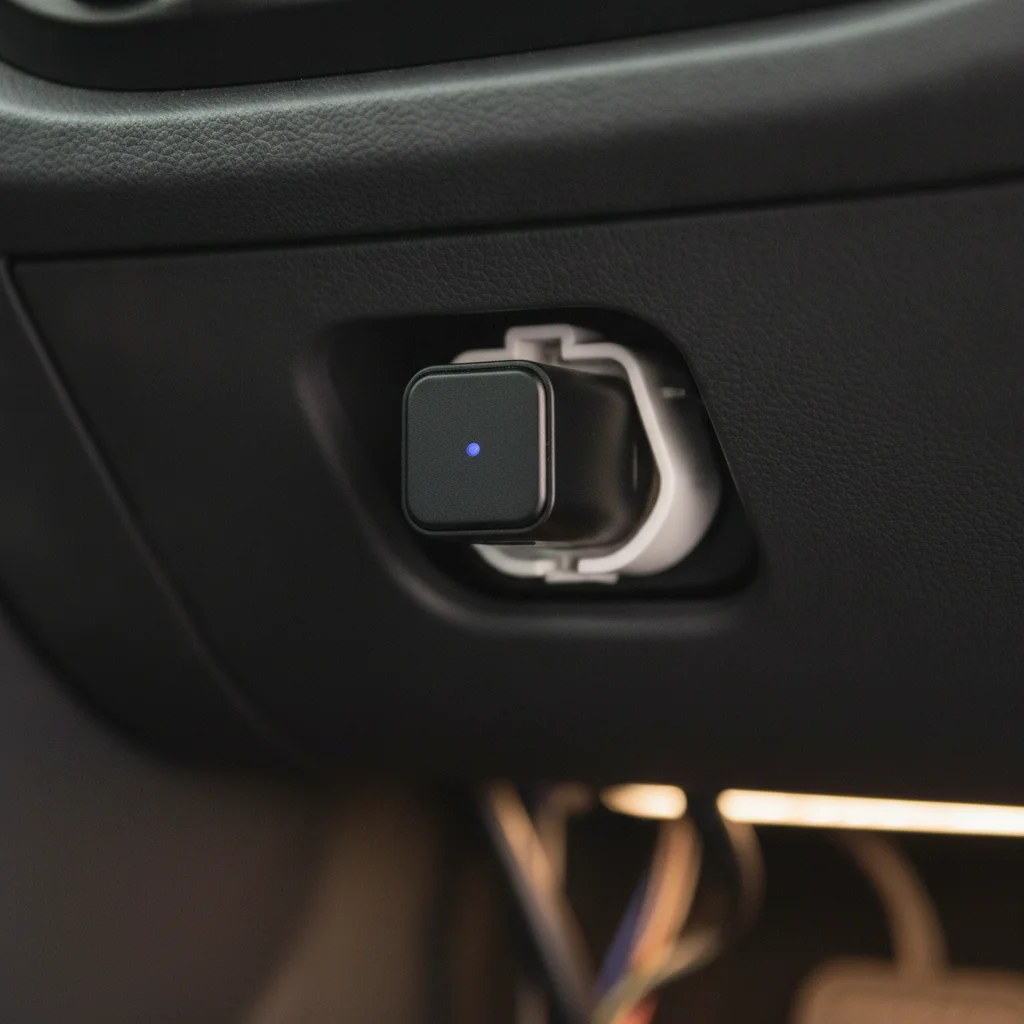
Plugs into your car's OBD-II port and streams live engine data to a paired smartphone app.
OBD-II app (e.g., Torque Pro, OBD Fusion, Car Scanner ELM OBD2)
Reads live fuel trim, throttle position, and other sensor data to show real-time efficiency and flag fault codes.
Tire pressure gauge
Verifies tire inflation before fill-ups, since pressure affects rolling resistance and therefore MPG.
For most drivers, starting with the manual method — described in the steps below — builds a solid understanding of how the numbers work. From there, adding an OBD-II app or leaning on your trip computer becomes much more meaningful because you have real math to compare against the device's readouts.
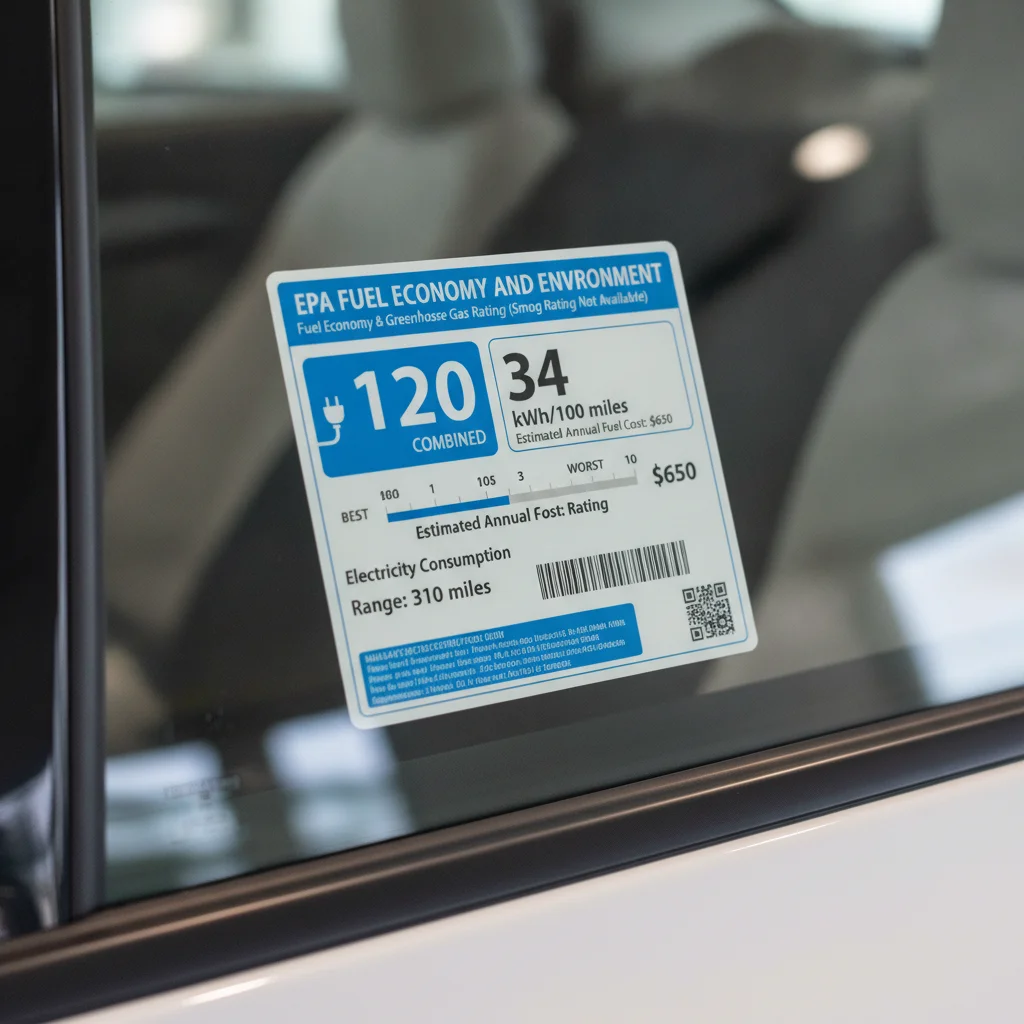
If you drive an electrified vehicle, your efficiency metrics look a little different. MPGe and kWh per 100 miles replace or supplement the standard MPG figure. Our guide to fuel economy labels for electrified cars explains what each metric means and how to track it alongside — or instead of — traditional MPG.
What you will need
Step-by-Step: How to Track Your Fuel Economy
Follow these steps to start building an accurate picture of your real-world fuel economy. The first two fill-ups are setup — the data gets meaningful by your third tank.
Fill your tank completely and reset your trip odometer
Start at a gas station you plan to use consistently. Fill the tank until the pump clicks off automatically — don't top it off beyond that click. Topping off skews your volume measurement and risks fuel vapor system issues.
Immediately after filling, reset your trip odometer to zero. Most cars have a trip A / trip B button on the instrument cluster or steering wheel controls. Note which trip you reset so you don't accidentally overwrite it before the next fill-up.
Drive normally until you need to refuel
Let the tank drop to roughly a quarter full before returning to fill up. A larger sample of miles produces a more accurate MPG figure — short trips of only 50 or 60 miles introduce more measurement error. Aim for at least 150–200 miles between calculations when you're getting started.
During this tank, drive as you normally would. Don't try to game the number by suddenly driving more gently — you want an accurate picture of your real habits, not an idealized one.
Fill up at the same station and record the gallons
Return to the same station and ideally the same pump island. Fill to the auto-shutoff click again — same as Step 1. Record the number of gallons dispensed from the pump receipt or the display. If you pay inside, ask for a receipt before you leave.
Write down:
- Gallons pumped (e.g., 11.4 gallons)
- Current trip odometer reading (e.g., 312 miles)
- Date and station name (useful for spotting ethanol blend differences later)
Calculate your MPG
The formula is straightforward:
MPG = Miles driven ÷ Gallons used
Using the example numbers above: 312 miles ÷ 11.4 gallons = 27.4 MPG.
That's your real-world fuel economy for that tank. Write it down alongside your other records. After three or four fill-ups, you can average the results for a reliable baseline.
Compare against your trip computer and note the gap
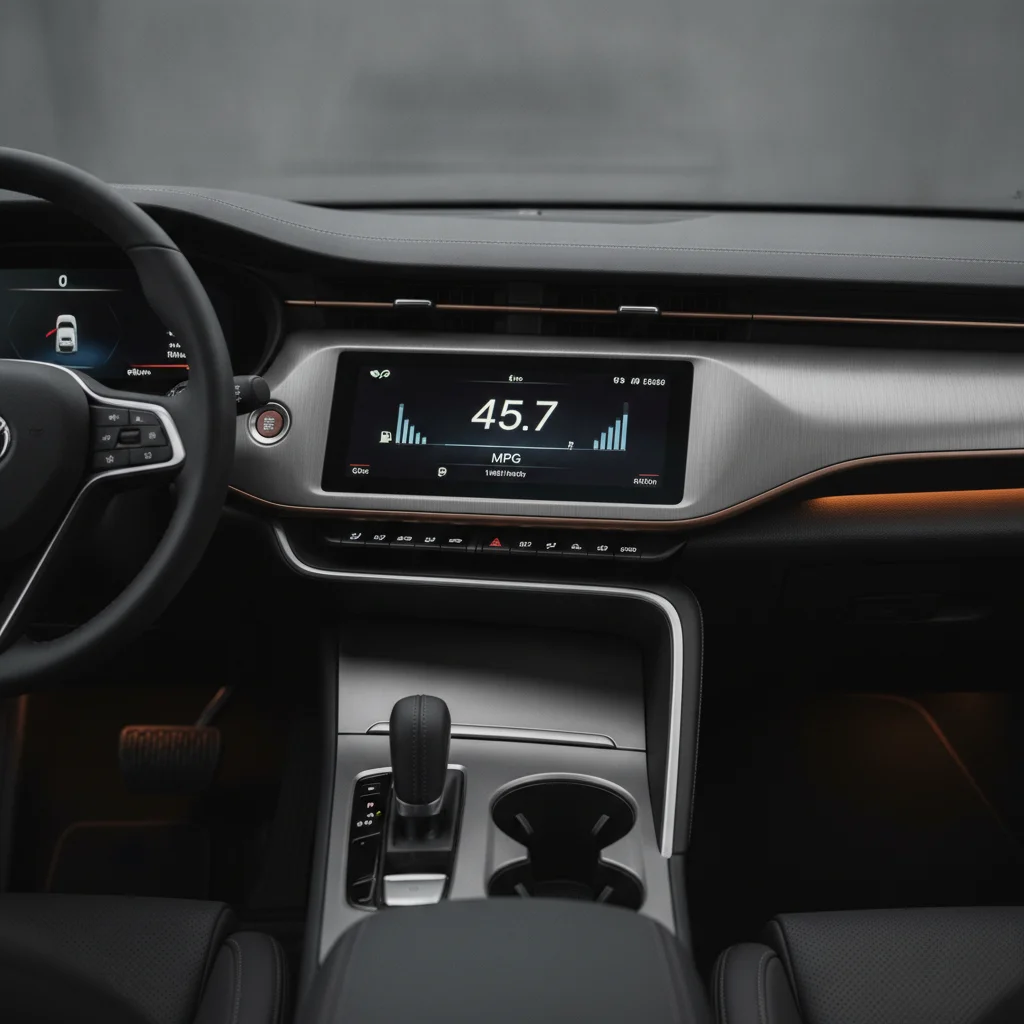
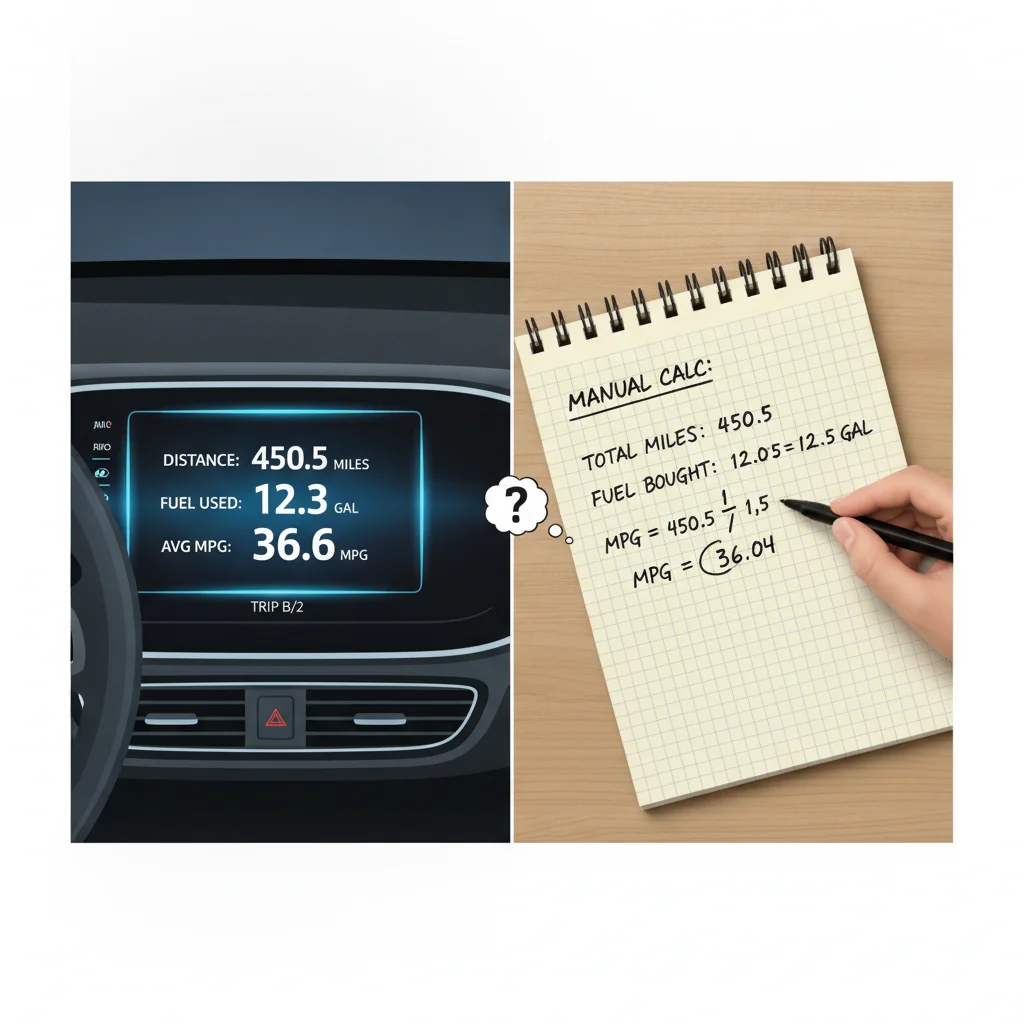
Before you reset the trip odometer for the next tank, note what your trip computer or average fuel economy display is showing. Compare it to your manual calculation.
If the trip computer reads 29.1 MPG and your manual math gives 27.4 MPG, the display is reading about 6% optimistically. This is your personal calibration offset — keep it in mind whenever you're relying on the display for quick estimates.
Reset the trip odometer and repeat for the next tank.
Log your data and look for trends after five fill-ups
After five consecutive manual calculations, you have enough data to draw meaningful conclusions. Look at:
- Your average MPG: This is your personal baseline, more reliable than the EPA estimate for your specific driving pattern.
- Variance: How much do individual tanks swing above and below the average? Large swings may reflect mixed driving weeks rather than a problem.
- Trend direction: Are your numbers slowly declining over several months? That can signal maintenance needs — worn spark plugs, a dirty air filter, or low tire pressure are common culprits.
If you want to go deeper on the mechanical side of what affects these numbers, our guide to your car's fuel systems explains how the underlying technology responds to your driving inputs.
Consistency Beats Precision Every Time
You don't need to be obsessively precise — you need to be consistent. Using the same station, the same fill technique, and the same recording method matters far more than squeezing out a perfectly accurate gallon measurement. Over five or more fill-ups, small errors average out. Inconsistent habits don't.
Let Seasonal Variation Set Expectations
If you start tracking in October, don't be surprised when your December numbers look worse. Winter fuel blends, colder temperatures, and more idling time all reduce efficiency. Build a full year of data before drawing firm conclusions about your car's baseline — that's when seasonal patterns become clear and genuinely useful drops stand out.
Trip Computers Work Best as Relative Indicators
Once you know your personal calibration offset — say, your display reads 4% high — your trip computer becomes a genuinely useful tool for comparing relative performance across routes and driving styles. Use your manual math to anchor the absolute number, then let the display handle day-to-day comparisons.
Once you've collected data for a month or two, you'll likely notice patterns: city-heavy weeks pull your average down, highway trips push it up, and cold snaps trim a few MPG off the top. That's normal. What isn't normal is a sudden drop of 10% or more that persists across multiple fill-ups — that's the kind of signal worth investigating. Our fuel economy audit guide walks through the most common causes systematically so you can work through them without guesswork.
Don't Mistake Normal Variation for a Problem
A single tank that reads 10% below your average is often just a measurement artifact — a slightly under-filled tank, an unusually short-trip week, or a cold stretch. Resist the urge to draw conclusions from one data point. Wait for two or three consecutive low readings before treating a drop as a meaningful signal.
Cheap OBD Adapters Can Drain Your Battery
Low-quality OBD-II Bluetooth adapters stay active even when the car is off, drawing a small but continuous current. Over a few days of non-use, this can drain your battery. Look for adapters with a sleep mode, or simply unplug the adapter when you park for extended periods.
Interpreting Your Data Over Time
Raw numbers are only useful once you have enough of them to identify trends. Three to five consecutive fill-up calculations give you a workable baseline. After that, you're looking for two things: your typical range and deviations from it.
A reasonable way to think about it: if your last eight tanks averaged between 28 and 31 MPG and your next tank comes in at 24 MPG, that's worth investigating. If it bounces back on the following tank, it was likely a measurement error or a short trip-heavy week. If it stays low, something changed.
Common legitimate reasons your average might shift include:
- Season change: Winter blends of gasoline contain slightly less energy, and cold temperatures increase rolling resistance and warm-up idle time. A 5–10% winter drop is normal for most climates.
- Driving pattern shift: More city driving, more idling, or longer warm-up periods all reduce your average.
- Fuel blend change: If a station switches suppliers or you fill up at a different station running a higher ethanol blend, your MPG will reflect that.
- Load or cargo changes: A full car, a roof rack, or a loaded trunk all add aerodynamic drag or weight.
On the other hand, if you recently serviced the car — new air filter, fresh spark plugs, properly inflated tires — you might see a modest improvement. Some maintenance tasks have a measurable impact on fuel economy, and tracking is the only reliable way to verify that the service actually moved the needle for your specific car.
Fuel economy tracking also complements smarter driving habits. If you're planning a long drive and want to maximize range, our road trip efficiency guide covers speed discipline, route planning, and load management in detail. And if you want to understand the mechanical side of why driving style affects efficiency so much, our overview of fuel system technologies explains how fuel injection, variable valve timing, and start-stop systems respond to driver inputs.
A Persistent MPG Drop Is a Repair Signal
If your fuel economy drops noticeably and stays low across multiple fill-ups, treat it as a mechanical signal — not just bad luck. Common culprits include worn spark plugs, a clogged fuel injector, a failing oxygen sensor, or low tire pressure. Use our <a href="/maintenance-and-ownership/ownership-costs/fuel-efficiency/the-fuel-economy-audit-diagnosing-why-your-mpg-suddenly-dropped">fuel economy audit checklist</a> to work through likely causes before the problem compounds. Catching it early almost always means a cheaper fix.
Comparing Methods: Accuracy Trade-Offs
Not all tracking methods are equally accurate, and it's worth knowing what you're giving up when you rely on convenience over rigor.
| Method | Accuracy | Effort | Cost |
|---|---|---|---|
| Manual fill-up calculation | Highest (±1–2%) | Low — a few seconds per fill-up | Free |
| Trip computer / dashboard display | Moderate (typically 2–5% optimistic) | Minimal | Free (built-in) |
| OBD-II app with Bluetooth adapter | High, with trip-level detail | Low after setup | $15–$60 for adapter |
| Fuel tracking apps (manual entry) | Matches manual method | Low — entry at fill-up | Free to low |
| Telematics / connected car apps | High, automated | Very low | Varies by OEM |
The key insight from this table is that your built-in trip computer is not the gold standard. Automakers calibrate these displays to give optimistic readings in part because drivers respond better to encouraging feedback — but that 3% gap compounds into meaningful money over a full year of driving. Running your own calculation once a month gives you a reality check that keeps your expectations honest.
OBD-II apps sit in a sweet spot for drivers who want more than a number but don't want to do math at the pump. Apps like Torque Pro, OBD Fusion, or Car Scanner ELM OBD2 connect to a Bluetooth or Wi-Fi adapter plugged into your car's OBD-II port (usually under the dash on the driver's side). They pull live sensor data — fuel trim, throttle position, manifold pressure — that can reveal inefficiency patterns your dashboard never would. Some apps also flag diagnostic trouble codes, giving you an early warning before the check engine light comes on.
Whichever method you choose, the habit of paying attention to your fuel economy — rather than just your fuel bill — is what produces real insight. The numbers don't lie; they just need someone to read them.

All claims are backed by peer-reviewed research. Sources on request.