Key Takeaways
Why Your Efficiency Display Matters More Than the Window Sticker
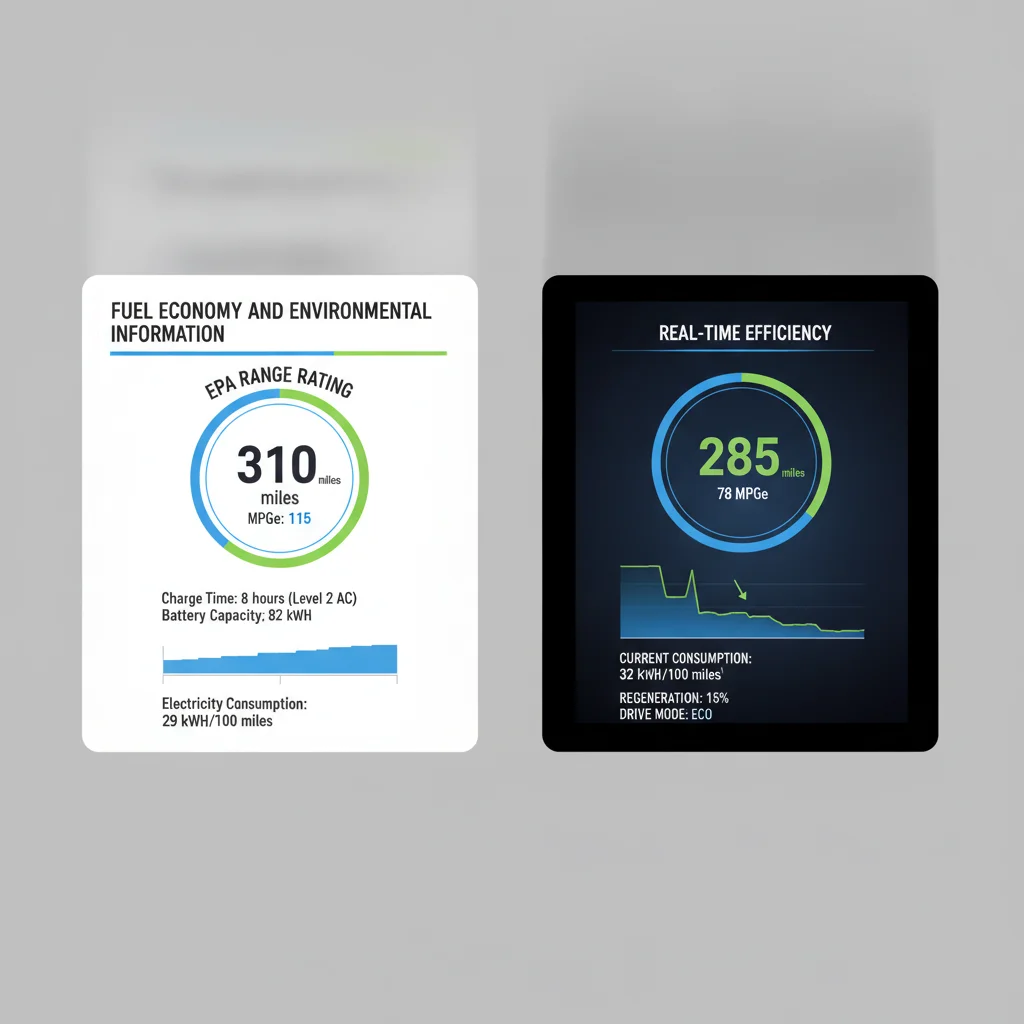
Every new EV carries an EPA-estimated range on its window sticker. That number is produced under controlled laboratory conditions — a standardized drive cycle that doesn't reflect mountain passes, interstate cruising at 80 mph, or January cold snaps. In practice, real-world range deviates meaningfully from the EPA figure, sometimes by 20–30% under demanding conditions.
Your vehicle's onboard energy consumption display closes that gap. Unlike a static sticker, it reflects the actual kilowatt-hours your powertrain is consuming right now, on this road, in these conditions. Learning to read those numbers fluently transforms the display from a background gauge into a genuine trip-planning tool.
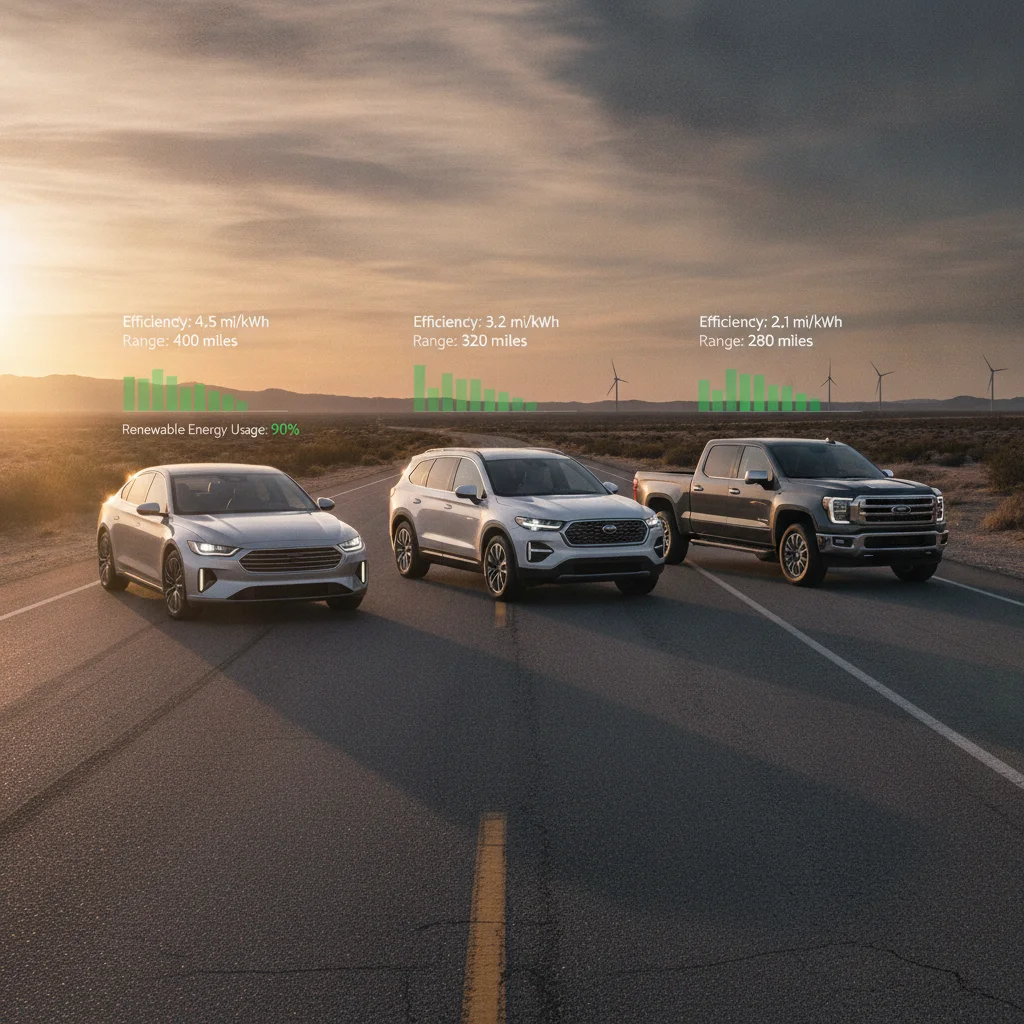
This matters financially, too. Efficiency loss doesn't just shorten your range — it directly affects what you pay per effective mile. As detailed in our analysis of how real-world range changes your effective charging cost, a car consuming 4.5 mi/kWh instead of 3.2 mi/kWh on the same route can yield a meaningfully different cost per mile even when plugging into the same charger at the same price.
Before diving into the step-by-step process, it helps to understand the two core metrics almost every EV surfaces — and what distinguishes them.
Mi/kWh vs. kWh/100 mi: Two Sides of the Same Coin
U.S.-market EVs typically display efficiency in one of two formats:
- Miles per kilowatt-hour (mi/kWh): Analogous to miles per gallon. A higher number is better. A typical efficient EV sedan might achieve 3.5–4.5 mi/kWh in moderate conditions.
- kWh per 100 miles (kWh/100 mi): The EPA's preferred metric, used on the Monroney label. A lower number is better. The EPA average for EVs hovers around 25–35 kWh/100 mi.
To convert between them: divide 100 by the kWh/100 mi figure to get mi/kWh, or divide 100 by mi/kWh to get kWh/100 mi. Many drivers find mi/kWh more intuitive for on-the-fly math, while kWh/100 mi makes it easier to compare models directly against EPA ratings. For segment-to-segment efficiency comparisons, kWh/100 mi is the cleaner unit.
What You'll Need Before You Start
Reading your consumption display doesn't require any external hardware — everything you need is built into the vehicle. That said, a few conditions will make your readings more meaningful from the outset.
What you will need
With these conditions in place, the readings you collect during the steps below will be reliable enough to inform real route and charging decisions.
Vehicle instrument cluster / infotainment screen
Displays real-time and average energy consumption metrics — the primary data source for all steps.
Trip computer reset button or menu option
Resets trip-average efficiency data so each drive produces a clean, isolated reading.
Notepad or spreadsheet (digital or paper)
Records trip efficiency figures over time to build a personal consumption baseline for your routes and conditions.
Third-party EV efficiency app (e.g., A Better Routeplanner, Recurrent)
Cross-references your vehicle's reported consumption against crowd-sourced real-world data for the same model.
Step-by-Step: Reading and Using Your Consumption Display
Follow these steps in sequence during or immediately before a drive. Steps 1–3 establish your baseline; steps 4–7 cover active interpretation while moving; steps 8–10 explain how to use what you've learned after the trip.
Locate Your Vehicle's Energy or Efficiency Screen
Navigate your instrument cluster or central display to the energy consumption view. On most EVs this is labeled Energy, Efficiency, or Range within the trip or vehicle information menu. Common locations include:
- A dedicated tab in the instrument cluster (Tesla, Rivian, GM EVs)
- A swipeable card in the central infotainment screen (Hyundai IONIQ 5, Kia EV6)
- A configurable gauge widget in the driver display (Ford Mustang Mach-E, VW ID.4)
If you cannot locate it, search your owner's manual index under energy monitor, power flow, or eco display — automakers use inconsistent terminology.
Identify the Three Core Data Points on Your Display
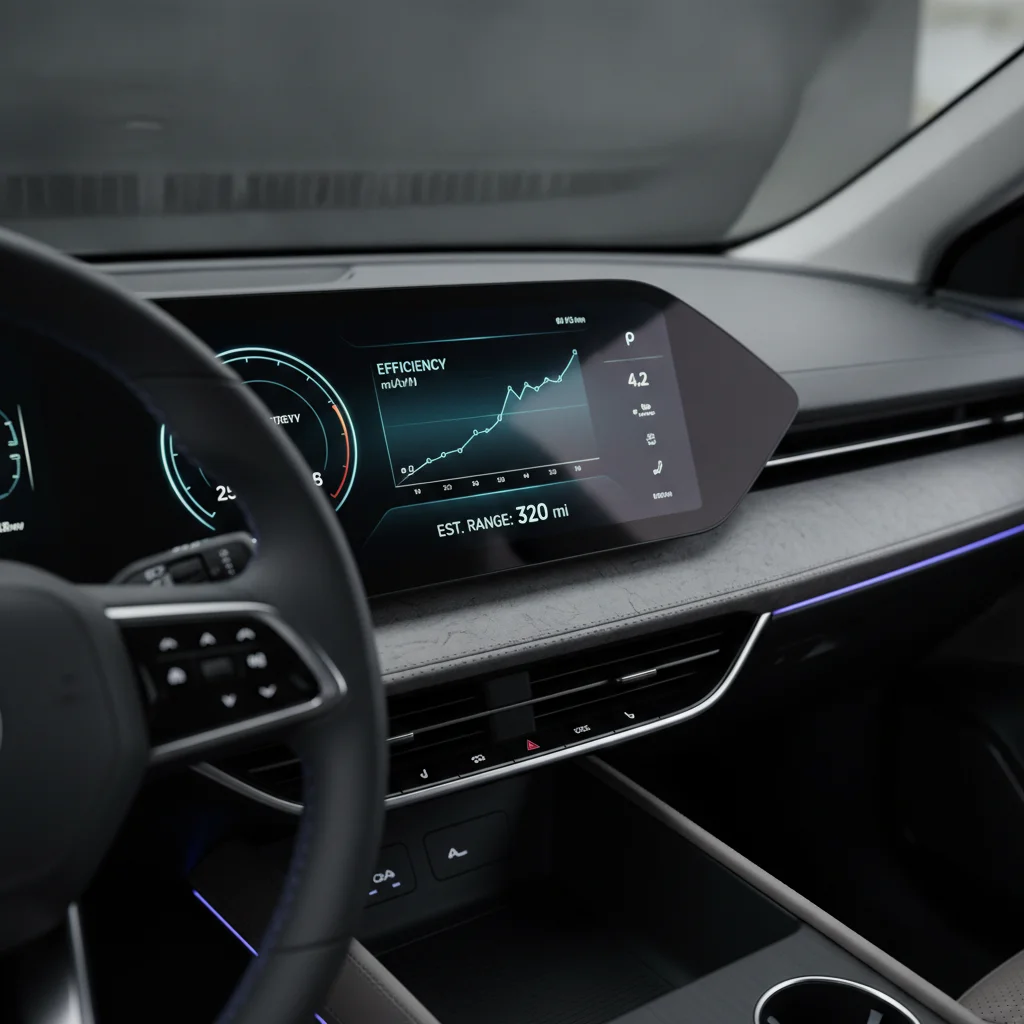
Despite visual differences between brands, almost every EV consumption screen surfaces the same three core figures. Learn to distinguish them:
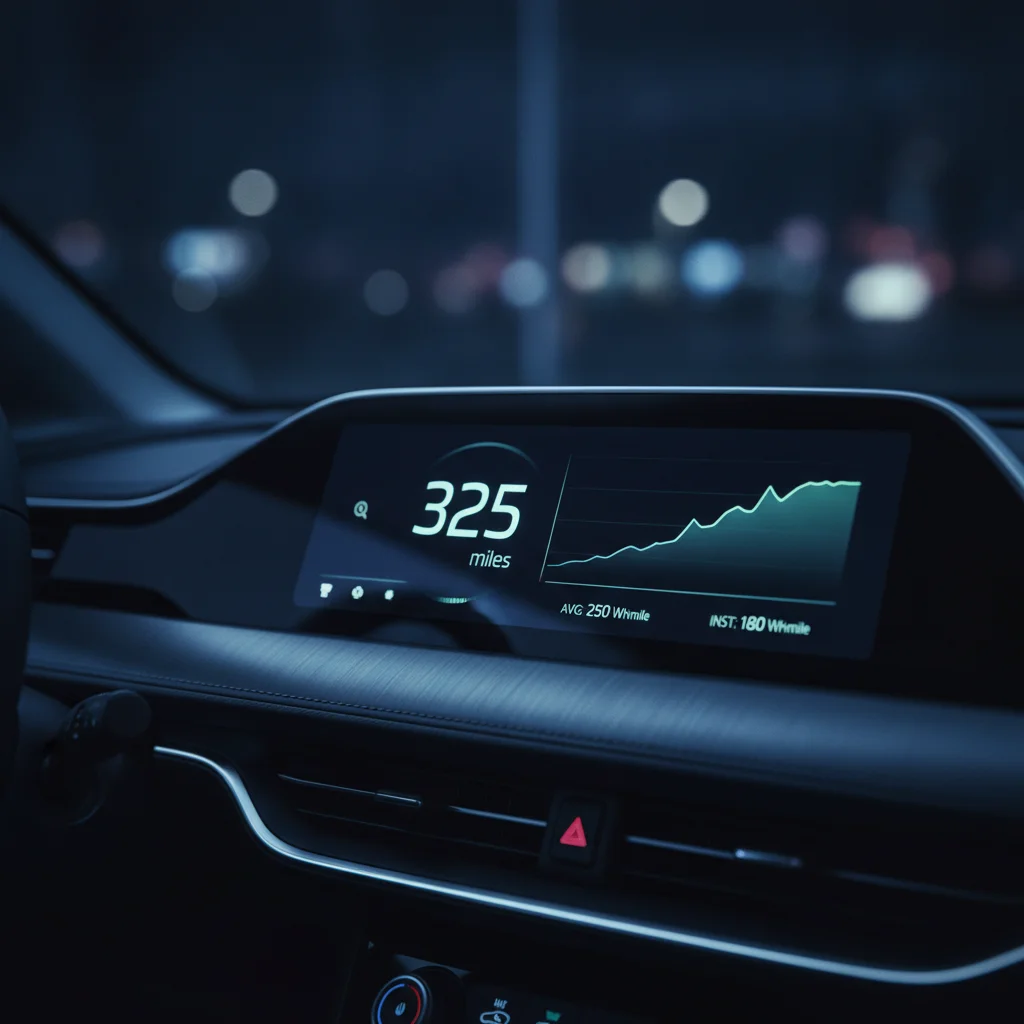
- Instantaneous consumption: Your efficiency right now, in real time. Expressed in mi/kWh or kWh/100 mi. Fluctuates constantly with throttle, terrain, and speed.
- Trip-average consumption: Your average efficiency since the last trip meter reset. This is the most useful number for range planning.
- Estimated remaining range: The vehicle's projected miles remaining, calculated from current battery level and recent consumption history. Treat this as an approximation, not a guarantee.
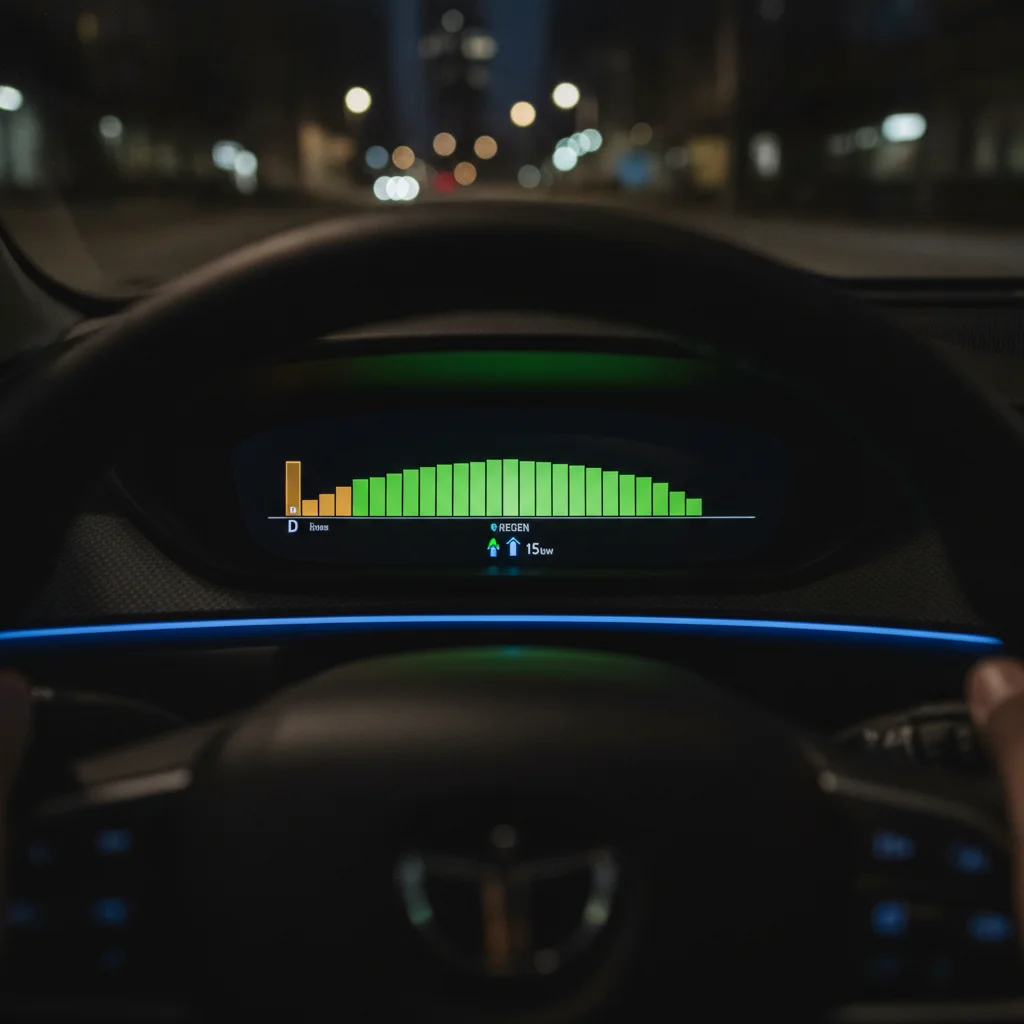
Some displays also show a power flow diagram (animated arrows showing energy moving between battery, motor, and wheels) and a regeneration indicator (a bar or curve showing how much energy is being recovered during deceleration).
Reset Your Trip Meter at the Start of Each Journey
A trip-average consumption figure is only meaningful when it reflects the current trip's conditions. If your last reset was three weeks and 400 miles ago, the average is a blend of multiple weather conditions, loads, and driving styles — not a useful planning tool.
Before departing, reset Trip A (or Trip 1, depending on your vehicle's naming). Reserve Trip B as a long-running odometer you reset monthly or seasonally — it gives you a broader baseline for understanding your vehicle's behavior over time.
Reset procedure varies by vehicle: most require holding the reset button on the steering wheel stalk, pressing a touchscreen button within the trip computer menu, or selecting Reset from the energy screen's options menu.
Establish Your Baseline Consumption for the First 5 Miles
The first five miles of a trip are often the least efficient — the battery may be warming up, cabin climate is working hardest to reach setpoint temperature, and short stop-and-go driving produces lower mi/kWh than steady cruising. Note your trip-average figure after these initial miles and treat it as a lower-bound baseline, not a prediction of your full-trip efficiency.
If your first five miles are primarily highway at consistent speed, your baseline will be more representative of the full journey. Urban cold starts are typically the worst-case scenario and tend to improve as the drive continues.
Monitor Your Short-Term Consumption Trend, Not Just the Current Number
Many EVs display a consumption history bar graph — a scrolling chart showing your efficiency over the past 10–30 miles in segments. This trend line is more actionable than the instantaneous figure because it filters out momentary spikes.
Read the trend as follows:
- Bars consistently above your target efficiency: You have margin — either conditions are favorable or your driving style is efficient.
- Bars declining toward or below target: Investigate the cause — speed increase, headwind, uphill grade, or a climate system drawing more power.
- Sharp single-bar spike followed by recovery: Typically a passing maneuver or steep short climb. Not a concern unless the spike is sustained.
Use the Regeneration Indicator to Improve Your Driving Efficiency
Regenerative braking converts kinetic energy back into stored electricity instead of wasting it as heat through friction brakes. Your display's regeneration indicator — usually a bar that fills in the opposite direction from the acceleration/power bar — shows how actively you're recovering energy.
To maximize regeneration:
- Anticipate slowdowns and lift off the accelerator early, allowing one-pedal deceleration to do the work.
- On long downhill grades, maintain light brake pressure to keep the regen system active rather than coasting to speed and then braking hard at the bottom.
- Watch the regen bar: a fuller bar means more energy is being recovered per second of deceleration.
In city driving, skilled use of regeneration can recover 15–25% of the energy used in acceleration, materially improving your trip-average efficiency.
Adjust Speed to Hit Your Efficiency Target
Aerodynamic drag increases with the square of velocity — meaning the jump from 65 mph to 80 mph costs disproportionately more energy than the jump from 50 mph to 65 mph. For most EVs, the sweet spot for highway efficiency falls between 60–70 mph. Above 75 mph, efficiency declines noticeably for nearly every model.
Use your trip-average display as a real-time speed feedback tool:
- Set a target efficiency (e.g., 3.5 mi/kWh for a trip where your EPA-rated efficiency is 3.8 mi/kWh).
- Adjust cruise control speed in 5 mph increments and observe how the trip average shifts over the next several miles.
- Find the speed at which you meet or beat your target without unacceptable travel time impact.
Record Your End-of-Trip Efficiency Figure
When you arrive at your destination, note the trip-average consumption figure before the display resets or the vehicle powers down. Log it alongside:
- Approximate ambient temperature
- Highway vs. city driving percentage
- Whether climate was running (and at what intensity)
- Passenger and cargo load (if unusual)
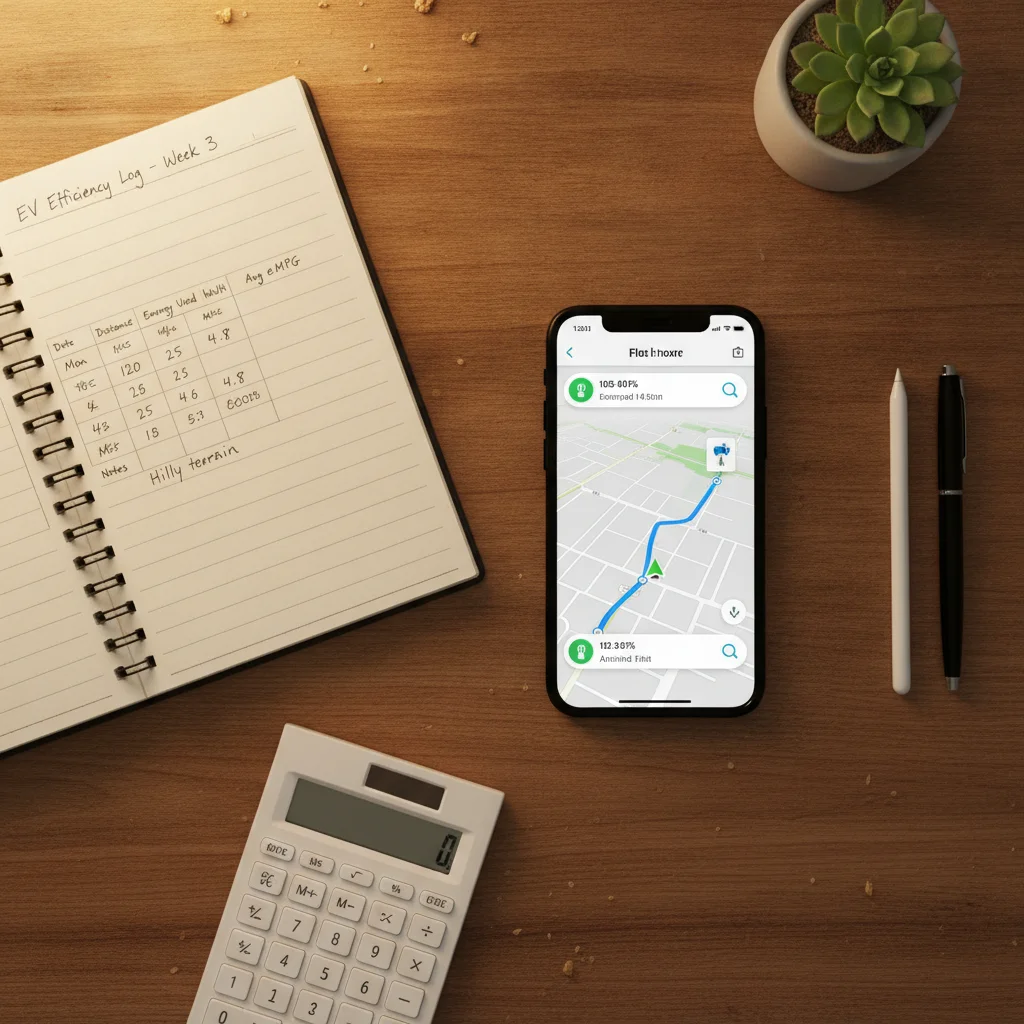
Even a simple notes-app entry builds a personal dataset within a few weeks. That dataset is more predictive for your specific routes and habits than any published EPA figure.
Compare Your Actual Consumption Against EPA-Rated Efficiency
With a few trips logged, you can calculate your personal efficiency ratio — how your real-world consumption compares to the EPA-combined figure for your vehicle.
Formula: (Your average mi/kWh ÷ EPA mi/kWh) × 100 = your efficiency ratio as a percentage of EPA-rated performance.
A ratio of 85–95% is typical for mixed driving in moderate weather. Ratios below 75% in non-winter conditions may indicate aggressive driving habits, frequent highway cruising above 75 mph, or a vehicle that performs below its EPA rating in real-world use — a finding worth noting if you're still within a return window or considering evaluating a vehicle's real-world range before purchase.
Apply Your Efficiency Data to Charging Stop Planning
Use your logged consumption rate — not the vehicle's estimated remaining range — to determine whether you can complete a leg of a trip without an intermediate charge:
- Check your current state of charge and calculate usable kWh remaining. (Usable battery capacity is listed in your owner's manual; subtract 10–15% if you want to avoid arriving below 10% charge.)
- Multiply usable kWh by your expected mi/kWh for this route and conditions.
- Compare that distance against the miles to your destination or next planned charging stop.
Example: 40 kWh usable remaining × 3.2 mi/kWh (your winter highway average) = 128 miles of realistic range. If your next stop is 115 miles away, you have a 13-mile buffer — workable, but not ample. If it's 140 miles away, you need to either charge sooner or reduce speed to improve efficiency.
This approach bypasses the vehicle's range estimate entirely and grounds your decision in your own verified driving data — the most reliable input available.
Once you've worked through these steps a few times, the process becomes second nature. Most experienced EV drivers glance at their short-term consumption curve the way a gas-car driver glances at the tachometer — automatically and without interrupting their attention from the road.
If you're still building intuition for what your specific vehicle's numbers mean, the reference data in our comprehensive EV range reference can help you calibrate expectations by model class and real-world condition.
Build a Personal Efficiency Baseline Quickly
The fastest way to calibrate your intuition is to drive the same route — your daily commute or a familiar errand loop — ten times while logging end-of-trip efficiency. After ten data points, you'll have a reliable average and a sense of how much conditions move the needle. This baseline is far more useful than any published figure for predicting your actual range on familiar routes.
Pre-Conditioning Pays Off in Cold Weather
Scheduling your vehicle to pre-heat or pre-cool the cabin while still connected to a charger means the climate system draws from grid power rather than your battery. Most modern EVs support scheduled departure or remote climate activation via their companion app. On a 20°F morning, pre-conditioning can preserve 10–20 miles of effective range compared to heating a cold cabin on battery power alone.
Highway Driving: Check Efficiency Every 30 Miles
On long highway segments, glance at your trip-average every 30 miles or so and compare it to your pre-trip target. Small speed adjustments made early in a trip have a compounding effect on your final average — a 0.2 mi/kWh improvement over 200 miles can translate to 8–12 miles of additional range, enough to meaningfully change your charging stop strategy.
Common Misreadings and How to Avoid Them
Even attentive drivers misinterpret their consumption data in predictable ways. Recognizing these patterns early prevents the most common range-planning errors.
Trusting the Instant Reading Too Heavily
The instantaneous consumption figure — shown in real time on most displays — swings wildly with throttle input and terrain. Accelerating uphill can spike consumption to 0.5 mi/kWh or worse; coasting downhill with regeneration active might show a net energy recovery. Neither extreme reflects your actual trip average. Always anchor your planning to the trip-average or rolling-average figure, not the instantaneous one.
Ignoring the Climate System's Load
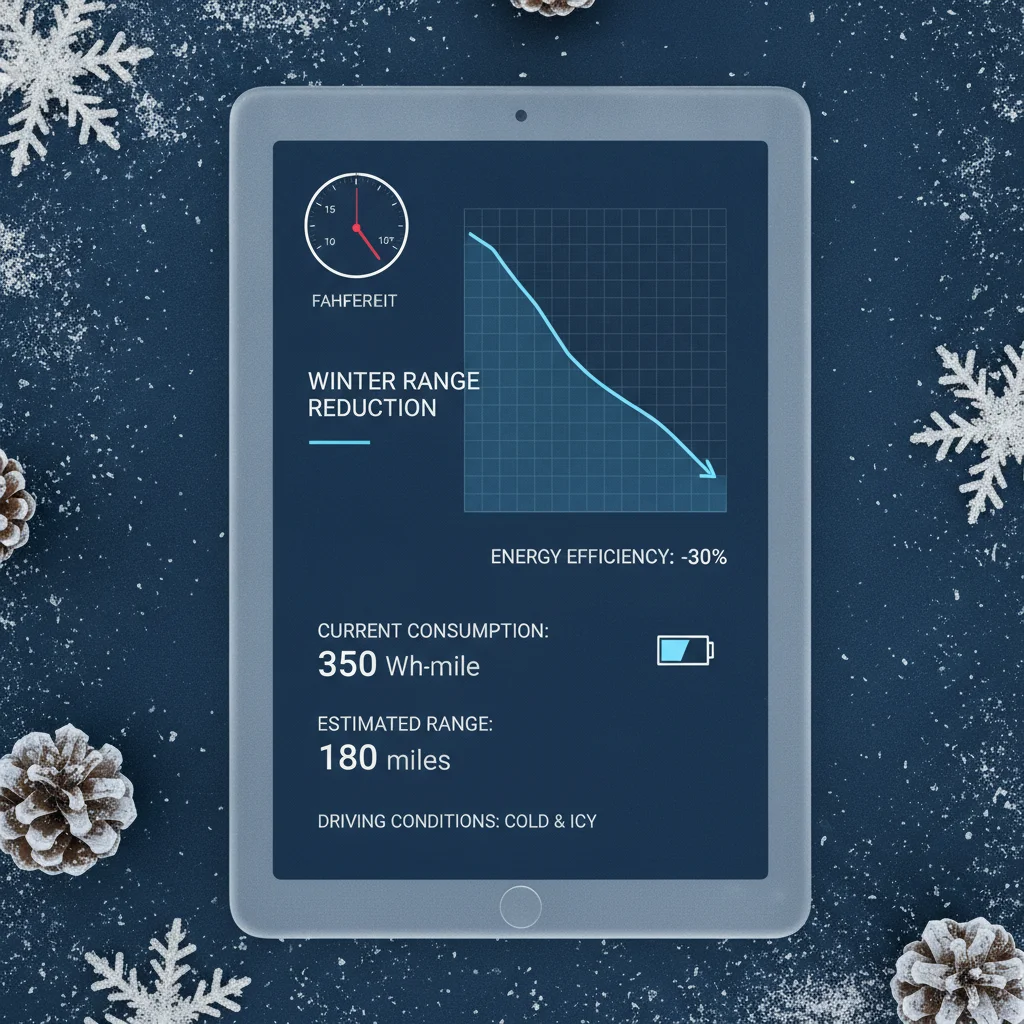
Cabin heating is the single largest non-drivetrain draw on an EV battery, particularly in cold climates. A vehicle showing 3.8 mi/kWh on a 65°F spring day may drop to 2.6 mi/kWh on a 15°F winter morning with the heat running at full output. If your display separates drivetrain consumption from auxiliary loads — many do, via a dedicated climate energy bar — watch that auxiliary figure separately. It can account for 20–40% of total consumption in winter.
Cold Weather Consumption Can Be Severe
At temperatures below 20°F, some EVs lose 30–40% of their EPA-rated range due to battery chemistry limitations and heating demands. If you're relying on your summer efficiency average for winter trip planning, you risk serious range shortfalls. Always use cold-weather-adjusted consumption figures when temperatures are expected to drop below freezing on your route.
Estimated Range Resets After Efficiency Spikes
If you've just descended a long hill and the vehicle logged unusually high energy recovery, the estimated remaining range may display an inflated figure that doesn't reflect what you'll achieve on flat or uphill terrain ahead. In these cases, calculate your own range estimate using the steps in this guide rather than trusting the dashboard projection.
Comparing Across Resets Without Noting Conditions
Trip efficiency data only means something relative to the conditions under which it was gathered. A 3.9 mi/kWh average from a flat-highway summer commute isn't a useful benchmark for a winter mountain drive. When you log trip data for comparison purposes, always note ambient temperature, highway vs. city split, and whether climate was running. Without that context, the numbers mislead rather than inform.
Overlooking State-of-Charge Effects on Range Estimation
Most EVs calculate estimated remaining range by multiplying usable battery capacity by a recent-consumption average. If your recent driving has been unusually efficient (a long downhill segment, for instance), that estimated range figure will be optimistically high. Conversely, a spike in consumption right before the estimate refreshes can make the range number drop sharply. Treat the estimated remaining range as a rough guide, not a precise odometer countdown.
For shoppers who haven't yet committed to a vehicle, these same principles apply at the research stage — a pre-purchase range checklist can help you evaluate how well a given model's efficiency display is designed and what real-world owners report.
Never Plan a Route to Zero Battery Margin
Driving to or below 5% state of charge risks leaving you stranded if a charger is out of service or a route detour adds unexpected miles. Industry guidance and most automaker recommendations suggest planning charging stops to arrive with at least 10–15% remaining. In winter conditions or unfamiliar territory, increase that buffer to 20%. The efficiency display gives you the data to enforce this margin — use it.
Your Display Shows Energy Use, Not Battery Health
Real-time consumption data reflects how efficiently you're driving, not whether your battery is degrading. A declining efficiency average over a single trip is almost always explained by conditions — temperature, speed, terrain — not battery wear. Meaningful degradation reveals itself over months and thousands of miles, not within a single journey. Avoid drawing health conclusions from short-term efficiency swings.
Putting Your Efficiency Data to Work Beyond the Drive
The value of your consumption display doesn't end when you park. The data it generates — when recorded consistently — supports smarter decisions about charging, ownership costs, and long-term battery health tracking.
Estimating Charging Costs from Consumption Data
If you know your trip consumed, say, 18 kWh and your home electricity rate is $0.14/kWh, the energy cost of that trip was roughly $2.52. Scaling that logic to monthly driving gives you a real-world charging budget far more accurate than any formula based on EPA-rated efficiency. For a deeper breakdown of how rate structures affect your actual bill, see our guide to reading your electricity bill as an EV owner.
Tracking Battery Degradation Over Time
A gradual, long-term decline in efficiency under identical conditions — same route, same season, same driving style — can be an early indicator of battery capacity loss. Most degradation is normal and slow; EVs retain the majority of their range capacity well past 100,000 miles under typical use. But if you've been logging trip efficiency data consistently and notice a meaningful step-down that isn't explained by seasonal or behavioral change, it's worth reviewing with a service technician. The EV maintenance basics hub covers what to expect from a battery health check.
Using Efficiency History for Charging Stop Planning
On long road trips, your historical consumption average for similar conditions is more reliable than the vehicle's projected range when deciding whether to stop and charge. If you've driven a similar route before and logged 3.1 mi/kWh, apply that figure to your current state of charge rather than trusting a range estimate calculated from recent urban driving. A quick calculation — remaining usable kWh multiplied by your expected mi/kWh — gives you a conservative distance-to-empty that accounts for your actual driving profile.
The ultimate goal is fluency: reaching a point where a glance at your trip-average figure tells you immediately whether you're ahead of or behind your efficiency target, and adjusting speed or climate use accordingly. That feedback loop — display to behavior to display — is what separates drivers who are perpetually anxious about range from those who manage it confidently on every trip.
Never Plan a Route to Zero Battery Margin
Driving to or below 5% state of charge risks leaving you stranded if a charger is out of service or a route detour adds unexpected miles. Industry guidance and most automaker recommendations suggest planning charging stops to arrive with at least 10–15% remaining. In winter conditions or unfamiliar territory, increase that buffer to 20%. The efficiency display gives you the data to enforce this margin — use it.
Your Display Shows Energy Use, Not Battery Health
Real-time consumption data reflects how efficiently you're driving, not whether your battery is degrading. A declining efficiency average over a single trip is almost always explained by conditions — temperature, speed, terrain — not battery wear. Meaningful degradation reveals itself over months and thousands of miles, not within a single journey. Avoid drawing health conclusions from short-term efficiency swings.
All claims are backed by peer-reviewed research. Sources on request.