
Key Takeaways
Why Reliability Ratings Are Not All Created Equal
Walk into any dealership and you'll see stickers touting awards from JD Power, Consumer Reports badges on car review sites, and five-star claims from manufacturers. The problem is that buyers rarely understand what those numbers actually measure — and that ignorance costs money. A vehicle ranked #1 by JD Power and a vehicle ranked #1 by Consumer Reports can be completely different cars, because these organizations are measuring different things at different points in a vehicle's life.
Reliability, as a concept, sounds straightforward: does the car break down or not? But in practice, data collectors have to make dozens of choices: What counts as a problem? How many miles should the car have? Do you survey owners or send engineers to inspect cars? Do you weight powertrain failures the same as infotainment glitches? Every organization answers these questions differently, which is why a quick Google search for "most reliable SUVs" can return wildly conflicting lists.
The good news is that once you understand each system's methodology, the ratings become genuinely useful. This guide walks you through exactly how to interpret each major source, how to combine them intelligently, and how to use that combined picture to make a smarter purchase decision. It also connects reliability to the financial consequences most buyers overlook — like how a brand's reliability reputation shapes its depreciation curve, which we cover in detail at how reliability reputation shapes depreciation across brands.
Understanding the Major Reliability Sources
Before you can compare ratings intelligently, you need to know what each source is actually measuring. Here's a plain-language breakdown of the four most influential sources buyers encounter.
JD Power Initial Quality Study (IQS)
JD Power surveys new car owners at the 90-day ownership mark. Respondents report problems they've experienced across 223 specific attributes, organized into nine categories including powertrain, features/controls/displays, and driving assistance. Results are expressed as problems per 100 vehicles (PP100) — a lower number is better. A score of 150 PP100 means owners reported 150 problems for every 100 cars surveyed.
What IQS captures well: manufacturing defects, assembly issues, and early software bugs. What it misses: everything that happens after 90 days. A transmission that fails at 40,000 miles doesn't show up here at all.
JD Power Vehicle Dependability Study (VDS)
This is IQS's longer-horizon sibling. VDS surveys owners of three-year-old vehicles about problems experienced in the past 12 months. It uses the same PP100 format. VDS is a much better predictor of mid-term reliability than IQS, though it still doesn't capture issues that emerge after 60,000–100,000 miles.
Consumer Reports Owner Satisfaction and Reliability Surveys
Consumer Reports collects data through annual surveys of its subscribers — a sample that skews toward engaged, detail-oriented car owners. They ask about 17 trouble areas including engine, transmission, electrical, brakes, suspension, and in-car electronics. CR publishes a predicted reliability score for each model, calculated by combining recent model-year data with historical trends for that nameplate. Scores are expressed on a scale of 1–5 or displayed as below average / average / above average relative to all vehicles tested that year.
CR's methodology captures longer-term patterns better than JD Power's IQS, and their large subscriber base provides statistically robust samples for mainstream models. The limitation: subscriber demographics don't represent the full buyer population, and low-volume or niche vehicles may have insufficient sample sizes for reliable data.
RepairPal and Real-World Owner Forums
RepairPal aggregates repair shop data to produce reliability grades and average annual repair cost estimates. This is particularly useful for identifying which trouble areas are expensive, not just frequent. Owner forums (model-specific communities on Reddit, dedicated enthusiast sites) surface problems that surveys miss — especially intermittent issues that owners live with rather than bring to a shop.

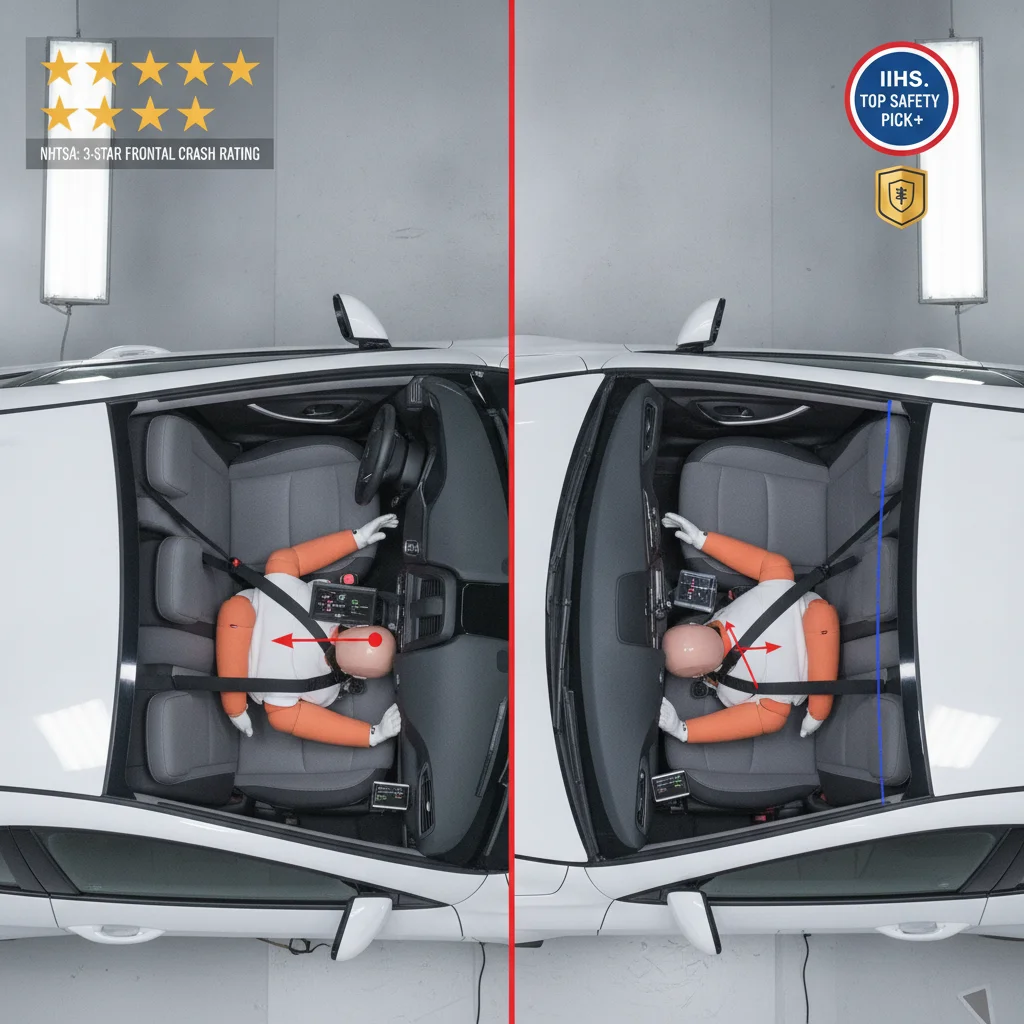
For context on how safety ratings work alongside reliability data, see our companion piece: Safety Ratings Decoded: NHTSA and IIHS Scores Compared. The two are separate metrics, but sophisticated buyers track both.
JD Power Vehicle Dependability Study (VDS)
Provides PP100 problem scores based on surveys of three-year-old vehicle owners — the most useful JD Power data point for long-term reliability.
Consumer Reports Reliability Ratings
Supplies owner-reported trouble area data across 17 categories, with predicted reliability scores for future model years.
RepairPal
Translates reliability grades into average annual repair cost estimates, letting you compare reliability in dollar terms.
Reddit and Model-Specific Owner Forums
Surfaces pattern problems and real-world owner experiences that formal surveys may not capture, especially for recently launched models.
JD Power Initial Quality Study (IQS)
Identifies manufacturing defects and early software issues reported in the first 90 days of ownership.
First-Year Redesigns Carry Real Risk
When a manufacturer completely overhauls a model — new platform, new engine family, new transmission — the previous generation's reliability record is largely irrelevant. Consumer Reports explicitly penalizes newly redesigned models in their predicted reliability scores for this reason. If you're set on a just-redesigned vehicle, budget for the possibility of early recalls and warranty visits, or wait 12–18 months for real owner data to accumulate.
Step-by-Step: How to Compare Reliability Ratings for Any Vehicle
Once you've identified two or three vehicles you're seriously considering, use the process below to build a realistic reliability picture for each one. This isn't about finding a "perfect" car — it's about knowing exactly what you're getting into before you sign.
Look Up the JD Power VDS Score for Your Specific Model
Go to jdpower.com and navigate to the Vehicle Dependability Study results for the most recent year available. Search by your specific model — not brand. Note the PP100 score and compare it to the segment average and industry average shown on the same page.
A score more than 20 PP100 below the segment average is a meaningful differentiator. A score within 10 PP100 of the average is essentially a statistical tie. Don't over-interpret small differences.
Check Consumer Reports Predicted Reliability
Access consumerreports.org (subscription required) and look up your model. Focus on two things: the overall predicted reliability score and the breakdown by trouble area. CR displays reliability across 17 categories — note which specific categories are flagged as problem areas.
Pay particular attention to the powertrain categories (engine major, engine minor, transmission major, transmission minor) and the electrical system. These repairs are typically the most expensive and disruptive. Infotainment problems matter less financially, though they may matter to you personally.
Check RepairPal for Average Annual Repair Costs
Go to repairpal.com, enter your model, and note two figures: the reliability grade (A through F) and the average annual repair cost. Cross-reference the repair cost against comparable models in the same class.
RepairPal data is most useful as a dollar-denominated reality check. A model that scores slightly below average on CR might still be worth buying if the actual repair cost difference is only $150/year. Conversely, a model with a mediocre grade but $900 higher average annual costs than its competitors is a much clearer signal to reconsider.
Search Model-Specific Owner Forums for Pattern Problems
Search Reddit (r/[ModelName] or r/whatcarshouldibuy), dedicated enthusiast forums, and model-specific Facebook groups for your target vehicle. Look for threads about recurring issues that appear across multiple owners — not isolated incidents.
The signal you're looking for is a pattern: multiple owners, same symptom, same mileage range. A single owner reporting a failed alternator at 85,000 miles is noise. Thirty owners reporting the same transmission shudder at 35,000–45,000 miles is a signal worth taking seriously.
Compare Across Your Shortlisted Vehicles Using a Simple Scoring Grid
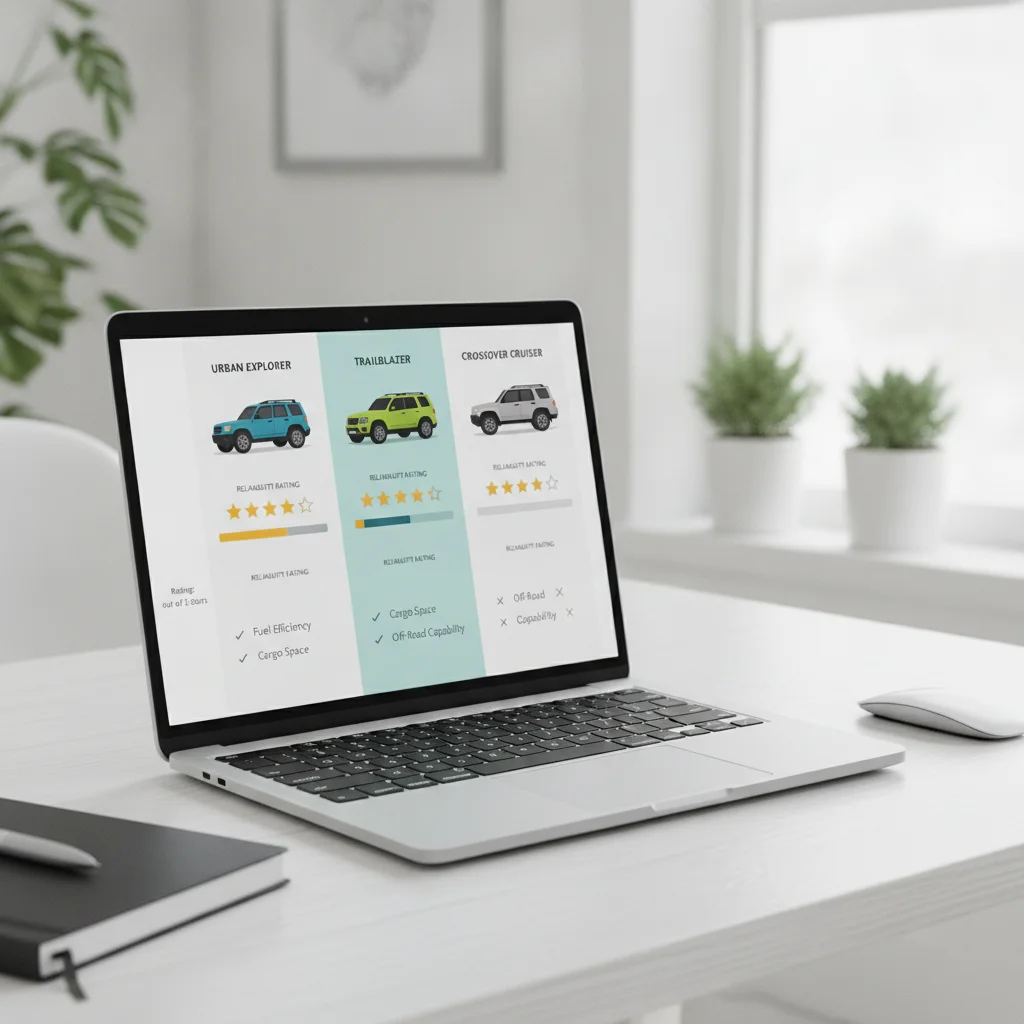
Create a simple table with your two or three candidate vehicles as columns. Score each one across four rows: JD Power VDS (vs. segment average), CR Predicted Reliability, RepairPal Annual Cost, and Forum Red Flags. You don't need a complex formula — just a consistent framework that lets you see the data side by side.
| Metric | Vehicle A | Vehicle B | Vehicle C |
|---|---|---|---|
| JD Power VDS (PP100 vs. segment avg) | Enter score | Enter score | Enter score |
| CR Predicted Reliability | Enter score | Enter score | Enter score |
| RepairPal Annual Cost | Enter cost | Enter cost | Enter cost |
| Forum Pattern Issues | Yes/No | Yes/No | Yes/No |
When two sources agree — both JD Power and CR flag the same vehicle as below average — that convergence is meaningful. When they disagree, dig into why before making a call.
Factor in Model-Year Vintage and Redesign History
Before finalizing your read on any model's reliability, check whether the current model year represents a continuation of an established design or a fresh redesign. Manufacturer websites and automotive news archives (Edmunds, Car and Driver, Motor Trend) clearly document redesign years.
If the model was redesigned within the last one to two years, discount the historical reliability data substantially and rely more heavily on VDS data for the new generation, owner forums for early adopter reports, and CR's explicit 'new model' or 'redesigned model' flags.
Red Flags and Common Misreads
Even diligent buyers make predictable mistakes when interpreting reliability data. Here are the most common traps and how to avoid them.
Confusing Brand-Level Ratings with Model-Level Reality
Toyota consistently earns top-tier reliability scores across both JD Power and Consumer Reports. But that brand-level reputation doesn't transfer equally to every Toyota product. The Toyota Sequoia redesign in 2022 introduced a new hybrid powertrain and earned below-average predicted reliability in its first year. Brand reputation is a starting point, not a conclusion.
Treating a First-Year Redesign as a Known Quantity
When a manufacturer completely redesigns a model — new platform, new engine, new transmission — the prior model's reliability history becomes largely irrelevant. First-year redesigns carry significantly higher risk of early problems because real-world fleet testing at scale hasn't happened yet. If you're considering a newly redesigned model, either wait 12–18 months for owner data to accumulate or price in the elevated risk.
Don't Use IQS to Predict Long-Term Reliability
JD Power's Initial Quality Study is frequently cited in advertising and dealer conversations as a reliability award, but it only captures problems in the first 90 days of ownership. A car that scores well on IQS but poorly on the three-year VDS tells you the manufacturing process is solid but long-term durability is questionable. Always clarify which JD Power study is being referenced before giving it any weight.
Conflating Infotainment Complaints with Mechanical Reliability
JD Power IQS, in particular, includes a significant number of technology-related complaints — owners who can't figure out how to pair their phone or find a frustrating menu structure. These inflate a model's PP100 score without telling you anything about whether the engine or transmission will hold up. When reading IQS results, look at whether the problems are concentrated in the technology/features category or in powertrain and chassis categories.
Ignoring Sample Size Warnings
Consumer Reports flags models where sample sizes are too small to draw reliable conclusions. Pay attention to those flags. A five-circle reliability score based on 40 survey responses is statistically meaningless. Niche vehicles, low-volume luxury models, and recently launched nameplates frequently fall into this category.
If you're cross-shopping new and certified pre-owned vehicles, reliability data is just one piece of the picture. For used cars, you'll also need to evaluate documented history — our guide to reading a vehicle history report without getting misled explains how to interpret Carfax and AutoCheck data accurately. And if reliability across used-car segments is what you're after, see our breakdown of the most reliable used cars by vehicle class.
Use Your Library's CR Subscription
Consumer Reports charges $35–$45/year for a digital subscription, but most U.S. public libraries offer free access to CR's full database through their digital resources portal. Before paying, check your library card account online — it's frequently available at no cost and gives you access to the same reliability data professional buyers use.
Check the Category Breakdown, Not Just the Score
A below-average overall reliability score means very different things depending on where the problems are concentrated. If the trouble areas are all in the infotainment and minor electronics categories, the financial impact is far lower than the same score driven by powertrain or suspension failures. Always drill into the category-level data before drawing conclusions from the headline number.
Translating Reliability Data into Purchase Decisions
Reliability ratings aren't academic — they have direct financial consequences that most buyers underestimate at the point of purchase.
Reliability and Total Cost of Ownership
A vehicle that costs $2,000 more at purchase but saves you $500/year in repairs over five years nets you $500 ahead. RepairPal's annual average repair cost data is useful here: the gap between the most and least reliable vehicles in the same segment can be $400–$900 per year in average repair costs, not counting the opportunity cost of time spent at dealerships.
Reliability and Resale Value
Reliability reputation is one of the most powerful drivers of depreciation rates. Vehicles with strong, consistent reliability ratings retain more of their purchase price over time because buyer demand stays high and the used-car supply carries less perceived risk. This isn't speculation — it's documented in residual value data year after year. Toyota Camry and Honda CR-V consistently outperform segment averages on resale, and their reliability track records are a core reason why. For a deeper look at this dynamic, see how reliability reputation shapes depreciation across brands.
Reliability and Financing Decisions
If you're financing a vehicle over 60–72 months, you'll still be paying it off when the powertrain warranty expires on most mainstream vehicles (typically 5 years/60,000 miles). A vehicle with a weak reliability record in years three through five creates the worst possible scenario: payments continuing while unexpected repair bills pile up. Factor long-term reliability data — VDS, not just IQS — into your loan term calculations.
When you're ready to evaluate a car in person, the new car test drive vs. used car inspection guide covers what to actually look for and listen for behind the wheel. Reliability data tells you what to expect statistically — a test drive tells you how the specific car in front of you behaves today.

Bottom line: reliability ratings are a research tool, not a scorecard. Used correctly — cross-referenced, time-weighted, and filtered by problem category — they give you a genuine probabilistic picture of what you're buying into. Used naively, they're just marketing ammunition for whichever brand happened to score well on whichever metric a salesperson chose to cite. Now you know the difference.
All claims are backed by peer-reviewed research. Sources on request.