Key Takeaways
Why Economic Timing Can Move Your Sale Price by Thousands
Most sellers list their used car when it's convenient for them — right after buying a replacement, when a lease ends, or when the repair bill finally outweighs the car's value. That's understandable, but it leaves real money on the table. The used car market isn't static. It moves with the broader economy in predictable, measurable ways, and sellers who understand those movements consistently walk away with better outcomes than those who don't.
This isn't about trying to time the market perfectly — nobody does that. It's about not listing into an obvious headwind when you have flexibility to wait, and recognizing a tailwind when one arrives. A two- or three-week delay can sometimes mean the difference between $1,500 and $2,800 in your pocket, depending on what the economic signals are doing.
If you want a foundation for how pricing, supply, and demand interact in this market, the used car market pricing explainer covers the core mechanics in detail. What follows here is about reading the external economic forces that move that market — and using those readings to time your listing smarter. For a full strategic framework, see the comprehensive guide on market timing for car sellers.
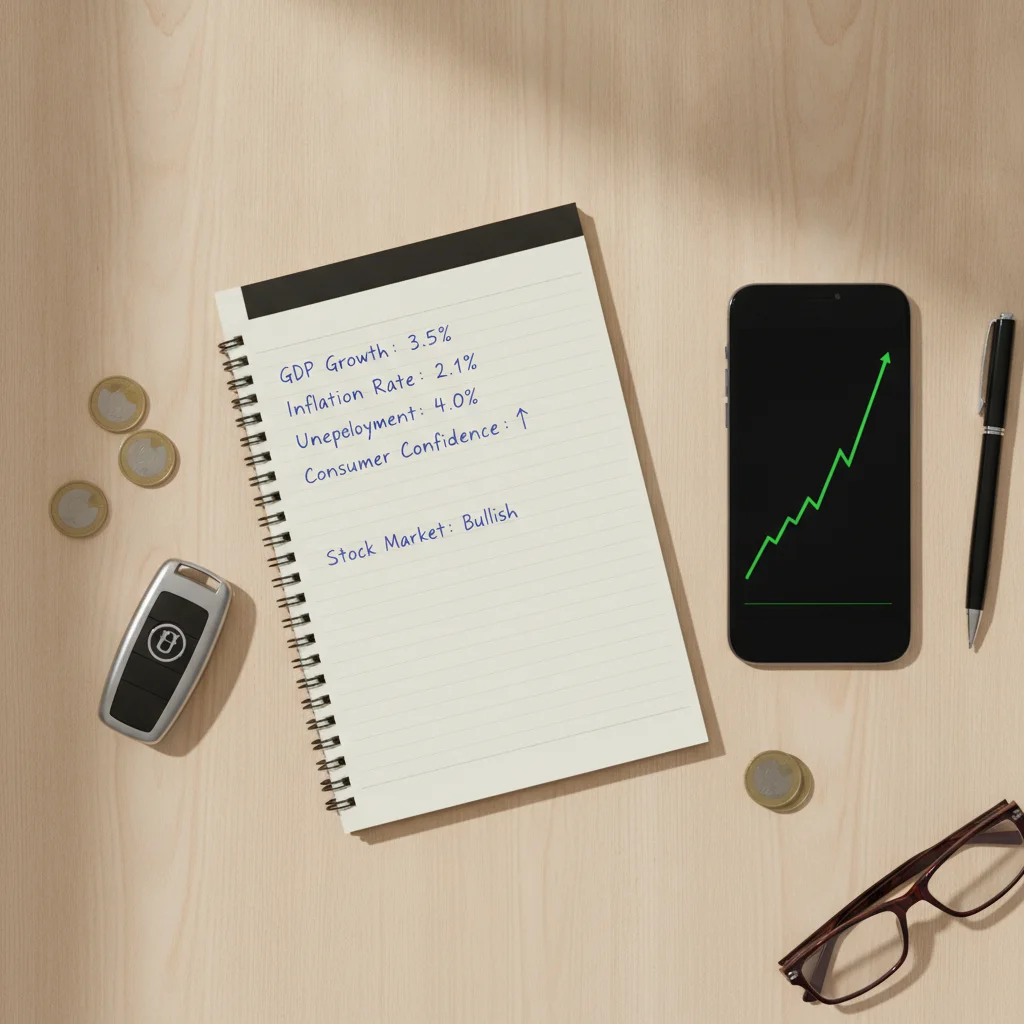
Below are eight economic signals worth tracking. Some are fast-moving; others are slow-burn trends. Together they give you a readable picture of where buyer demand and willingness to pay are heading.
Fuel Price Movements
This one moves fast and the effect is almost immediate. When regular unleaded gasoline climbs past $4.00 or higher — especially when it spikes quickly — buyer behavior shifts within two to four weeks. Shoppers who were browsing trucks and SUVs start cross-shopping midsize sedans and compact crossovers. Hybrid and fuel-efficient models see a measurable bump in search volume on listings platforms.
For sellers, this means a few things depending on what you're selling. If you have a fuel-efficient vehicle — a Prius, a Civic, a compact crossover with solid EPA ratings — a fuel price spike is a legitimate trigger to accelerate your listing timeline. Demand will be higher and you can price closer to the top of the range. If you're selling a half-ton pickup or a V8 muscle car, a sustained fuel price spike is a headwind. It won't kill your sale, but it may compress your buyer pool and soften your best offers.
The AAA weekly fuel gauge report is free and covers national and regional averages. Regional data matters — fuel is more expensive in California than in Texas, and buyer sensitivity varies accordingly. Watch the trend, not just the number. A price that's been rising for three consecutive weeks is more meaningful than a single-week spike.
A fuel price spike can shift buyer demand toward efficient vehicles within two to four weeks.
Consumer Confidence Index
The Conference Board's Consumer Confidence Index (CCI) and the University of Michigan's Consumer Sentiment Index both measure how optimistic or pessimistic households feel about their financial situation and the broader economy. These are published monthly, they're widely reported, and they're genuinely useful for used car sellers.
Here's the practical logic: used cars are a discretionary purchase for most buyers, or at minimum a purchase that can be delayed. When consumer confidence drops sharply, buyers don't disappear — but the ones who remain get more cautious. They negotiate harder, they're more likely to walk away from a deal that isn't clearly right, and they have less tolerance for overpricing. When confidence is high and trending upward, buyers move faster, they're more willing to stretch on price, and private sellers have more leverage.
Think of the CCI as a 4–6 week leading indicator. A reading that drops significantly this month will show up in your listing experience next month. Conversely, a multi-month trend of rising confidence is a green light to price aggressively rather than conservatively. The index isn't perfect, but it's directionally reliable and it costs you nothing to check.
A falling Consumer Confidence Index is a 4–6 week warning sign that buyers will negotiate harder.
Unemployment Rate and Labor Market Health
Used cars are often how working households stay mobile. When unemployment is rising — particularly when layoffs are hitting in waves and showing up in the weekly jobless claims data — buyer demand for used vehicles softens. The people who most need reliable transportation may be short on cash or credit, and the discretionary buyers who have the budget tighten their grip on it.
The monthly jobs report from the Bureau of Labor Statistics is the headline number, but weekly initial jobless claims are more timely. A few weeks of rising claims can signal deteriorating labor market conditions before the monthly unemployment rate reflects it. If you see claims ticking up consistently for four to six weeks, that's worth factoring into your timing.
Conversely, a tight labor market with low unemployment and strong wage growth tends to be a solid environment for private sellers. Buyers have jobs, they feel financially stable, and they're more willing to spend. This is one of the reasons the 2021–2022 used car market was so exceptional — low unemployment and pandemic-driven inventory constraints hit simultaneously.
[in_content_images:1]Rising weekly jobless claims are a leading indicator of softer used car demand — watch them early.
Wholesale Auction Price Indices
This is the signal that most private sellers have never heard of, and it's one of the most useful ones. The Manheim Used Vehicle Value Index — published monthly — tracks the prices that used vehicles fetch at wholesale dealer auctions across the country. These are the prices dealers pay when they're stocking their lots, and they reliably lead retail prices by several weeks.
When the Manheim index is rising, it means dealers are paying more at auction to stock inventory, which means retail prices and private party values will firm up shortly after. When the index is falling, retail prices tend to follow. Savvy sellers use this to get ahead of the curve — list before the drop reaches retail, or wait for a rising index to translate into higher private sale offers.
The full Manheim report requires an industry subscription, but Cox Automotive (Manheim's parent company) publishes monthly summaries publicly. Black Book and J.D. Power also publish wholesale market commentary. Pair this data with the wholesale auction trends guide for a deeper walkthrough of how to use these numbers to time and price your listing.
The Manheim index often signals where retail used car prices are heading before listing sites catch up.
New Car Inventory Levels
This relationship is direct and underappreciated by most private sellers: when new car lots are full and dealers are competing aggressively for buyers, used car values soften. When new car lots are thin and buyers can't find the new vehicle they want at a reasonable price, they flow into the used market and used prices firm up. You're competing with new inventory, whether you realize it or not.
Days' supply is the key metric — it measures how many days' worth of new vehicle inventory a manufacturer or dealer has on hand at current sales rates. A healthy market typically runs around 60 days' supply. Above 80 days is a buyer's market for new cars, which means pressure on used prices. Below 40 days is a seller's market for new cars, which pushes buyers toward used and benefits private sellers.
You can monitor days' supply through monthly reports from Ward's Automotive Intelligence or summaries published by Automotive News and Cox Automotive. Your local dealer lots are also a quick anecdotal check — if you're seeing stacked inventory and dealer incentives in ads, new car supply is elevated. The new car inventory guide for sellers explains this dynamic in full detail.
When new car lots overflow, used car values soften — and when new inventory is scarce, private sellers win.
Interest Rate Environment and Auto Loan Availability
Most used car buyers finance their purchase. When interest rates rise, monthly payments on a given loan amount increase, which effectively shrinks what a buyer can afford. This compresses the price ceiling buyers are willing to reach — not necessarily in a way they articulate, but in a very real way that shows up in offer behavior and negotiation dynamics.
When the Federal Reserve is in a rate-hiking cycle, auto loan rates follow. A buyer who could comfortably finance a $22,000 vehicle at 5% might balk at the same vehicle when rates have pushed to 8% or 9% and the monthly payment has jumped by $50–$60. Private sellers need to be realistic about this — it's not that buyers don't want the car, it's that the financing math has changed.
Watch the Federal Reserve's policy decisions and the weekly average auto loan rates published by Bankrate or the Fed's own H.15 statistical release. When rates are elevated and trending higher, price your vehicle competitively — this isn't the environment to push the top of the range. When rates are falling or expected to fall, you can be more patient with pricing. For a full breakdown of how rate signals work, see the auto loan rate signals guide.
Rising auto loan rates shrink what buyers can afford — price accordingly rather than pushing peak range.
Inflation Data and Used Vehicle CPI
Inflation affects the used car market in two distinct ways. First, the used vehicle component of the Consumer Price Index (CPI) is a direct measure of how used car prices are moving at the economy-wide level. When this component is rising, the market is hot and you're in a good position. When it's falling — as it did sharply in 2023 and 2024 after the pandemic peak — prices are correcting and sellers need to recalibrate expectations.
Second, broader inflation erodes buyer purchasing power over time. When households are paying more for food, housing, and utilities, they have less financial flexibility for big discretionary purchases like a car upgrade. This creates downward pressure on the top of the price range even when the used vehicle CPI itself is stable.
The Bureau of Labor Statistics publishes CPI data monthly, and the used vehicle component is broken out specifically. It's worth checking around release time — usually the second week of the month following the reference period. A consistent downtrend in the used vehicle CPI is a signal to be appropriately humble about your asking price, while an uptick signals recovering demand and firming values.
The used vehicle CPI component tells you whether the overall market is correcting or recovering right now.
Manufacturer Production Announcements and Supply Shocks
This one sits at the intersection of economics and industry news, but it's worth tracking. When a major automaker announces production cuts — due to a strike, a parts shortage, a factory retooling, or financial pressure — new car supply tightens. As explained earlier, thin new car inventory drives buyers into the used market. The COVID semiconductor shortage of 2021 is the most extreme modern example, but smaller supply disruptions happen regularly and create short-term pricing windows for private sellers.
On the flip side, when a manufacturer announces a new model introduction or significant refresh of a popular nameplate, resale values for the outgoing model often soften as buyers anticipate the new version. If you're selling a vehicle that's about to get a major redesign, timing matters — list before the announcement drives depreciation rather than after.
Keep an eye on automotive industry news from sources like Automotive News, The Detroit Free Press, or even mainstream business reporting on major labor negotiations. The automaker production announcement guide covers this from the buyer side, but the logic applies equally to sellers timing their listings.[in_content_images:2]
Production cuts tighten new car supply and lift used car demand — a real window for private sellers.
How to Use These Signals Together
No single indicator tells the whole story. Fuel prices might be screaming upward while consumer confidence is holding steady — that's useful but incomplete information. The real signal comes when multiple indicators align. When fuel costs are rising, unemployment is stable or falling, consumer confidence is trending up, and wholesale auction prices are firming up, you're looking at a genuine seller's market and you should price accordingly and list without delay.
Conversely, if consumer confidence is tanking, new car inventory is flooding back onto dealer lots, and wholesale indices are declining, a private seller needs to be realistic about pricing and potentially patient about timing. Overpricing into a softening market burns days on listing — and days on listing crush your negotiating position.
Build a Simple Monthly Signals Checklist
Once a month, spend 20 minutes checking four things: the Consumer Confidence Index, the Manheim Used Vehicle Value Index summary, the latest AAA fuel price report, and a quick scan of new car inventory at local dealer sites. You're not looking for precision — you're looking for direction. Are conditions improving or deteriorating for sellers? That directional read is all you need to make a smarter timing decision.
Price Your Vehicle to the Current Rate Environment
When auto loan rates are elevated, buyers are quietly constrained by their monthly payment tolerance even if they don't say so directly. Check current average used car loan rates before you set your asking price. If rates have climbed significantly from a year ago, pricing at the top of the KBB or Edmunds range may cost you time on market — and time on market costs you leverage.
One practical workflow: check the Consumer Confidence Index and the Manheim Used Vehicle Value Index on the same day each month — both are publicly available. Pair that with a quick look at the AAA weekly fuel price report and a scan of new car inventory levels through your local dealer sites. That 20-minute monthly check gives you the macro picture without turning into a second job.
Also keep in mind that seasonal demand patterns layer on top of these economic signals. A strong macro environment still doesn't make January the ideal time to sell a convertible. The calendar and the economy work together.
Signals Work Together, Not Independently
A single favorable signal — say, a rising consumer confidence reading — doesn't mean conditions are universally strong for sellers. Economic indicators often give mixed readings. A rising CCI alongside rising interest rates is a mixed picture. Build your timing judgment on the weight of multiple signals trending in the same direction, not any one number in isolation.
Regional Markets Can Diverge from National Trends
National economic data gives you the macro context, but used car markets are local. A city with a major employer doing layoffs may see softening demand even when national unemployment is stable. Conversely, a Sun Belt market with population growth may sustain stronger prices than national indices suggest. Always cross-reference national signals with local listing data — check days on market and price cuts for comparable vehicles in your specific ZIP code.
These Signals Complement Seasonal Patterns
Economic conditions and seasonal demand cycles are two separate forces that stack on top of each other. A strong macro environment doesn't make December the best time to sell a convertible, and a weak economy doesn't negate the spring buying surge entirely. Use the <a href="/selling-your-car/pricing-your-car/market-timing/the-annual-rhythm-of-used-car-demand-a-month-by-month-breakdown">month-by-month demand breakdown</a> alongside these economic signals to find the intersection of seasonal timing and macro conditions.
If you're also trying to understand what your car is worth right now before you time the listing, the valuation tools hub walks through how KBB, Edmunds, and similar platforms estimate current market value — and how to interpret those numbers realistically given current conditions.

All claims are backed by peer-reviewed research. Sources on request.