Key Takeaways
Option A
Time-Based Depreciation
The invisible, calendar-driven value loss every car experiences.
Best for: Understanding why a low-mileage, well-kept car can still lose significant value simply by aging on the calendar.
Option B
Mechanical Wear
The tangible, usage-driven deterioration that buyers can see and price.
Best for: Understanding how physical condition, mileage, and maintenance history directly reduce what a buyer will pay.
If you're pricing a low-mileage older vehicle
Time-Based Depreciation
Your main value challenge is depreciation, not wear. Research comps for same-year models and set expectations that age has already done most of the damage regardless of how pristine the car looks.
If you're pricing a high-mileage vehicle less than five years old
Mechanical Wear
Mileage-driven wear is your biggest discount factor here. A full service record, fresh consumables, and a clean inspection report will do more to protect your price than anything else.
If you want to know where to spend money before listing
Mechanical Wear
Pre-sale repairs and detailing address physical wear directly and can return value. Spending money to fight depreciation — like upgrading tech on an older model — almost never pays back dollar for dollar.
If you're deciding when to sell rather than how to price
Time-Based Depreciation
Depreciation curves have identifiable drop-off points — years one, three, and five are historically steepest. Selling just before those milestones can preserve thousands of dollars in value.
If a buyer is disputing your asking price
Mechanical Wear
Buyers negotiate against what they can see and verify. Counter with documented maintenance, recent repairs, and inspection results — these are concrete rebuttals to wear-based lowball offers.
Two Different Forces, One Lower Price Tag
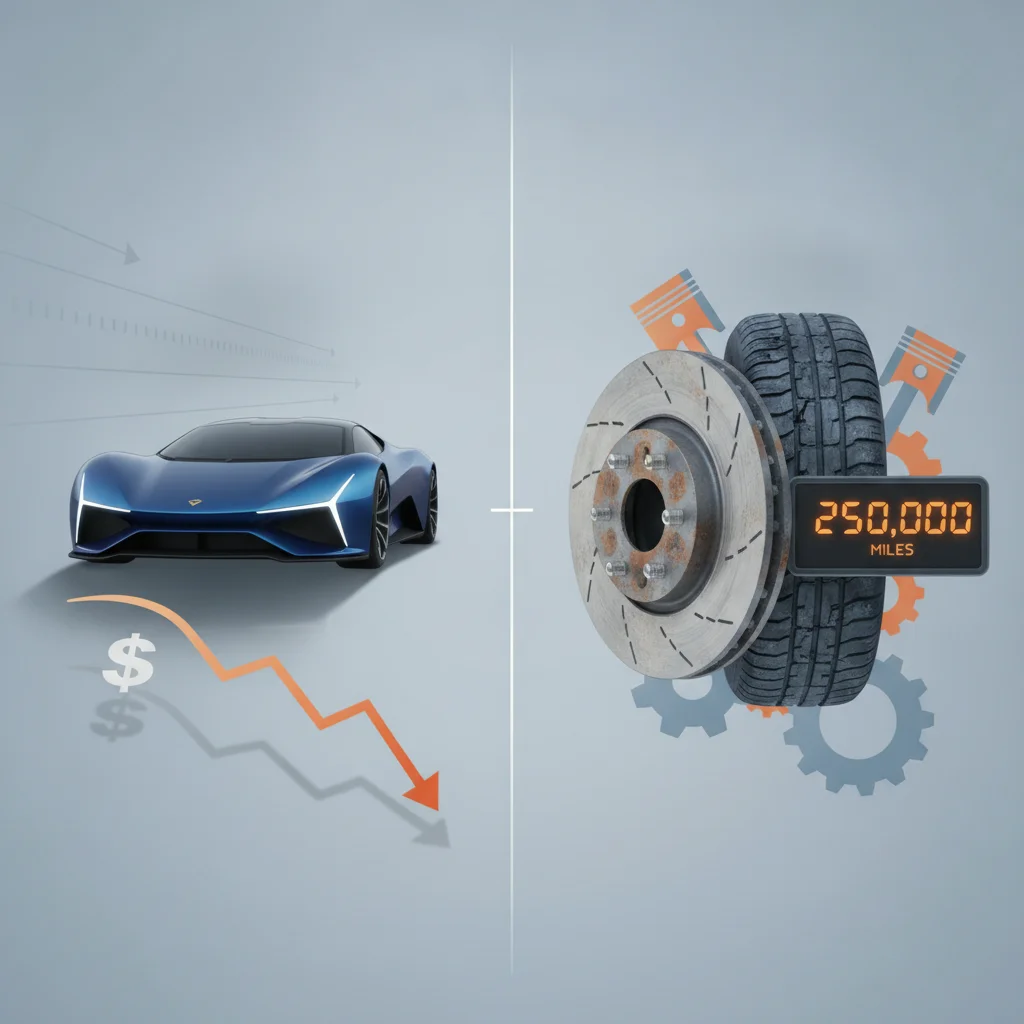
When you list your car for sale and the offers come in lower than expected, it's tempting to blame "depreciation" as a catch-all explanation. But that word actually conflates two distinct forces that reduce value in fundamentally different ways. Understanding the difference isn't just academic — it changes what you do before you list, how you price, and how you respond when a buyer tries to knock money off.
Time-based depreciation is the market's collective judgment that a car is worth less simply because time has passed. A 2020 model year vehicle is worth less than a 2022 model year vehicle of the same make, trim, and condition — full stop. It doesn't matter whether the 2020 sat in a climate-controlled garage the entire time. The market reprices it downward because newer alternatives exist, because technology has moved forward, and because the expected remaining useful life is shorter.
Mechanical wear is something different. It's the physical deterioration that accumulates through actual use: brake pads thinned down, rubber seals hardened, CV joints developing play, engines accumulating combustion deposits. Wear is tangible. A buyer can feel it in a test drive, see it in an inspection report, and quantify it through repair estimates.
Both forces are working on your car simultaneously, and both will show up in the offers you receive. But they respond to entirely different seller strategies. See our full breakdown of how vehicle depreciation works for the foundational mechanics before we go deeper here.
How Time-Based Depreciation Actually Works
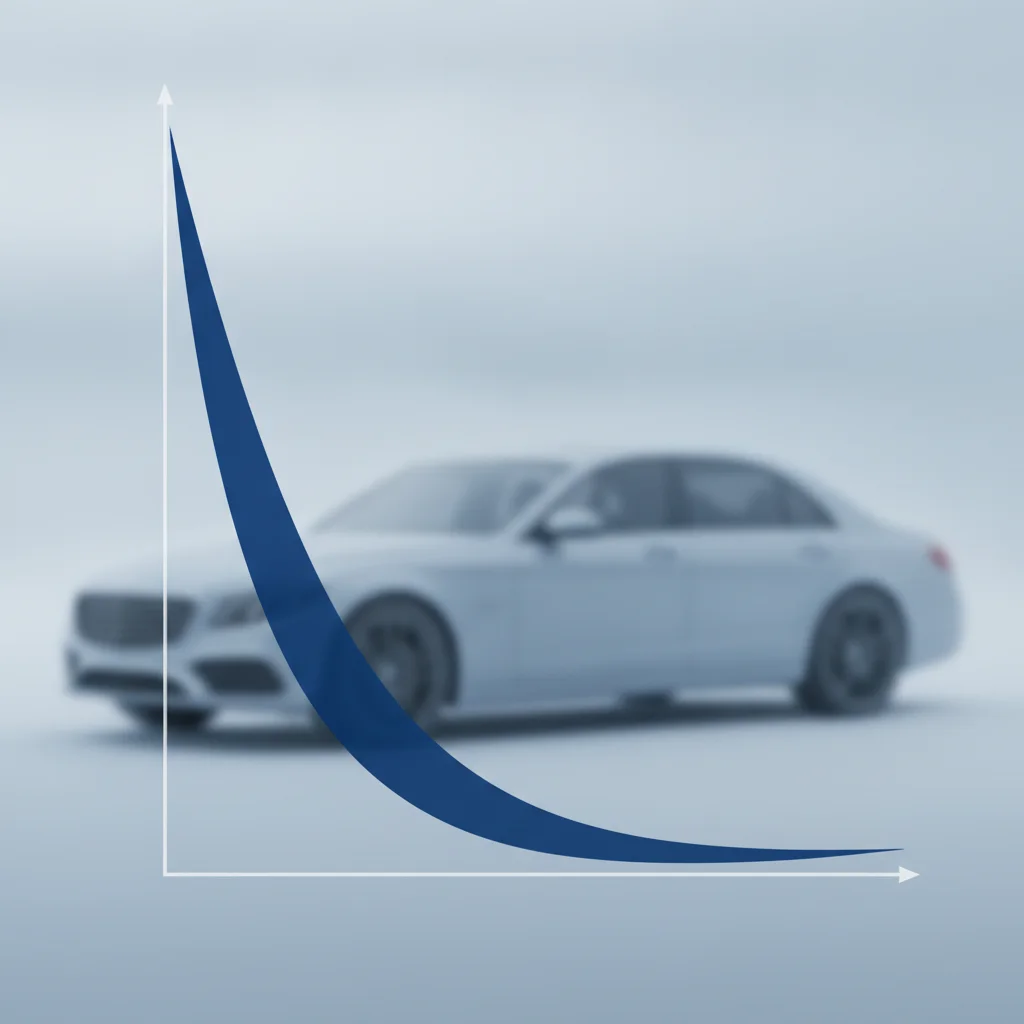
Depreciation follows a curve, not a straight line. The steepest drops happen early — and the math is worth knowing before you set your asking price.
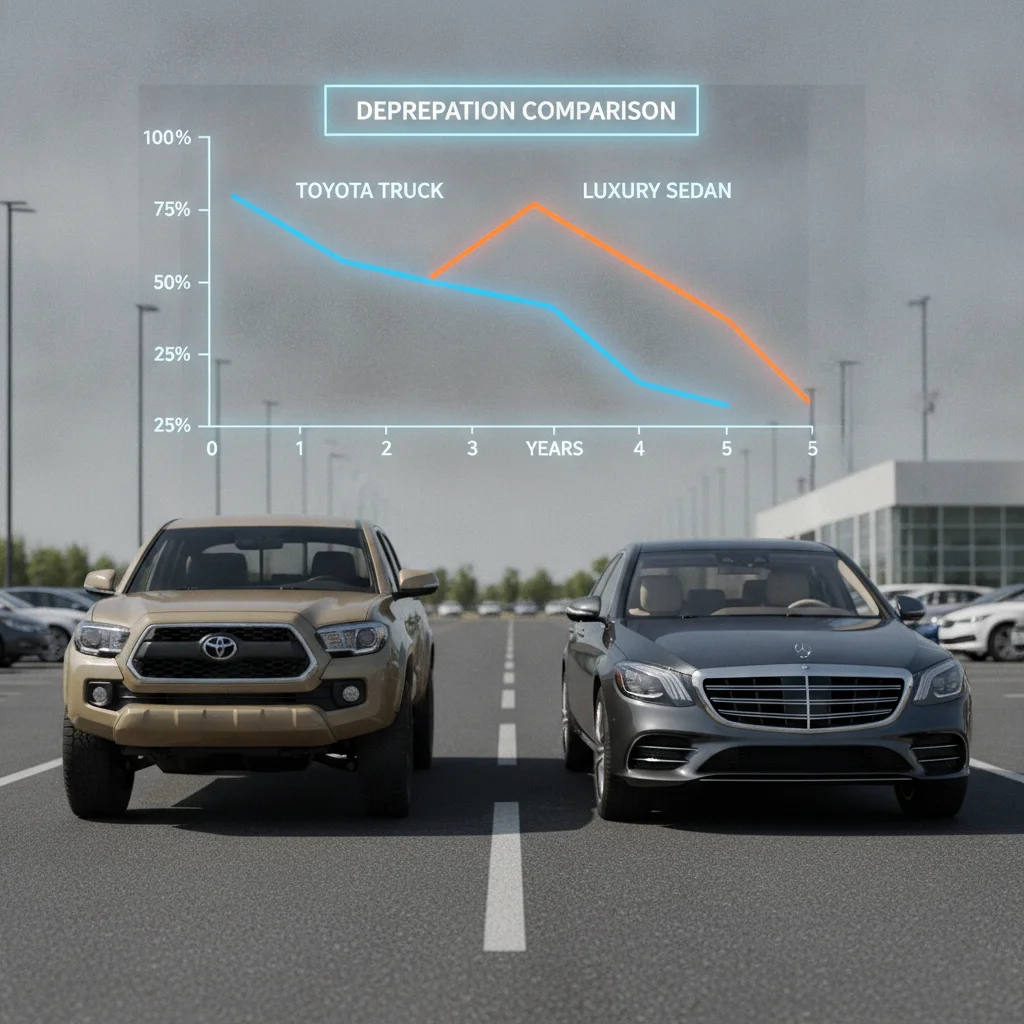
A new car typically loses somewhere between 15% and 25% of its value in the first year alone, largely because the moment it's titled, it becomes a used car and competes in a different market. By year three, cumulative depreciation often reaches 40–50% of the original MSRP. By year five, many models have shed 60% or more.
20%
Average first-year depreciation
Edmunds data consistently shows most new vehicles lose 15–25% of their value within the first 12 months of ownership.
49%
Average five-year depreciation
According to iSeeCars.com analysis, the average vehicle retains roughly 51 cents on the dollar after five years.
$1,200
Typical wear-related discount at 80k miles
Carfax market analysis suggests buyers discount high-mileage vehicles by $800–$1,500 relative to lower-mileage same-year comps.
37%
Vehicles sold without service records
A 2023 Cox Automotive study found more than a third of used car sellers provide no service documentation, a factor buyers use to justify lower offers.
3–7%
Price premium for documented service history
Vehicles with complete dealer-verified service records command measurably higher private-party prices across most segments, per Kelley Blue Book research.
After year five, the curve flattens considerably. A seven-year-old car that's already lost 65% of its original value won't lose another 65% in the next seven years — the floor is partly set by the cost of alternatives and by what the vehicle can still do reliably. This is why buying a three-to-five-year-old used car is often described as the sweet spot for value: you let the first owner absorb the steepest depreciation while the car still has plenty of useful life ahead.
What drives the slope of the curve? Several factors have nothing to do with your individual car's condition:
- Model year transitions: When a manufacturer releases a redesigned model, prior-generation vehicles reprice downward regardless of how well-maintained they are.
- New car incentives: Heavy factory rebates on new vehicles push buyers away from used alternatives, depressing used prices market-wide.
- Fuel economy shifts: A spike in gas prices can crater the value of large trucks and SUVs in a matter of weeks, or conversely boost hybrid and EV values.
- Technology obsolescence: A car without Apple CarPlay or advanced driver-assistance systems that were standard on newer models faces a perception gap buyers discount for.
None of these forces are under a seller's control. You cannot detail or repair your way out of time-based depreciation. What you can do is time your sale to stay ahead of the steepest drops — which is where understanding the market timing dynamics of your segment pays off. You can also choose models that depreciate more slowly to begin with; slow depreciators vs. fast depreciators covers exactly which factors determine that curve.
Why Low Mileage Doesn't Cancel Out Age
A common seller assumption is that low mileage fully offsets the impact of model-year age. It doesn't — and buyers know it. A 2017 vehicle with 25,000 miles has experienced seven years of rubber degradation, seal aging, and technology obsolescence regardless of how few times it turned a wheel. Valuation tools already discount for this. While low mileage does provide some premium, don't expect it to erase the depreciation accumulated over multiple model years.
How Certified Pre-Owned Programs Interact With Both Forces
CPO programs are essentially dealer-administered wear remediation paired with a warranty that partially offsets depreciation risk for the buyer. When a manufacturer certifies a vehicle, they address the most significant wear items (tires, brakes, fluids) and offer warranty protection against future wear costs. Buyers pay a premium for this certainty — which is why CPO vehicles routinely sell for 5–10% above non-certified equivalents of the same age and mileage. Private sellers can't replicate a CPO certification, but they can approximate its appeal through pre-sale inspections, complete service records, and warranty transfer where available.
How Mechanical Wear Actually Works
While depreciation happens on the calendar, wear happens on the odometer — and on how that odometer was accumulated. A car with 80,000 highway miles on a well-maintained engine is in genuinely better mechanical condition than the same model with 60,000 miles of urban stop-and-go driving and irregular oil changes. Buyers who know what they're looking for will price both cars differently, and correctly so.
Mechanical wear shows up in several categories:
- Consumable components
- Brake pads, tires, belts, filters, and fluids have defined service lives. A buyer who sees 6/32nds of tread left on tires and brake pads at 3mm knows they're writing a check for replacements within a year. They'll factor that cost directly into their offer.
- Drivetrain wear
- Transmissions, differentials, and wheel bearings accumulate wear that's less visible but more expensive. A test drive that reveals hesitation on shifts or a low hum from the rear axle signals imminent repair costs in the $800–$2,500 range — and buyers know it.
- Seals and rubber components
- Gaskets, bushings, and weather seals degrade with heat cycles and age. A car with oil seepage around the valve cover or cracked door seals signals deferred maintenance that makes buyers nervous about what else might be lurking.
- Body and structural fatigue
- Rust, stress cracks around suspension mounting points, and uneven panel gaps from minor collisions all constitute wear in the broadest sense — physical evidence that the car has been used and has limitations as a result.
The key distinction from depreciation: wear is negotiable at the inspection stage. A buyer can get a quote for what repairs cost and ask for that dollar amount off the price. Depreciation is already baked into market comps — it's not something either party can negotiate around, because every competing vehicle has the same age-related discount applied.
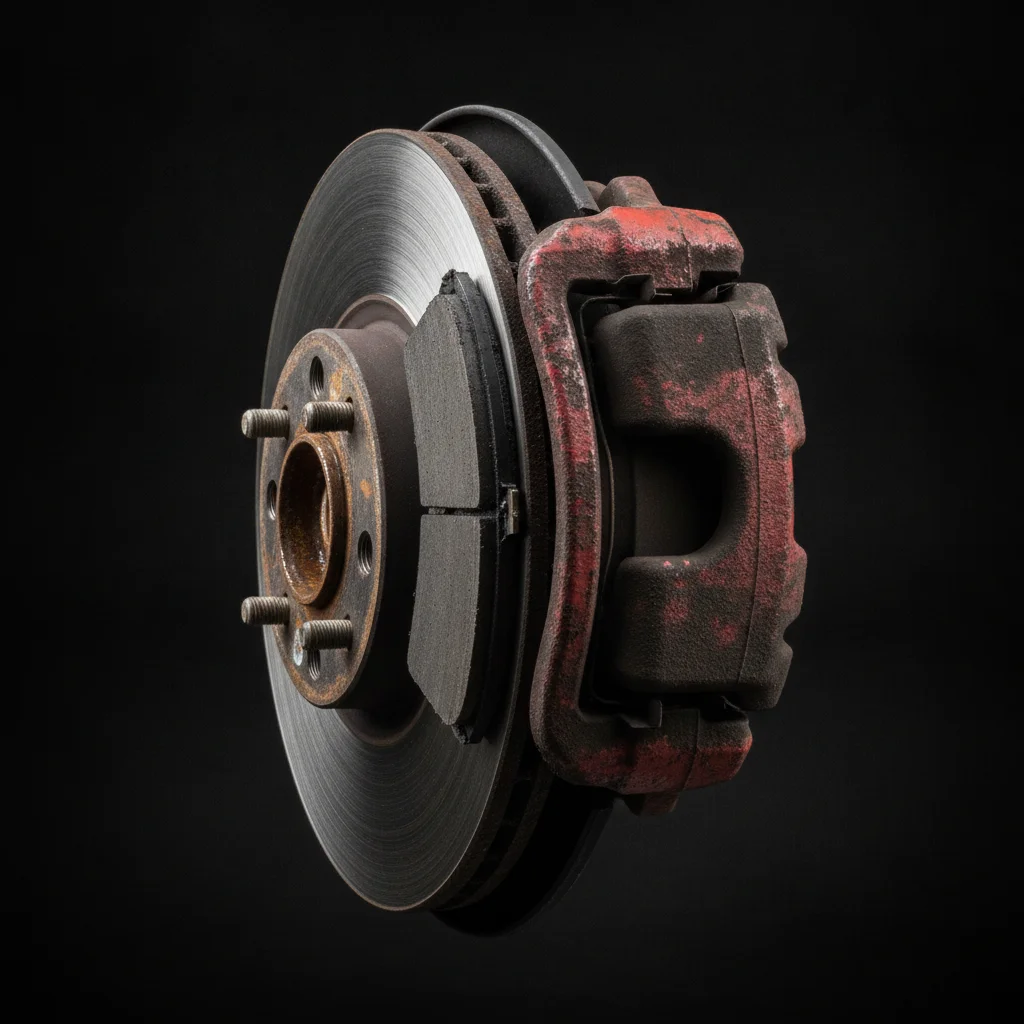
This is also why service records have real monetary value. A seller who can show consistent oil changes at manufacturer-specified intervals, timing belt replacement at 90,000 miles, and brake service receipts is demonstrating that wear has been managed. That documentation removes uncertainty — and buyers pay more when uncertainty is lower. See the hidden depreciation triggers most sellers miss for additional physical condition factors that quietly drag down offers.
Side-by-Side: Where They Overlap and Where They Diverge
It's worth being precise about where these two forces interact — because they're not always independent of each other.
| Criterion | Time-Based Depreciation | Mechanical Wear |
|---|---|---|
| Primary driver | Calendar age and market perception | Mileage, use intensity, maintenance |
| Visible to buyer? | No — reflected in comp prices | Yes — inspection, test drive, records |
| Seller can reduce it? | No — only time the sale better | Yes — repairs, service, documentation |
| Negotiated at inspection? | No — already in baseline value | Yes — buyers cite repair quotes |
| Worst years for impact | Years 1, 3, and 5 post-purchase | After 60,000–75,000 miles typically |
| Affected by garage storage? | Minimally — calendar still runs | Yes — low-use cars wear less |
| Service records help? | Indirectly — minor confidence boost | Directly — reduces uncertainty discount |
| Recoverable before sale? | Not recoverable | Partially recoverable with investment |
| Market-wide or car-specific? | Market-wide for the model year | Specific to this individual vehicle |
Notice a few important distinctions in that table. Age contributes to both forces — a 10-year-old car has depreciated on the calendar and has had more time for rubber components to degrade, even at low mileage. This overlap is why very old, very low-mileage vehicles don't command the premium sellers often expect: the market discounts them for both elapsed time and likely seal/rubber deterioration regardless of the odometer reading.
Conversely, a high-mileage but younger vehicle (say, a 3-year-old car with 90,000 miles from highway commuting) has accumulated wear but hasn't depreciated as aggressively on the calendar. Its depreciation hit is more modest; its wear-related discount is the dominant factor. Fix what you can fix mechanically, and you may recover meaningful price ground.
The practical takeaway: when you identify which force is doing more damage to your specific car's value, you know where to direct your energy. Sellers frequently misdiagnose this. They invest in expensive reconditioning on a 12-year-old vehicle when depreciation has already set the ceiling — no amount of detailing will recover a car that the market has already repriced to $6,000 regardless of condition. Meanwhile, sellers of high-mileage younger vehicles sometimes underprice without fighting back with documentation, losing money they didn't have to lose.
What Sellers Can Actually Do About Each Force
Let's be direct: you have limited control over time-based depreciation and significant control over mechanical wear's impact on your final price. Here's how to work with that reality.
Managing Depreciation's Impact
You can't stop depreciation, but you can time around it and set honest expectations based on it.
- Know where your car sits on the depreciation curve. Pull Kelley Blue Book, Edmunds, and NADA values for your year/make/trim/mileage. Those tools already incorporate market depreciation. Don't price above them expecting buyers to ignore it.
- Sell before major drop-off points. If your car is approaching the three-year or five-year mark, the depreciation curve steepens noticeably. Selling at 2.5 years instead of 3.5 years can preserve several thousand dollars. The same logic applies at the 60,000–70,000 mile range, which some buyers treat as a psychological threshold.
- Watch for model refreshes. If your manufacturer is releasing a redesigned version of your model next model year, your current-generation vehicle will reprice downward as soon as the new version hits lots. Selling before the refresh announcement protects value.
- Accept that condition premiums have a ceiling. A perfect-condition older vehicle commands a premium over a rough one of the same year, but that premium is bounded by what the market has already decided the model year is worth. Understand how depreciation basics shape overall ownership costs to calibrate those expectations.
Recovering Value from Mechanical Wear
This is where seller effort actually returns money. Specific, targeted actions before listing can shift offers meaningfully.
- Spend on high-visibility consumables. New tires on a car that needs them can recover $500–$1,500 in buyer confidence — buyers see bald tires and mentally tack on replacement costs plus hassle. Fresh brake pads and rotors signal the same. These are items buyers inspect first.
- Fix the oil leak, skip the transmission rebuild. Minor seepage addressed with a fresh gasket costs $150–$400 and removes a major psychological deterrent. A $2,800 transmission rebuild on a $9,000 car rarely returns dollar for dollar. Prioritize fixes that remove buyer anxiety over fixes that exceed the value they add.
- Compile every service record you have. Even partial records are better than none. A folder of oil change receipts, inspection stickers, and repair invoices tells a story of a cared-for vehicle. This directly addresses the uncertainty discount buyers build into their offers.
- Get a pre-sale inspection report. A clean third-party inspection from a reputable shop ($100–$150) is one of the highest-ROI pre-sale investments available. It removes the buyer's incentive to demand their own inspection as a negotiating tool, and it positions you as a transparent seller.

The new car vs. used car depreciation exposure comparison is also worth reading if you're planning your next purchase alongside this sale — understanding how you'll be on the buying side of these same forces shapes smarter decisions on both ends of the transaction. And don't underestimate external market forces either; market supply can move your price independently of both wear and time-based depreciation.
Setting a Price That Honestly Accounts for Both
The most common seller pricing mistake is treating depreciation and mechanical wear as one combined blob of "the car has lost value" without distinguishing what's driving each dollar of discount. Here's a simple framework to separate them before you set your asking price.
Step 1: Establish Your Depreciation Baseline
Look up your car's current market value using at least two valuation tools (Kelley Blue Book and Edmunds are standard). Use the private party value for a private sale, not the trade-in value. Input your actual mileage and select the condition grade honestly. The number you get back is essentially the market's depreciation-adjusted price for a vehicle in average condition for its age and mileage. This is your starting point — not a ceiling to inflate from, but a realistic anchor.
Step 2: Assess Your Wear Premium or Discount
Compare your car's actual condition against what the valuation tool defines as "average" for your mileage range. Most tools define average condition clearly. If your car is genuinely above average — full service history, no deferred maintenance, recent consumables, no cosmetic damage — you may have a modest premium argument of 3–7% above the baseline. If your car has known mechanical issues, deferred maintenance, or above-average wear for its mileage, expect buyers to discount 5–15% below baseline, and price accordingly rather than pricing high and watching the listing sit.
Step 3: Check for Depreciation Accelerators
Layer in any additional depreciation factors beyond simple age: a model refresh that's already hit the market, a recall that hasn't been resolved, documented accident history on the Carfax, or regional market oversupply in your specific segment. These are hidden depreciation triggers that push your effective baseline lower than the valuation tools reflect.
Step 4: Price with a Negotiation Buffer, Not an Optimism Surcharge
Build in 5–8% above your target selling price to accommodate normal negotiation. Do not build in 15–20% because you feel your car is special. Overpriced listings generate fewer inquiries, which means less competition among buyers, which paradoxically results in lower final sale prices. A competitively priced, well-documented listing moves faster and often closer to asking price than an inflated one that lingers for weeks.

Sellers who work through these four steps — anchoring to depreciation data, honestly assessing wear, checking for accelerators, and pricing with a rational buffer — consistently report fewer lowball offers and faster sales. The approach isn't complicated. It just requires separating the two forces that most sellers collapse into one frustrating, unexplained number.

All claims are backed by peer-reviewed research. Sources on request.