Key Takeaways
Aerodynamic Drag & Fuel Economy
Aerodynamic drag is the resistance your car fights against as it pushes through the air. The faster you drive, the harder your engine has to work to overcome that resistance — and that extra work burns more fuel. Unlike city driving, where stop-and-go habits dominate your fuel bill, highway speed is the single biggest variable you control on the open road.
Aerodynamic drag force increases with the square of velocity, while the power required to overcome it increases with the cube. This means doubling your speed requires roughly eight times more power just to maintain it.
Why Speed Hits Your Fuel Economy Harder Than You Think
Most drivers understand, in a vague way, that going faster burns more gas. What they don't fully grasp is how quickly that relationship escalates. This isn't a gradual, proportional trade-off — it's exponential. And the math works against you more the faster you go.
At the physics level, your engine has to do two main types of work at highway speeds: overcome rolling resistance (the friction between your tires and the road) and overcome aerodynamic drag (the resistance of pushing through air). At lower speeds, rolling resistance dominates. But once you get above 50–55 mph, aerodynamic drag takes over — and it grows with the square of your speed while the power needed to sustain it grows with the cube.
Here's what that means in plain terms: going from 55 mph to 65 mph is a roughly 18% increase in speed, but aerodynamic drag force increases by about 40%. The jump from 65 to 75 mph increases drag by another 33%. Each 10 mph step punishes you more than the previous one.
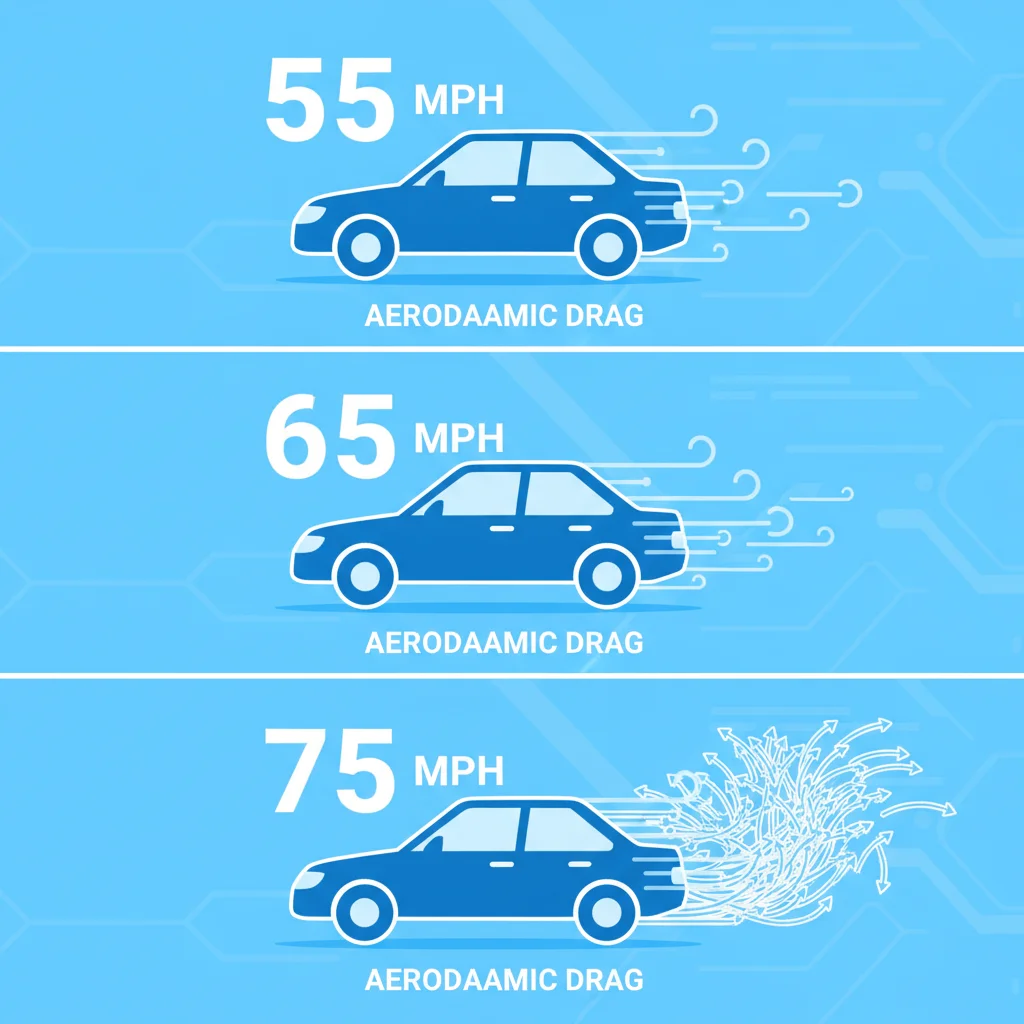
This is why the dynamics of highway vs. city fuel consumption differ so dramatically — highway driving at high speeds puts aerodynamic drag front and center in a way city stop-and-go traffic simply doesn't.
The Numbers: What Each 10 MPH Costs You
Let's anchor this to something real. According to the U.S. Department of Energy, fuel economy typically drops about 7–14% for every 5 mph driven above 50 mph. Using a mid-range estimate, here's how that stacks up for a vehicle rated at 32 mpg on the highway at 55 mph:
| Speed | Estimated MPG | Cost Per Gallon at $3.50 | Cost Per 100 Miles |
|---|---|---|---|
| 55 mph | 32 mpg | $3.50 | $10.94 |
| 65 mph | 28 mpg | $3.50 | $12.50 |
| 75 mph | 23 mpg | $3.50 | $15.22 |
| 80 mph | 20 mpg | $3.50 | $17.50 |
Look at the jump from 65 to 75 mph — that's nearly $2.72 extra per 100 miles driven. If you regularly cover 15,000 miles per year with roughly 40% on the highway (6,000 miles), switching from 75 mph to 65 mph saves you approximately $163 per year on that vehicle alone. Drive more highway miles? The savings scale up directly.
14%
MPG drop per 5 mph above 50 mph
The U.S. Department of Energy estimates fuel economy falls roughly 7–14% for every 5 mph over 50 mph, depending on the vehicle.
$350+
Annual cost of driving 75 vs. 65 mph
For a driver logging 12,000 highway miles annually, choosing 75 mph over 65 mph can cost over $350 per year in extra fuel at average gas prices.
3x
Power increase needed from 55 to 75 mph
Because aerodynamic power demand scales with the cube of velocity, maintaining 75 mph requires roughly three times the aerodynamic power of 55 mph.
25%
Range loss for EVs at 75 vs. 65 mph
Many EVs see real-world range drop by 20–30% when cruising at 75 mph compared to 65 mph, according to real-world efficiency testing data.
35 min
Time saved driving 80 vs. 65 mph on 200 miles
On a 200-mile trip, driving 80 mph instead of 65 mph saves approximately 35 minutes — often reduced further by traffic, tolls, or an extra fuel stop.
And that's assuming a single vehicle at current average gas prices. For families with two cars, or drivers logging more highway miles, the annual loss from high speeds compounds quickly.
“The relationship between speed and fuel consumption isn't linear — it's exponential. Most drivers dramatically underestimate how much their highway speed is costing them because the penalty isn't visible the way a price at the pump is.”
— Erin Bonner, Senior Fuel Efficiency Analyst, U.S. Department of Energy Vehicle Technologies Office
The Compounding Effect: It's Not Just About One Trip
The fuel cost per tank is jarring enough, but where high-speed driving really costs you is over thousands of miles. Let's frame it differently: if you drive 12,000 highway miles a year at an average of 75 mph instead of 65 mph, and your car normally gets 30 mpg at 65 mph (dropping to about 24 mpg at 75 mph), here's the math:
- At 65 mph: 12,000 ÷ 30 = 400 gallons
- At 75 mph: 12,000 ÷ 24 = 500 gallons
- Difference: 100 gallons per year
- At $3.50/gallon: $350 extra per year
That's $350 for choosing one lane over another — and making a habit of keeping the speedometer just a bit lower. Over five years of ownership, that's $1,750 in fuel you didn't have to spend.
Why Your Window Sticker MPG Doesn't Reflect This
EPA highway fuel economy ratings are typically tested at speeds between 48 and 80 mph with an average of around 48 mph — far below typical American highway speeds. This is why so many drivers find their real-world highway MPG falls well short of the sticker number. The faster you routinely drive, the larger that gap becomes.
Speed and EV Charging Costs
For EV drivers, driving faster doesn't just mean more range loss — it can change how often you need to stop and charge on long trips. More charging stops add time and, on some networks, higher per-kWh rates during peak hours. The speed penalty for EVs is felt in time and money simultaneously.
There's also a secondary cost hiding in those numbers: engine wear. Running your engine at sustained high outputs — which high-speed highway driving demands — accelerates wear on fuel injectors, the transmission, and other drivetrain components. It's harder to quantify, but it's real. This is one of the reasons aggressive driving habits hurt fuel economy most — they pile on costs in more than one category.
Aerodynamics Aren't Just About Speed — Shape Matters Too
Your vehicle's aerodynamic profile plays a huge role in how much these speed penalties hurt you. A sleek sedan with a low drag coefficient (Cd) around 0.24 will hold its efficiency much better at 75 mph than a boxy SUV or pickup truck with a Cd of 0.40 or higher.
This is why the same speed increase from 65 to 75 mph might cost a Prius driver 2–3 mpg while costing a full-size truck driver 5–6 mpg or more. The penalty scales with how hard your vehicle has to work to slice through air at that speed.
What compounds the problem is roof racks, cargo carriers, and open truck beds. If you've added external storage to your vehicle, those accessories dramatically increase drag at high speeds. An empty roof rack alone can cut highway MPG by up to 25% — and that hits hardest when you're already fighting aerodynamic drag at 75+ mph.
Similarly, heavier cargo in your vehicle adds rolling resistance that compounds with the drag penalty at high speeds. These factors don't operate in isolation — they stack.
Try a One-Trip Experiment
On your next long highway drive, set cruise control to 65 mph and note your fuel efficiency on the trip computer. Then compare it to a similar route you've driven at 75 mph. Many modern vehicles display real-time mpg, making the difference immediately visible. Seeing it in your own car is more convincing than any chart.
Remove Roof Racks Between Trips
If you only use a roof rack or cargo carrier occasionally, take it off between uses. At 65–70 mph, an empty roof rack can drop your MPG by 10–15%. At 75 mph, that penalty grows. The five minutes it takes to remove it pays for itself within a few miles of highway driving.
Use Trip Computers to Your Advantage
Most vehicles built after 2010 include a real-time fuel economy display. Use it as biofeedback while driving — watch what happens to your instantaneous MPG reading when you nudge past 70 mph. It makes the abstract concept of aerodynamic drag immediately concrete and gives you a reason to ease off the throttle.
The Time Savings Myth: Does Going Faster Actually Help?
The most common justification for driving 80 mph is time savings. It's worth confronting that rationale directly with real math, because the actual time benefit is smaller than almost everyone assumes.
On a 200-mile highway trip:
- At 65 mph: 3 hours, 5 minutes
- At 75 mph: 2 hours, 40 minutes
- At 80 mph: 2 hours, 30 minutes
The difference between 65 and 80 mph on a 200-mile trip is about 35 minutes. That sounds meaningful — but it assumes zero traffic, no speed limit changes, no construction zones, and no fuel stops. In practice, driving 80 mph on a long trip often means stopping for gas one more time than you would at 65 mph. A typical fuel stop costs 10–15 minutes. You've just cut your time savings roughly in half.
There's also a safety dimension worth acknowledging. Higher speeds reduce reaction time and stopping distance dramatically. The physics of what happens to your reaction window at 70 mph vs. 55 mph makes clear that the extra 10 mph narrows your margin for error far more than the speedometer suggests.
The time math rarely works out as favorably as it feels in the moment. The fuel math always works against you.
EVs Face the Same Problem — Often More Severely
If you're thinking about switching to an EV to escape fuel costs, it's worth knowing that the speed-efficiency trade-off doesn't disappear — it just shows up differently. Electric vehicles are especially sensitive to aerodynamic drag because they have no engine waste heat to compensate for, and every kilowatt-hour matters more when range anxiety is already a concern.
The same exponential drag physics apply. At 75 mph, many EVs see range drops of 20–30% compared to 65 mph. A vehicle rated for 280 miles of range might realistically deliver 200–220 miles on a sustained 75 mph highway run. That's not a marketing caveat — it's the same aerodynamic drag math in action.
Speed's impact on EV range is even more pronounced than for gasoline vehicles, because gasoline engines are already inefficient in ways that partially mask the relative drag penalty. EV efficiency is cleaner, so the drag hit is proportionally more visible. And for EV owners tracking charging costs, understanding speed's role is essential — see how charging costs compare to gas when you factor in real-world range at highway speeds.
Why Your Window Sticker MPG Doesn't Reflect This
EPA highway fuel economy ratings are typically tested at speeds between 48 and 80 mph with an average of around 48 mph — far below typical American highway speeds. This is why so many drivers find their real-world highway MPG falls well short of the sticker number. The faster you routinely drive, the larger that gap becomes.
Speed and EV Charging Costs
For EV drivers, driving faster doesn't just mean more range loss — it can change how often you need to stop and charge on long trips. More charging stops add time and, on some networks, higher per-kWh rates during peak hours. The speed penalty for EVs is felt in time and money simultaneously.
Practical Ways to Slow Down Without Feeling Like You're Crawling
Nobody wants to feel like the slowpoke holding up traffic. But there are practical ways to reduce your average speed without feeling frustrated or out of place on the highway.
Use Cruise Control Proactively
Set cruise control to 65–68 mph rather than matching the flow of traffic. Most highway traffic clusters around 70–75 mph, but the fuel savings from sitting at 65 mph are substantial, and on most roads you'll still reach your destination within minutes of drivers going 10 mph faster.
Drive in the Right Lane
Right-lane driving reduces the temptation to match faster traffic. You're less likely to unconsciously creep up to 80 mph when you're not surrounded by vehicles doing the same.
Think in Gallons Per Trip, Not MPH
Reframe the mental calculation before long drives. At 75 mph on a 400-mile trip with a 30-mpg car, you'll burn about 17 gallons. At 65 mph, about 13.5 gallons. That's 3.5 gallons — about $12 — saved on a single trip. Run one trip like that per week, and you've saved over $600 in a year.
Try a One-Trip Experiment
On your next long highway drive, set cruise control to 65 mph and note your fuel efficiency on the trip computer. Then compare it to a similar route you've driven at 75 mph. Many modern vehicles display real-time mpg, making the difference immediately visible. Seeing it in your own car is more convincing than any chart.
Remove Roof Racks Between Trips
If you only use a roof rack or cargo carrier occasionally, take it off between uses. At 65–70 mph, an empty roof rack can drop your MPG by 10–15%. At 75 mph, that penalty grows. The five minutes it takes to remove it pays for itself within a few miles of highway driving.
Use Trip Computers to Your Advantage
Most vehicles built after 2010 include a real-time fuel economy display. Use it as biofeedback while driving — watch what happens to your instantaneous MPG reading when you nudge past 70 mph. It makes the abstract concept of aerodynamic drag immediately concrete and gives you a reason to ease off the throttle.
Pair Speed Discipline With Other Habits
Speed is the biggest lever, but it's not the only one. Removing a roof rack when you're not using it, keeping tires properly inflated, and avoiding unnecessary cargo weight all contribute. Think of them as multipliers — they each help more at 65 mph than they would at 80 mph, because aerodynamic and rolling resistance penalties compound.
Taken together, these habits are the foundation of what it means to drive efficiently on the highway. Speed is where to start because the return is immediate and requires zero equipment.

All claims are backed by peer-reviewed research. Sources on request.