Key Takeaways
Vehicle Rating Factors
Vehicle rating factors are the specific characteristics of your car — such as its make, model, age, horsepower, safety features, and theft rate — that insurance companies use to calculate part of your premium. Insurers treat your vehicle as a risk profile unto itself, separate from your driving history or personal background. A higher-risk vehicle profile translates directly into a higher base rate before any personal factors are applied.
Insurers use actuarial loss data organized by ISO (Insurance Services Office) vehicle symbols — a proprietary rating system that groups vehicles by expected claim frequency and severity — to establish base rates for each vehicle class.
Your Car Is a Risk Profile Before It's a Vehicle
When you apply for auto insurance, you hand over two distinct sets of data: information about yourself — your age, driving record, credit history, and address — and information about your vehicle. Insurers run those inputs through separate but interacting scoring models. The vehicle side of that equation is often underestimated by consumers, yet it can swing your premium by hundreds of dollars annually.
The fundamental logic is straightforward. Every car model has a documented history of how often it's involved in accidents, how expensive those accidents are to resolve, how frequently it's stolen, and how well it protects its occupants. Insurers aggregate that claims data across millions of policies and arrive at a probability-weighted cost estimate for insuring each vehicle. That estimate forms the base rate before your personal characteristics are layered on top.
Understanding which vehicle attributes carry the most weight — and why — puts you in a stronger position when you're deciding between two models or trying to make sense of a quote that surprised you.

For a broader view of every data point that enters your quote, see the full breakdown of insurer rating variables. This article focuses specifically on what your vehicle itself communicates to an underwriter.
Make, Model, and Trim: More Specific Than You Might Expect
Insurers don't rate your vehicle at the brand level or even the model level — they rate at the trim level. A Honda Civic LX and a Honda Civic Si are not the same vehicle in an insurer's pricing model. The Si carries a turbocharged 1.5-liter engine, sportier suspension tuning, and a driver profile that statistically skews younger and more aggressive. Those differences register in the actuarial data as higher claim frequency, and the premium reflects that.
This matters practically. Two buyers walking out of the same dealership with different trim packages on the same model may see meaningfully different insurance quotes. The difference isn't arbitrary — it tracks the real-world cost of insuring vehicles with different performance characteristics, parts costs, and usage patterns.
~$900
Annual premium gap between cheapest and priciest vehicle segments
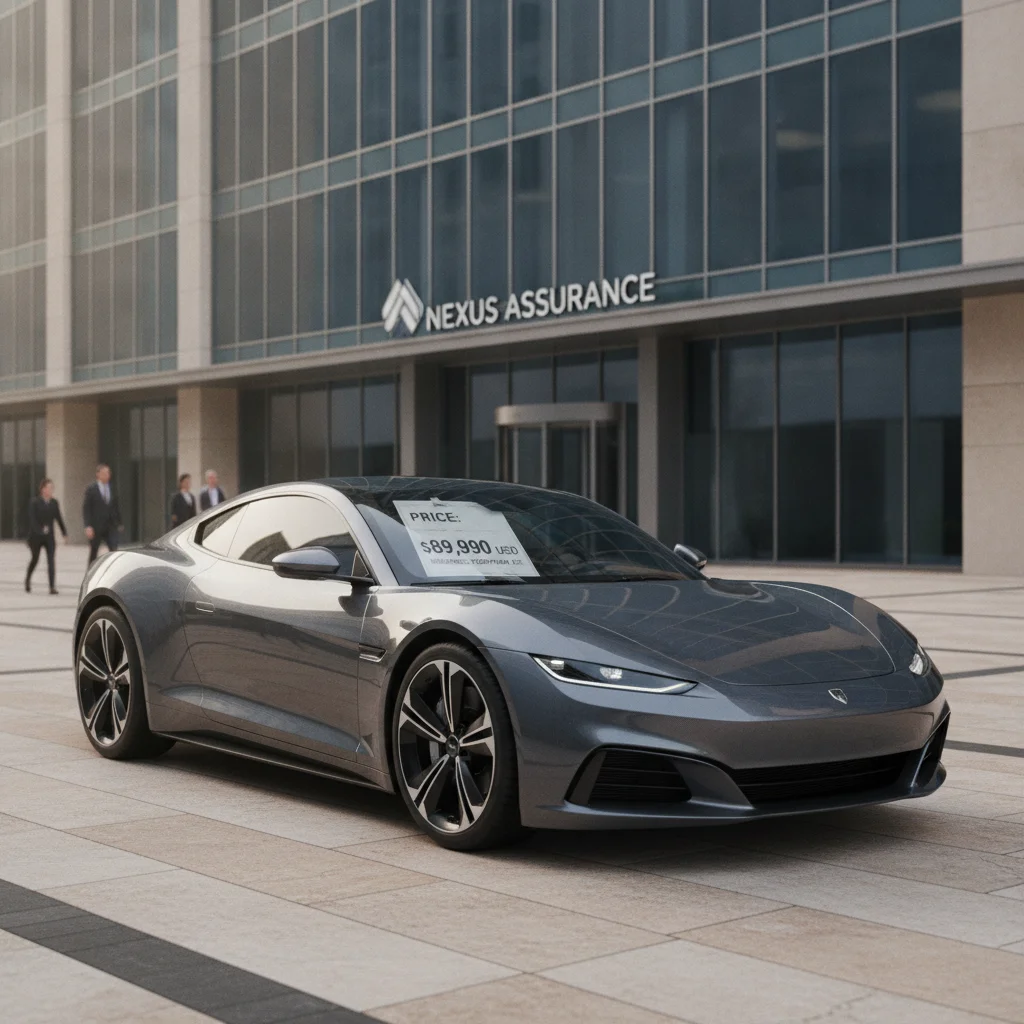
Insurance.com analysis of rate data by vehicle category found premiums for sports cars averaging roughly $900 more per year than equivalent midsize sedans, holding driver profile constant.
50%
Rear-end collision reduction linked to automatic emergency braking
The Insurance Institute for Highway Safety (IIHS) has documented approximately a 50% reduction in rear-end crashes for vehicles equipped with front AEB systems compared to those without.
Top 10
Full-size pickups dominating annual vehicle theft rankings
The National Insurance Crime Bureau (NICB) reports that Ford F-Series and Chevrolet Silverado trucks have occupied top theft positions for multiple consecutive years.
3–4x
Higher cost of ADAS-equipped windshield replacement
Industry repair data indicates that replacing a windshield with embedded cameras or sensors costs three to four times more than a standard windshield replacement on older vehicles.
30–40%
Premium difference between high- and low-risk vehicle profiles
Actuarial comparisons across similarly priced vehicles show that trim and performance differences alone can produce a 30–40% premium spread for drivers with identical personal rating characteristics.
Luxury and performance trims compound this effect. A standard BMW 3 Series already carries elevated repair costs relative to mainstream sedans; a fully loaded M340i with performance-tuned components pushes that further. High-end trims also tend to attract drivers who use those performance capabilities, creating a feedback loop in the claims data that insurers price accordingly.
When comparing insurance costs across models, always input the specific trim you're considering — not just the model name. A quote built on a base trim will underestimate what you'll actually pay if you buy the top-of-the-line version.
Get Insurance Quotes Before You Buy
Request insurance quotes for each vehicle you're seriously considering before you visit a dealership or sign anything. Provide the exact year, make, model, and trim level to each insurer for an accurate comparison. The premium differences between similar vehicles can be dramatic — and they're not always intuitive. This takes about 20 minutes and can save you hundreds of dollars per year.
Ask Your Agent About Vehicle-Specific Discounts
Many insurers offer discounts tied to specific safety features — anti-lock brakes, automatic emergency braking, anti-theft immobilizers, and daytime running lights are common examples. Before purchasing, ask your carrier which features on your target vehicle qualify for discounts, and factor those into your comparison. Some discounts are applied automatically; others require a manual request.
Repair Costs: The Hidden Premium Driver
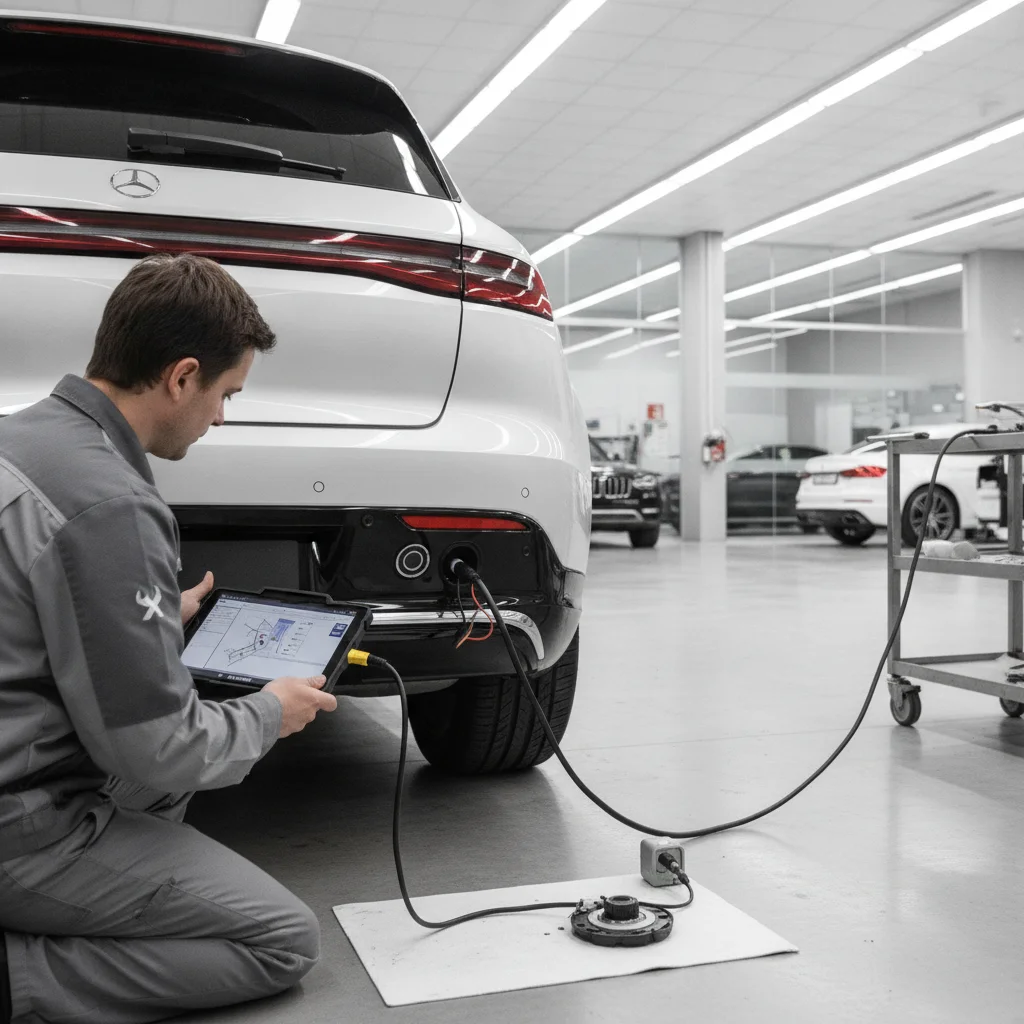
Vehicle repair costs have become one of the most consequential rating factors in recent years, driven by a broad shift in automotive technology. Modern vehicles are no longer primarily mechanical — they're electronic systems on wheels. Cameras, radar sensors, lidar arrays, infotainment hardware, and advanced driver-assistance system (ADAS) components are embedded throughout the body. When a bumper takes a low-speed hit, the repair may require recalibrating sensors that cost hundreds of dollars per unit.
This dynamic hits luxury and technology-forward vehicles hardest. A Tesla Model 3, for example, uses a large-format aluminum rear structural panel that requires specialized equipment to repair or replace — equipment most body shops don't carry. Repair shop scarcity and parts cost combine to drive severity metrics upward, which flows directly into higher collision and comprehensive premiums.
Even within more mainstream segments, parts availability matters. Vehicles with proprietary components, limited aftermarket supply chains, or significant labor time per repair job carry higher expected claim costs. Insurers track average repair cost per claim by vehicle symbol and bake that into their rates.
Consumers shopping between two similar-priced vehicles — say, a Korean brand SUV and a German luxury crossover — may find that the actual ownership cost diverges sharply when insurance is factored in, even if the sticker prices are comparable. This is why insurance cost should be part of the total cost of ownership calculation before you sign, not after. For context on how EVs specifically amplify this repair-cost dynamic, see how electric vehicles are priced differently by insurers.
EV Repair Costs Are a Growing Insurer Concern
Electric vehicles introduce a distinct repair-cost challenge: battery pack damage in even moderate collisions can result in total-loss declarations because replacement costs exceed vehicle value. Insurers are still developing their actuarial models for EVs, and rates across carriers vary significantly for the same EV model. See <a href="/car-insurance/rates-and-savings/rate-factors/electric-vehicles-and-auto-insurance-rates-whats-different-under-the-hood">how insurers price EVs differently</a> and the broader <a href="/electric-vehicles/ev-ownership-costs/ev-insurance-guide">EV insurance guide</a> for details.
When Dropping Physical Damage Coverage Makes Sense
A common rule of thumb is to consider dropping collision and comprehensive coverage when the annual combined premium for those coverages exceeds 10% of the vehicle's current market value. But this calculation should also account for your ability to absorb an out-of-pocket loss — if replacing your car would create financial hardship, maintaining coverage may be worth the cost even on an older vehicle.
Horsepower, Performance, and the Speed-Claims Connection
Engine output is a reliable proxy for driving behavior risk. Insurers know — from decades of claims data — that higher-horsepower vehicles are involved in more severe accidents. Part of that is physics: faster vehicles have more kinetic energy in collisions. Part of it is driver selection: people who buy 500-horsepower sports cars tend to use that power more often than the average commuter.
This doesn't mean every sports car buyer is reckless. But from an actuarial standpoint, the pattern holds at the population level, and insurers price populations, not individuals. A 35-year-old with a clean driving record who buys a Dodge Challenger Hellcat will still pay more than a comparable driver with a Toyota Camry — because the vehicle's risk profile enters the equation before the driver's personal record does.
“The vehicle is the single most controllable variable in the insurance equation before a policy is written. Consumers who shop cars without first checking insurance costs are leaving a significant financial lever on the table.”
— Robert Passmore, Former Vice President of Personal Lines Policy, American Property Casualty Insurance Association (APCIA)
Performance SUVs and muscle sedans occupy an interesting middle ground. An Audi RS6 Avant is a family wagon capable of 0–60 in under 3.5 seconds. Insurers don't categorize it as a minivan just because it has roof rails. High-output variants of otherwise mainstream models carry elevated ratings that reflect their actual performance characteristics.
If you're weighing insurance cost as part of a vehicle decision and you're drawn to performance variants, the premium gap over a standard trim can be significant enough to affect the total ownership calculation — particularly over a multi-year loan or lease.
Theft Rates and What They Do to Comprehensive Coverage
Comprehensive insurance covers damage that isn't caused by collisions — weather, vandalism, fire, and theft. Your vehicle's theft rate is one of the primary inputs into your comprehensive premium, and the spread between low-theft and high-theft models is substantial.
The National Insurance Crime Bureau (NICB) publishes annual data on the most-stolen vehicles in the United States. For years, certain full-size pickup trucks have dominated the list — particularly the Ford F-Series and Chevrolet Silverado — not because they're luxury targets, but because older model years lack modern immobilizers and their parts are in high demand. If you're driving a late-1990s or early-2000s pickup, your comprehensive rate reflects that theft history even if you've never personally had a claim.
Catalytic converter theft has added a newer dimension to this calculation. Toyota Priuses, Honda Elements, and certain truck models have been disproportionately targeted because their converters contain higher concentrations of precious metals and are more accessible from underneath. Some insurers have begun adjusting rates for specific model years in high-converter-theft geographies.
The interaction between your vehicle's theft profile and your location creates a layered risk calculation. A pickup truck in a dense urban environment with documented high theft rates pays more than the same truck in a rural county with low crime data. Your ZIP code and your vehicle's theft history price each other — see how your address shapes your premium for more on the geographic dimension.
Safety Ratings and Technology Features
The relationship between a vehicle's safety features and its insurance cost is more nuanced than many consumers expect. Strong crash-test scores from NHTSA and IIHS generally correlate with lower injury claim costs, which can suppress the medical payments and liability portions of your premium. Vehicles that earn IIHS Top Safety Pick+ status tend to appear more favorably in actuarial loss data over time.
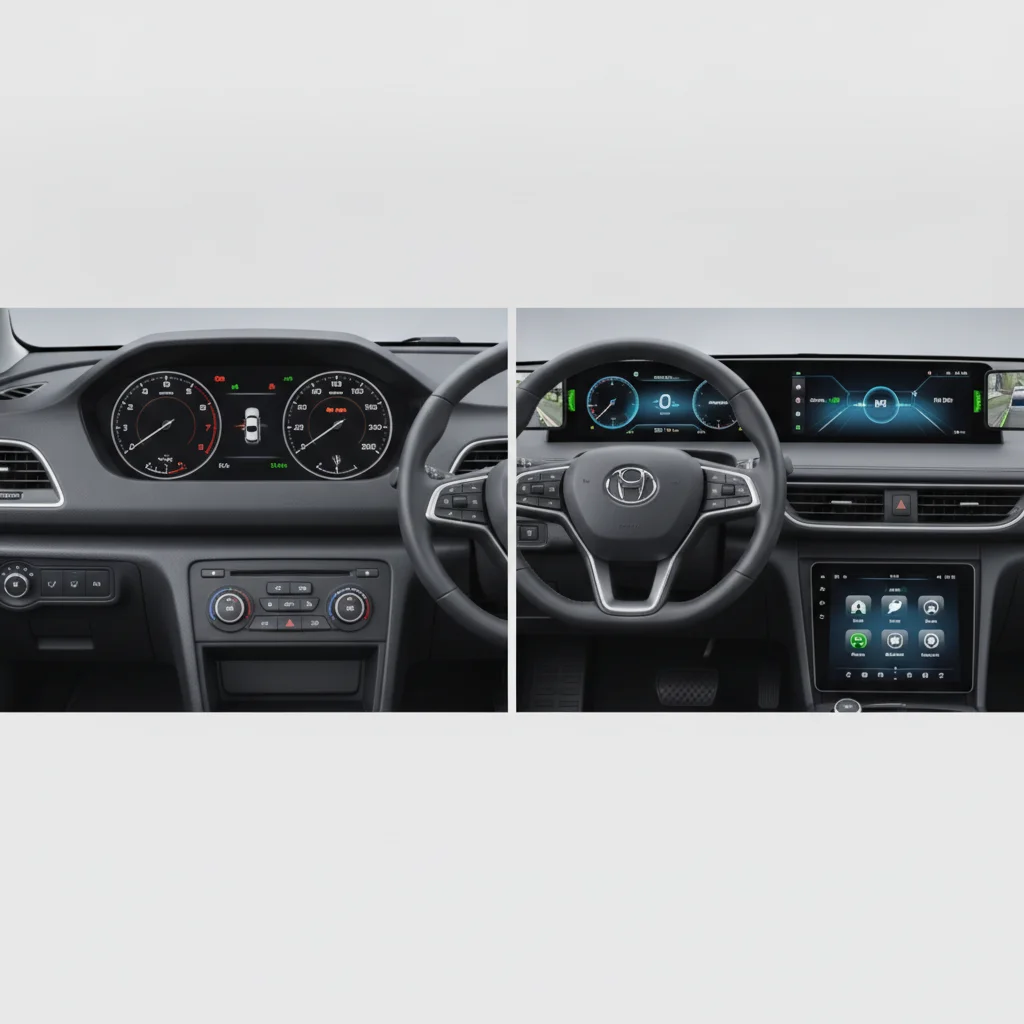
Active safety systems add another layer. Automatic emergency braking (AEB), lane-keeping assist, blind-spot monitoring, and forward collision warning have all been shown to reduce accident frequency in real-world data. The IIHS has documented that AEB reduces rear-end collisions by roughly 50% in some study populations. Insurers have begun incorporating this into their models, and some offer specific discounts for vehicles equipped with qualifying ADAS features.
The tradeoff — and this brings us back to repair costs — is that these same safety systems are expensive to repair when they're damaged. A windshield replacement on a vehicle with an embedded camera and heads-up display can cost three to four times what a conventional windshield costs. That drives comprehensive and collision severity upward even as it helps reduce frequency. The net effect on your premium depends on how your insurer models the balance between those two forces.
When researching vehicles, cross-reference IIHS ratings with insurance quotes from multiple carriers. Two insurers may weight the frequency-versus-severity tradeoff differently, producing meaningfully different rates for the same safety-forward vehicle.
Vehicle Age, Depreciation, and Coverage Decisions
Older vehicles are generally cheaper to insure in absolute terms — largely because their actual cash value (ACV) has depreciated. When a 12-year-old sedan is totaled, the insurer's maximum payout is limited to what that car was worth before the accident. A lower ACV means a lower loss exposure, which tends to mean lower comprehensive and collision premiums.
But there's a practical decision embedded in vehicle age: at some point, the cost of carrying collision and comprehensive coverage may exceed the maximum possible payout minus your deductible. If your car is worth $3,500 and you're paying $800 per year for collision coverage with a $1,000 deductible, your maximum net recovery is $2,500 — and you'll pay that $800 whether you claim or not. Many financial advisors and insurance professionals suggest evaluating whether to drop physical damage coverage on vehicles valued below a certain threshold, though the right number depends on your financial cushion and risk tolerance.
Vehicle valuation tools can help you track where your car stands. Resources like KBB and Edmunds provide current market value estimates — see how valuation tools work and what they measure for a deeper look. Pairing that data with your current coverage costs gives you a clearer picture of whether your policy structure still makes financial sense as the car ages.
EV Repair Costs Are a Growing Insurer Concern
Electric vehicles introduce a distinct repair-cost challenge: battery pack damage in even moderate collisions can result in total-loss declarations because replacement costs exceed vehicle value. Insurers are still developing their actuarial models for EVs, and rates across carriers vary significantly for the same EV model. See <a href="/car-insurance/rates-and-savings/rate-factors/electric-vehicles-and-auto-insurance-rates-whats-different-under-the-hood">how insurers price EVs differently</a> and the broader <a href="/electric-vehicles/ev-ownership-costs/ev-insurance-guide">EV insurance guide</a> for details.
When Dropping Physical Damage Coverage Makes Sense
A common rule of thumb is to consider dropping collision and comprehensive coverage when the annual combined premium for those coverages exceeds 10% of the vehicle's current market value. But this calculation should also account for your ability to absorb an out-of-pocket loss — if replacing your car would create financial hardship, maintaining coverage may be worth the cost even on an older vehicle.
The age-and-value calculation also intersects with your loan or lease. If you're financing a vehicle, your lender will typically require you to carry comprehensive and collision coverage regardless of the car's depreciated value. Gap insurance becomes relevant in the early years of a loan when the outstanding balance may exceed the car's ACV — a situation where the depreciation curve and the loan amortization schedule create a coverage gap. For more on how vehicle characteristics interact with financing, see every factor that shapes your auto loan rate.
Putting It Together: Using Vehicle Choice as a Premium Lever
Most consumers treat insurance as something that happens to them after they've already chosen a car. A more strategic approach treats insurance cost as part of the selection criteria — along with fuel economy, reliability ratings, and total cost of ownership.
Before finalizing a vehicle purchase, request insurance quotes using the specific year, make, model, and trim of each vehicle you're seriously considering. The differences can be stark. A compact SUV known for low repair costs, modest horsepower, and strong theft deterrents might quote 30–40% below a sport-tuned crossover at a similar price point. Over a four-year ownership period, that gap represents real money.
Get Insurance Quotes Before You Buy
Request insurance quotes for each vehicle you're seriously considering before you visit a dealership or sign anything. Provide the exact year, make, model, and trim level to each insurer for an accurate comparison. The premium differences between similar vehicles can be dramatic — and they're not always intuitive. This takes about 20 minutes and can save you hundreds of dollars per year.
Ask Your Agent About Vehicle-Specific Discounts
Many insurers offer discounts tied to specific safety features — anti-lock brakes, automatic emergency braking, anti-theft immobilizers, and daytime running lights are common examples. Before purchasing, ask your carrier which features on your target vehicle qualify for discounts, and factor those into your comparison. Some discounts are applied automatically; others require a manual request.
If you're currently over-insured on an aging vehicle, or under-insured on a new one with advanced safety tech, reviewing your vehicle's current rating profile with your insurer can surface adjustments worth making. Ask your carrier directly which vehicle characteristics are affecting your rate — many will walk you through the vehicle symbol and explain the major rating factors applied to your specific car.
Other personal factors interact with vehicle rating to produce your final quote. Your driving history, the number of miles you put on annually, where you garage the car, and your credit-based insurance score all play roles alongside vehicle data. See why two drivers with clean records can pay vastly different premiums for a closer look at how those personal variables intersect with vehicle factors. And if you want to understand how age-related rating works alongside vehicle selection, how your age bracket changes what you pay is worth reading before your next purchase decision.
The vehicle you drive isn't the only lever in your insurance rate, but it's one of the few you can control before you ever get behind the wheel.

All claims are backed by peer-reviewed research. Sources on request.