
Key Takeaways
Actuarial Risk Rating for Performance Cars
When an insurer prices a high-performance or sports car policy, it relies on actuarial data — historical loss statistics — to estimate how likely that specific vehicle is to generate a costly claim. Performance cars typically score higher on three measurable risk dimensions: frequency of accidents, severity of damage when accidents occur, and the cost to repair or replace specialized components. The combined effect is a premium that can run significantly higher than for a comparable family sedan.
Insurers assign each vehicle a 'symbol' or 'ISO rating code' based on its make, model, trim, and model year. That code maps to historical claims data and feeds directly into the base rate calculation before any driver-specific factors are applied.
How Insurers See a Sports Car Before They See You
Before a single fact about you as a driver enters the equation, every vehicle sold in the United States is assigned a rating classification by insurers — a code that summarizes that vehicle's historical claims performance. This classification, often based on industry-standard ISO vehicle symbols or a carrier's proprietary equivalent, reflects years of aggregated loss data: how often that model is involved in accidents, how much those accidents cost to settle, and how frequently it is stolen.
High-performance cars — defined broadly as vehicles with turbocharged or supercharged engines, rear-wheel or all-wheel drive performance tuning, and manufacturer top speeds above 130 mph — consistently appear in the upper tiers of these classifications. That's not a penalty for being fast. It's a statistical reflection of how those vehicles behave across millions of insured miles. As the vehicle profile influences your insurance quote article explains, the car itself is one of the single largest levers in your premium calculation.
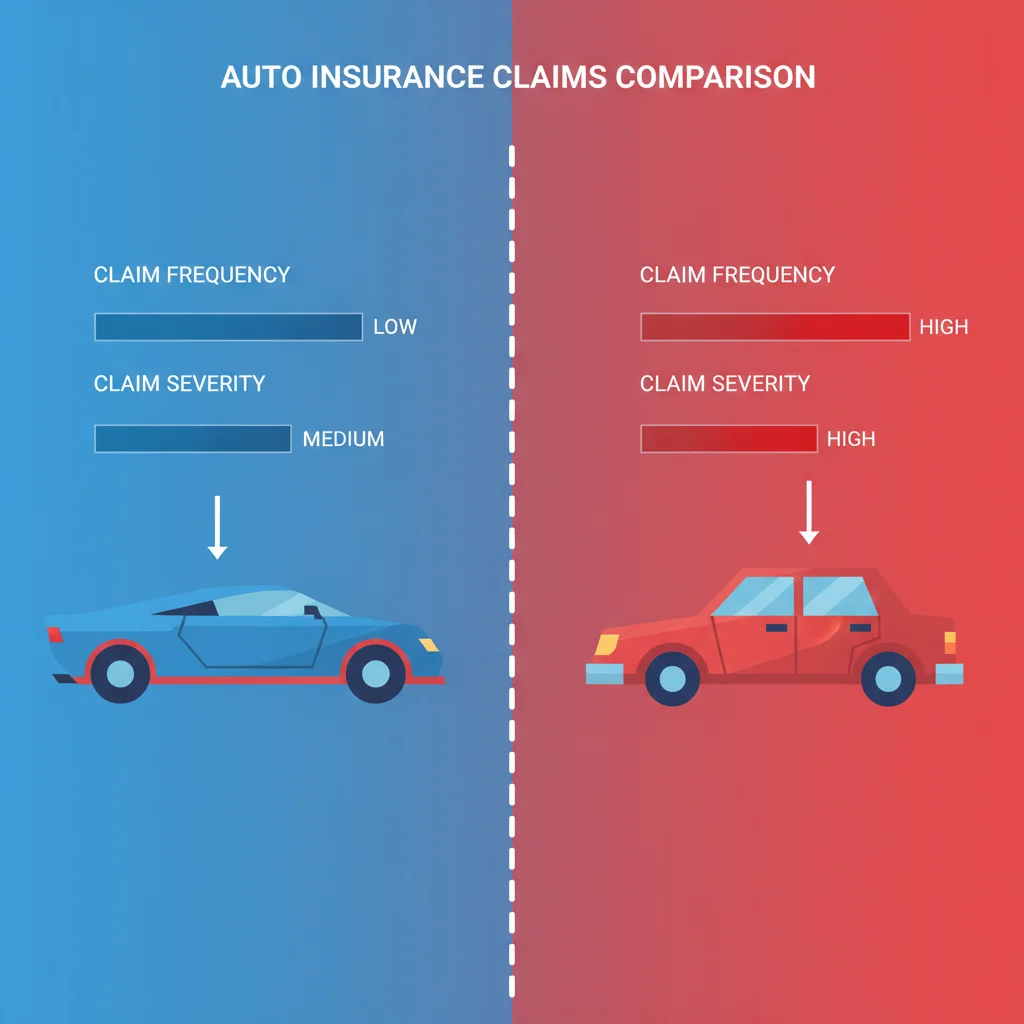
The classification system separates loss exposure into two distinct components that actuaries track separately: loss frequency (how often a claim is filed per insured vehicle-year) and loss severity (the average dollar cost when a claim is filed). High-performance vehicles tend to score poorly on both measures simultaneously — which is why their premiums don't just inch upward, they can jump by 40 to 100 percent relative to a mainstream sedan.
Vehicle Symbols Are Not Publicly Disclosed
Most insurers do not publish the specific rating symbols or codes assigned to individual vehicles, making it difficult for consumers to directly compare vehicle classifications. However, the practical effect is visible: request quotes on several trim levels of the same model and you will see the base rate change as engine output and performance specification rise. The HLDI does publish comparative loss data by make and model on its public website, which gives a useful proxy for understanding how different vehicles are rated.
Track Driving Almost Always Voids Standard Coverage
Standard personal auto policies contain exclusions for competitive or closed-course driving. Even a casual track day at a driving school or manufacturer-sponsored event may qualify as excluded activity under the policy language. Before taking a performance car to any closed-course event, verify your coverage in writing or obtain a separate track-day policy. Claims arising from undisclosed track use are routinely denied.
EVs and Performance Cars Have Overlapping Risk Profiles
High-performance electric vehicles — including performance trims of mainstream EV platforms — share several risk characteristics with traditional performance cars: elevated repair costs, specialized labor requirements, and in some cases higher theft rates. The <a href="/car-insurance/rates-and-savings/rate-factors/electric-vehicles-and-auto-insurance-rates-whats-different-under-the-hood">EV insurance rate differences</a> follow their own actuarial logic but intersect with performance vehicle pricing in important ways for buyers considering high-output electric models.
The Four Variables Driving Performance Car Premiums
Actuaries don't guess. They work from large, statistically credible datasets to isolate the variables that best predict future losses. For high-performance vehicles, four variables consistently rise to the top of the analysis.
1. Engine Output and Its Behavioral Correlates
Raw horsepower doesn't appear as a line item in most insurer rating engines. But the loss data generated by high-horsepower vehicles creates an indirect but powerful signal. Cars producing 400 or more horsepower are disproportionately represented in high-speed collision claims and in accidents involving loss of vehicle control. The actuarial term for this is adverse selection within the vehicle class: vehicles that attract drivers willing to use that performance capability generate worse loss ratios than the vehicle alone would predict.
2. Repair Cost and Parts Availability
A front-end collision that costs $4,200 to repair on a Honda Accord can cost $11,000 or more on a Porsche 911 or a Chevrolet Corvette Z06. Carbon fiber structural components, titanium exhaust systems, adaptive magnetic suspension units, and performance-spec brake assemblies are expensive to source and require technicians with specialized certifications. Labor hours multiply quickly. This is the severity side of the actuarial equation, and it weighs heavily. The physical damage coverage considerations for high-value vehicles deserve separate attention because standard policy limits often prove inadequate.
40–70%
Higher collision claim severity for sports cars vs. average vehicles
Highway Loss Data Institute analysis of collision claim severity by vehicle class, multiple model years.
15–30%
Higher injury claim frequency for sports car models
IIHS/HLDI injury claim frequency data comparing sports and performance cars to the overall passenger vehicle fleet.
$11,000+
Average front-end repair cost on a high-performance sports car
Illustrative industry repair data comparing mainstream sedan and performance vehicle body shop estimates for comparable collision damage.
25%
Potential premium reduction for low-mileage performance car use
Carrier-reported low-mileage discount ranges for secondary vehicles driven fewer than 7,500 miles annually.
$1,000+
Typical spread between highest and lowest quote for same driver and performance vehicle
Based on multi-carrier quote comparisons reported by insurance shopping platforms for high-performance vehicle profiles.
3. Theft Exposure
Certain performance models consistently rank among the most stolen vehicles in the country — not only for their resale value, but because their parts command strong prices in secondary markets. The National Insurance Crime Bureau's annual Hot Wheels report regularly includes high-performance variants of popular platforms. A vehicle with elevated theft frequency pushes up the comprehensive coverage component of your premium even if your collision risk is otherwise modest.
4. Total Loss Probability
When a high-performance vehicle is involved in a significant accident, the probability that repair costs exceed the vehicle's actual cash value — triggering a total loss declaration — is meaningfully higher than for a mainstream vehicle. High replacement costs and rapid depreciation on exotic components create scenarios where a car is economically totaled even when it looks drivable. Actuaries price total-loss probability as a separate risk layer within the comprehensive and collision components of the premium.
Use Agreed-Value Policies for Collector-Grade Performance Cars
If your performance car has appreciated in value or is a limited-production model, an agreed-value policy from a specialty carrier is almost always worth the slight premium increase. Standard ACV settlements at total-loss time can leave you significantly short of the actual market replacement cost, particularly in today's strong collector car market.
Shop at Least Four to Five Carriers
Rating algorithms for performance vehicles vary more between insurers than for standard cars. The spread between the cheapest and most expensive quote for the same driver and vehicle can easily exceed $1,000 annually. Investing an hour in comparison shopping — including at least one specialty carrier — is one of the highest-return activities a performance car owner can undertake.
The Driver Factor: How Your Profile Interacts With the Vehicle Rating
Vehicle classification sets the floor, but driver-specific variables determine where your actual premium lands within the range that floor defines. Think of it as a multiplication problem: the vehicle's base rate is multiplied by a series of driver-specific factors, each representing a measurable risk dimension.
Age is among the most powerful of these multipliers. A 19-year-old purchasing liability and comprehensive coverage on a 500-horsepower muscle car faces a compounding of two high-risk categories — young drivers and high-performance vehicles — that can produce premiums that are frankly prohibitive. This is not arbitrary: both variables independently predict elevated loss frequency, and their interaction is demonstrably worse than either alone.
Driving record works in the opposite direction. A 48-year-old with no at-fault accidents and no moving violations in the past five years carries a favorable multiplier that partially offsets the elevated vehicle base rate. The offset is real but not unlimited — a vehicle rated in the highest risk classification will still cost considerably more to insure than a standard sedan even for the safest driver in the pool.

Annual mileage also matters. A performance car driven 4,000 miles per year on weekends carries a materially different exposure profile than the same car commuted daily at 18,000 miles annually. Many insurers offer low-mileage discounts, and specialty carriers often build mileage-capped policies specifically for performance vehicles used as secondary cars. This is an underutilized lever for owners who drive their performance cars sparingly.
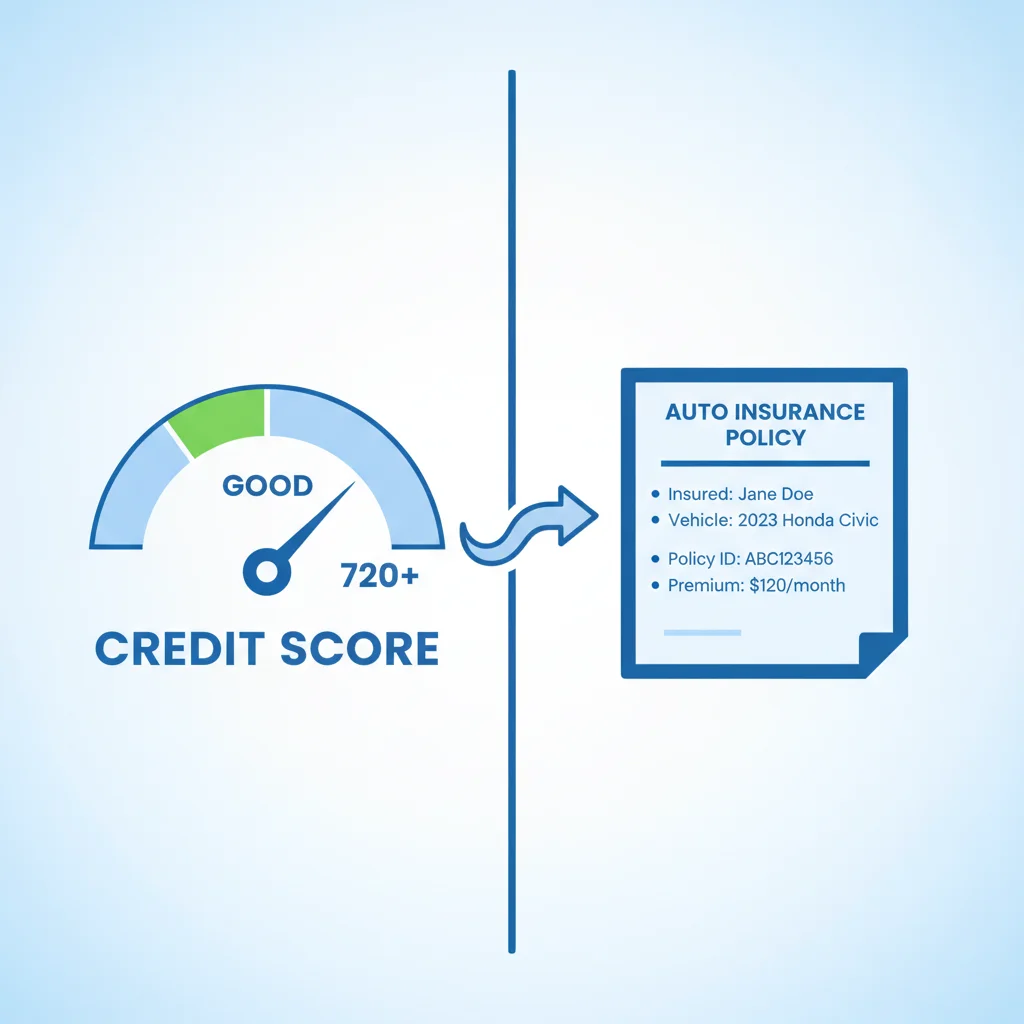
It's worth noting that driver-based factors like credit score also feed into most states' rating models. The relationship between credit score and car insurance premiums follows a similar actuarial logic: historical correlations with loss frequency, not a moral judgment on the individual driver.
What the Data Actually Says About Performance Car Claims
The Insurance Institute for Highway Safety (IIHS) and the Highway Loss Data Institute (HLDI) publish annual data on injury, collision, and property damage claims by vehicle make, model, and model year. That data consistently shows a pattern that aligns with actuarial pricing: high-performance variants of a given platform generate worse claims results than their standard-trim siblings.
Consider a concrete illustration: the HLDI's injury claim frequency data has repeatedly shown that sports car models — even those with advanced driver assistance systems — generate claim rates 15 to 30 percent higher than the average across all passenger vehicles. Collision claim severity for the same class routinely runs 40 to 70 percent above average. These are not edge-case findings; they are durable patterns across multiple model years and different manufacturers.
“The data doesn't lie — sports cars and high-horsepower vehicles have consistently worse loss results than the broader fleet, and that shows up in the claims numbers year after year. Drivers are often surprised, but the actuaries aren't.”
— Matt Moore, Vice President, Highway Loss Data Institute
The theft data reinforces the picture. Certain high-performance nameplates — including specific Dodge Challenger and Charger variants, Ford Mustangs in V8 trim, and various Chevrolet Camaro configurations — have appeared near the top of NICB theft rankings in multiple recent years. Theft rates feed directly into the comprehensive component of the premium calculation.
Gender interacts with this data in ways that some states allow insurers to price and others prohibit. The actuarial reasoning behind gender as a rating factor follows a similar logic to vehicle classification: historical loss correlations, applied at the population level, translated into individual premiums. The policy debate around that practice continues in state legislatures.
Strategies That Can Reduce What You Actually Pay
Understanding the actuarial logic behind performance car pricing opens the door to targeted strategies. Blanket cost-cutting approaches — choosing the lowest deductible, for example — often don't work the way owners expect. The common rate-factor myths that cost drivers money article covers several of these misconceptions in detail.
The strategies that actually move the needle for performance car owners fall into a few distinct categories:
- Shop specialty carriers. Standard personal auto insurers built their rating models around mainstream vehicles. Specialty insurers — including agreed-value carriers for collector and limited-use vehicles — have rating algorithms calibrated to performance cars and often deliver more competitive pricing for owners who fit their target profile.
- Optimize mileage reporting. If your performance car is a secondary vehicle driven fewer than 7,500 miles per year, make sure your insurer knows. Low-mileage designations can reduce premiums by 10 to 25 percent depending on the carrier.
- Consider higher deductibles strategically. On collision coverage for a high-value vehicle, raising your deductible from $500 to $1,000 or $2,500 shifts more small-claim exposure to you, reducing the premium on the component that performance cars inflate most.
- Maintain a clean driving record rigorously. A single at-fault accident or major moving violation on a performance car policy can produce a renewal premium increase that makes the car financially painful to own. The stakes are higher when the vehicle base rate is already elevated.
- Disclose modifications honestly. Aftermarket performance upgrades should be declared to your insurer. Undisclosed modifications that contributed to an accident can give a carrier grounds to reduce or deny a claim. Many specialty carriers handle declared modifications without penalty.
Use Agreed-Value Policies for Collector-Grade Performance Cars
If your performance car has appreciated in value or is a limited-production model, an agreed-value policy from a specialty carrier is almost always worth the slight premium increase. Standard ACV settlements at total-loss time can leave you significantly short of the actual market replacement cost, particularly in today's strong collector car market.
Shop at Least Four to Five Carriers
Rating algorithms for performance vehicles vary more between insurers than for standard cars. The spread between the cheapest and most expensive quote for the same driver and vehicle can easily exceed $1,000 annually. Investing an hour in comparison shopping — including at least one specialty carrier — is one of the highest-return activities a performance car owner can undertake.
When comparing auto insurance policies for a performance vehicle, request quotes from at least four to five carriers — the spread between the highest and lowest quote for the same vehicle and driver profile can be dramatic, often exceeding $1,000 annually on a high-performance car.

Coverage Structure: Standard Policies and Where They Fall Short
A standard personal auto policy is designed around replacement cost assumptions calibrated to mainstream vehicles. When that policy is applied to a high-performance car, several structural gaps can emerge that owners discover only at claim time.
The most common gap involves actual cash value (ACV) settlements on total loss claims. Standard policies pay ACV — the market value of the vehicle at the time of loss, accounting for depreciation. For a limited-production sports car or a collector-grade performance vehicle, the ACV calculation may significantly undervalue what the owner would actually need to replace the car. Agreed-value policies, available through specialty carriers, lock in a settled value at policy inception and pay that full amount in the event of a total loss — no depreciation deductions, no negotiations.
OEM parts provisions are another point of divergence. Standard policies typically give the insurer latitude to use aftermarket or salvage parts in repairs. For a performance vehicle where component authenticity affects both performance and resale value, that latitude can result in a repair that technically fixes the car but materially degrades its value. OEM-parts endorsements and specialty carrier policies that specify original equipment repair standards are worth the additional premium for high-value performance vehicles.
Track day coverage is a coverage gap that standard policies make no accommodation for whatsoever. If you drive your performance car on a closed-course track day — even once per year — your standard policy almost certainly excludes any claims arising from that activity. A handful of specialty insurers offer track-day endorsements or separate track-day policies that provide coverage for closed-course driving. This is not an edge case for serious performance car owners; it's an important coverage decision.
For a deeper look at how physical damage coverage works differently at the top end of the market, the guide to physical damage coverage for high-value cars covers the full landscape of specialty coverage options.
Vehicle Symbols Are Not Publicly Disclosed
Most insurers do not publish the specific rating symbols or codes assigned to individual vehicles, making it difficult for consumers to directly compare vehicle classifications. However, the practical effect is visible: request quotes on several trim levels of the same model and you will see the base rate change as engine output and performance specification rise. The HLDI does publish comparative loss data by make and model on its public website, which gives a useful proxy for understanding how different vehicles are rated.
Track Driving Almost Always Voids Standard Coverage
Standard personal auto policies contain exclusions for competitive or closed-course driving. Even a casual track day at a driving school or manufacturer-sponsored event may qualify as excluded activity under the policy language. Before taking a performance car to any closed-course event, verify your coverage in writing or obtain a separate track-day policy. Claims arising from undisclosed track use are routinely denied.
EVs and Performance Cars Have Overlapping Risk Profiles
High-performance electric vehicles — including performance trims of mainstream EV platforms — share several risk characteristics with traditional performance cars: elevated repair costs, specialized labor requirements, and in some cases higher theft rates. The <a href="/car-insurance/rates-and-savings/rate-factors/electric-vehicles-and-auto-insurance-rates-whats-different-under-the-hood">EV insurance rate differences</a> follow their own actuarial logic but intersect with performance vehicle pricing in important ways for buyers considering high-output electric models.

All claims are backed by peer-reviewed research. Sources on request.