Key Takeaways
Reaction Time at Speed
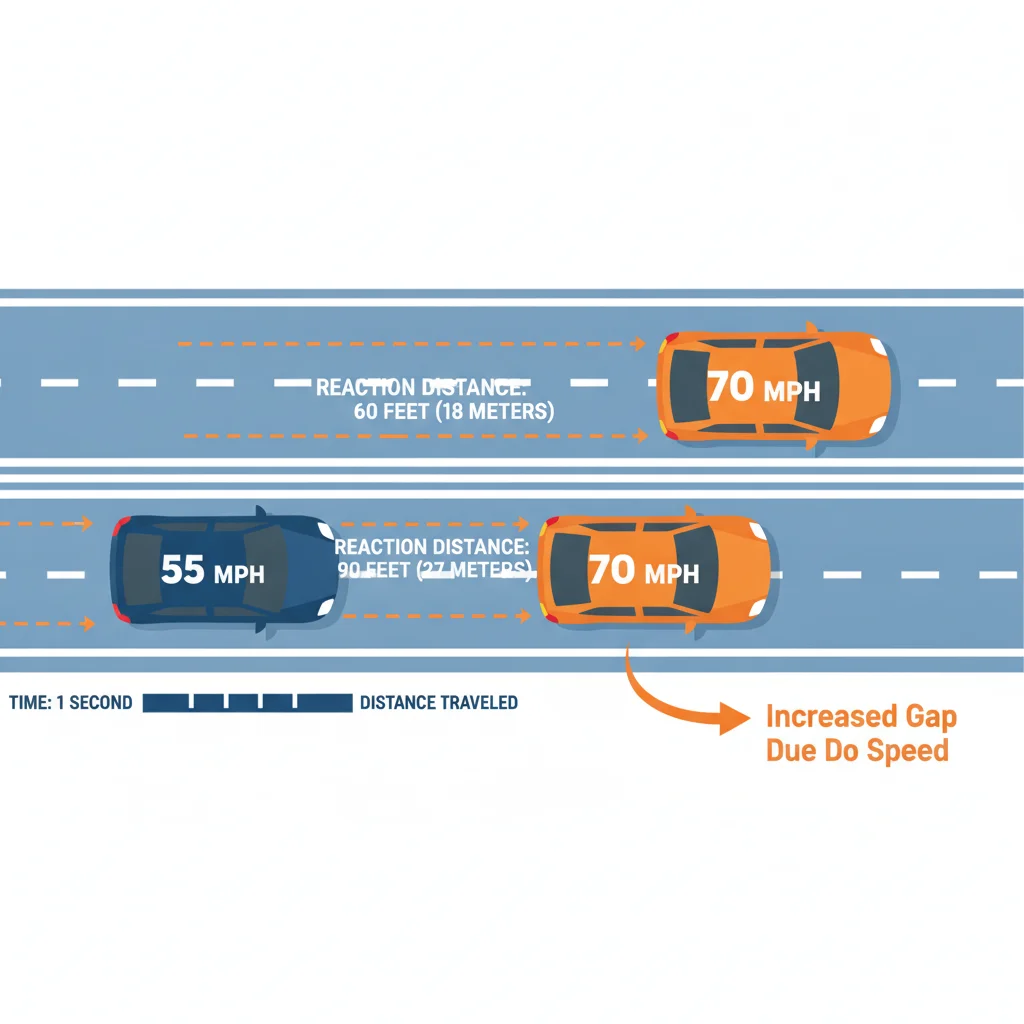
Reaction time is the interval between when a driver perceives a hazard and when they physically begin to respond — lifting off the gas or pressing the brake. At higher speeds, that same time interval translates into dramatically more distance traveled before any braking occurs. The gap between 55 mph and 70 mph isn't just 15 miles per hour; it's the difference between stopping before a hazard and colliding with it.
Traffic safety engineers separate 'perception-reaction time' (PRT), typically estimated at 1.5 seconds for alert drivers under AASHTO standards, from 'brake application time.' At 70 mph, 1.5 seconds of PRT alone consumes approximately 154 feet before the brake pedal is even depressed.
The Physics of a Split Second
Most drivers think of speed limits as a legal formality — a number posted on a sign that determines whether a state trooper will pull them over. What speed actually represents, however, is something more fundamental: the rate at which the world moves past your windshield and the rate at which your options narrow.
At 55 mph, you're covering 80.7 feet every second. At 70 mph, that figure rises to 102.7 feet per second — a 27% increase. That difference might feel abstract on an open highway, but it becomes concrete the moment a deer steps onto the road, a semi-truck blows a tire, or traffic stops suddenly ahead of you.
The physics here are unambiguous. Kinetic energy — the energy your vehicle carries and must dissipate in a stop or collision — scales with the square of velocity. Double your speed and you quadruple the energy involved. The jump from 55 to 70 mph represents roughly a 62% increase in kinetic energy, which means a 62% heavier burden on your brakes, your tires, and ultimately on anything your vehicle might strike.
Understanding this isn't about fear — it's about calibration. Speed isn't inherently dangerous; mismatched speed is. The gap between what's physically happening and what a driver perceives is where crashes are born.
154 ft
Pre-brake travel at 70 mph in 1.5 seconds
Based on AASHTO perception-reaction time standards used by state DOTs in stopping-sight-distance calculations.
62%
More kinetic energy at 70 mph vs. 55 mph
Kinetic energy scales with the square of velocity, meaning incremental speed increases produce disproportionate collision-force increases.
~404 ft
Total stopping distance at 70 mph, dry road
Combines 1.5-second reaction distance with physics-based braking distance on dry asphalt with a 0.7 friction coefficient.
8.5%
Fatality rate increase per 5 mph limit rise
Insurance Institute for Highway Safety (IIHS) analysis of speed limit changes across multiple U.S. states over several decades.
5 sec
Average eyes-off-road time per text message
According to NHTSA distracted driving research; at 70 mph, five seconds equals over 500 feet of unsupervised travel.
Breaking Down Reaction Time: What the Research Actually Says
The phrase 'reaction time' gets used loosely, but traffic engineers divide the process into distinct phases, each consuming precious fractions of a second — and feet of road.
Perception Time
This is the interval from when a hazard enters your field of vision to when your brain registers it as a threat. In clear conditions with an alert driver, this takes roughly 0.5 to 0.75 seconds. Add any complexity — a hazard appearing at night, in rain, or at the periphery of vision — and that window stretches.
Decision Time
Once your brain flags a threat, it must choose a response: brake, swerve, or accelerate out of danger. For a straightforward highway obstacle, this typically takes another 0.25 to 0.5 seconds. An unexpected or ambiguous hazard — a child chasing a ball, a car merging erratically — forces longer deliberation.
Reaction (Motor) Time
Finally, your body executes the decision: your foot moves from accelerator to brake pedal. This mechanical motion takes roughly 0.2 to 0.3 seconds for an alert driver.
Combined, the full perception-reaction time (PRT) for an alert, unimpaired driver lands at approximately 1.5 seconds, the figure used by many state DOTs in stopping-sight-distance calculations. The American Association of State Highway and Transportation Officials (AASHTO) uses a more conservative 2.5 seconds for road design, accounting for the full spectrum of driver ages and conditions.
“Drivers routinely underestimate how long it takes to stop a vehicle at highway speeds. The combination of perception delay, decision time, and braking distance means that the gap between recognizing a hazard and completing a stop is almost always larger than drivers assume.”
— David Zuby, Former Executive Vice President, Insurance Institute for Highway Safety
The table below illustrates what these time windows mean in terms of distance covered before your foot even touches the brake:
| Speed | Feet per second | Distance in 1.5 sec (alert driver) | Distance in 2.5 sec (AASHTO design) |
|---|---|---|---|
| 55 mph | 80.7 ft/s | 121 feet | 202 feet |
| 65 mph | 95.3 ft/s | 143 feet | 238 feet |
| 70 mph | 102.7 ft/s | 154 feet | 257 feet |
| 80 mph | 117.3 ft/s | 176 feet | 293 feet |
These figures represent only the pre-brake distance. Braking distance — the additional feet needed to bring the vehicle to a full stop once the pedal is depressed — layers on top, governed by vehicle weight, brake condition, tire quality, and road surface.
The 1.5-Second Baseline Has Limits
The 1.5-second perception-reaction time is a best-case estimate for alert, unimpaired drivers in clear conditions. AASHTO uses 2.5 seconds for highway design specifically because real-world drivers — particularly older adults, fatigued commuters, and those dealing with complex traffic — routinely exceed the alert-driver baseline. Plan your following distance for 2.5 seconds, not 1.5.
Cruise Control Isn't the Same as Attentive Driving
Cruise control maintains speed accurately but doesn't compensate for delayed hazard recognition. Some drivers become less mentally engaged when using cruise control on long stretches of open highway — a phenomenon sometimes called 'highway hypnosis.' Adaptive cruise control systems react faster than humans in follow-distance scenarios but have detection limits in complex situations. Use both technologies as aids, not substitutes for active scanning.
Vehicle Weight Significantly Affects Braking Distance
The stopping-distance figures cited in this article are based on typical passenger vehicles. Pickup trucks, SUVs, and vehicles carrying heavy cargo have higher kinetic energy at the same speed and often require meaningfully longer stopping distances. If you regularly drive a heavier vehicle, add additional following distance — especially on highways.
Total Stopping Distance: Adding Braking Distance to the Equation
Perception-reaction distance and braking distance together constitute total stopping distance — the number that matters most for practical safety. Braking distance increases with the square of speed, so the math compounds quickly as velocity rises.
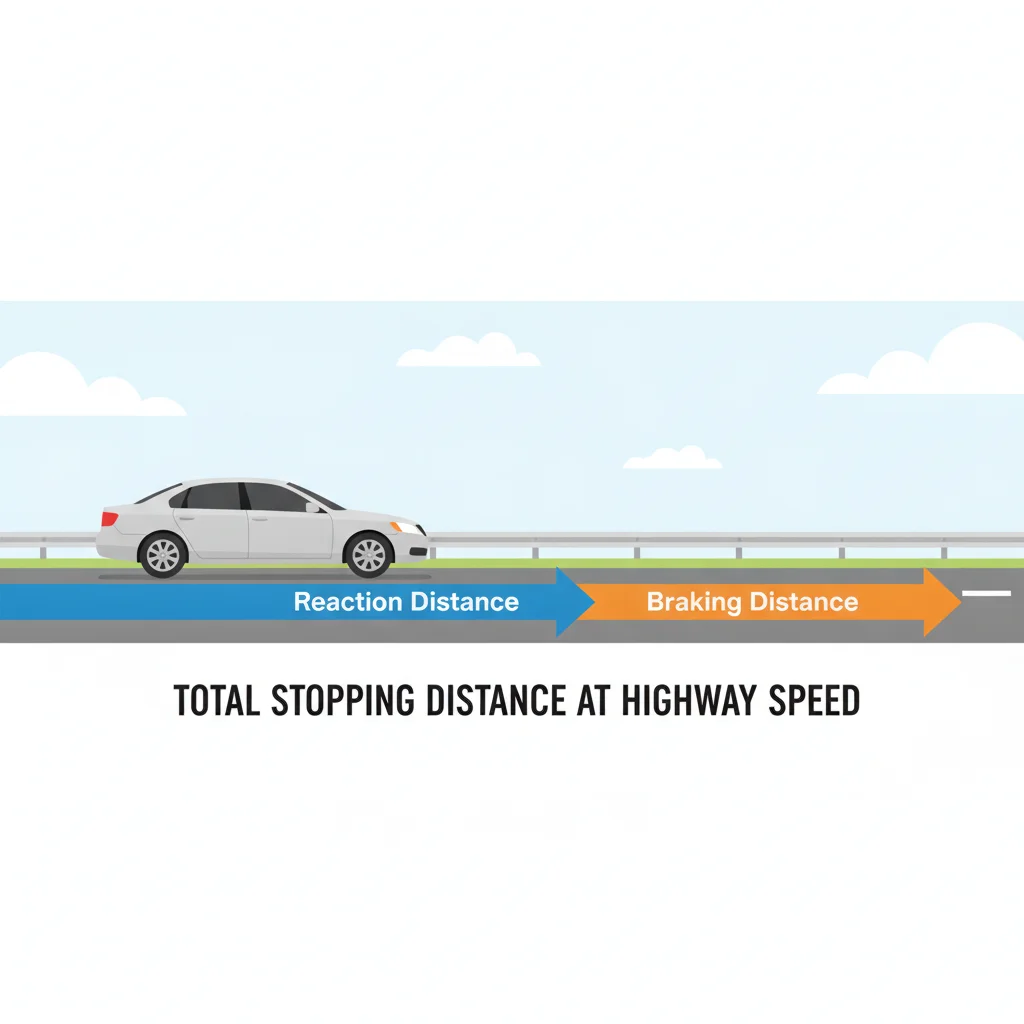
Using standard dry-asphalt friction coefficients (approximately 0.7 for modern tires), the physics yield these approximate braking distances for a typical passenger vehicle:
- 55 mph: ~155 feet of braking distance + ~121 feet of reaction distance = ~276 feet total
- 65 mph: ~215 feet of braking distance + ~143 feet of reaction distance = ~358 feet total
- 70 mph: ~250 feet of braking distance + ~154 feet of reaction distance = ~404 feet total
The difference between stopping at 55 mph and stopping at 70 mph is roughly 128 additional feet — about four car lengths longer than most drivers leave as a following gap on American interstates. That's the margin that separates a near-miss from a rear-end collision.
Use the 3-Second Rule as Your Baseline
At any highway speed, pick a fixed landmark and count three seconds after the vehicle ahead passes it. If you reach that landmark before counting to three, you're following too closely. At 70 mph, three seconds equals roughly 308 feet — just enough buffer under ideal conditions. Extend to four seconds in rain, at night, or when fatigued.
Adjust Speed Before Conditions Force You To
Wet roads, reduced visibility, and heavy traffic all compress the margin between your reaction distance and your actual following gap. Reduce speed proactively when conditions change rather than after the hazard appears. A 10 mph reduction from 70 to 60 mph cuts stopping distance by roughly 100 feet on dry pavement — more on wet.
It's worth noting that these figures assume optimal conditions: dry pavement, well-maintained brakes, and alert driver engagement. Real-world stopping distances routinely exceed engineering estimates. The National Highway Traffic Safety Administration (NHTSA) reports that many production vehicles, tested under ideal conditions, still exceed the theoretical minimums due to brake fade, tire wear, and weight distribution.
On wet pavement, friction coefficients drop to roughly 0.4, which can push stopping distances to 600 feet or more at 70 mph. That's longer than two football fields from hazard recognition to full stop.
What Degrades Reaction Time Further — And How Common It Is
The 1.5-second baseline assumes the best-case version of a driver: alert, unimpaired, hands on the wheel, eyes forward. That's rarely the full picture on American highways.
Distraction
The NHTSA estimates that sending or reading a text message takes your eyes off the road for an average of five seconds. At 70 mph, five seconds equals roughly 514 feet of unsupervised travel — farther than you can safely stop even under ideal conditions. Cognitive distraction — a phone conversation, passenger interaction, or even absorbing music — impairs hazard-detection speed even when eyes remain on the road.
Fatigue
Sleep-deprived driving is legally unregulated in most states but physiologically comparable to impairment. Research from the AAA Foundation for Traffic Safety found that drivers who sleep 6–7 hours per night are 1.3 times more likely to crash than those sleeping 8 hours. Fatigue primarily lengthens perception time — the first and most invisible phase of the reaction sequence.
Age
Older drivers typically show longer reaction times, particularly in complex or unexpected situations. The AASHTO 2.5-second design standard was partly developed to accommodate this reality. A 70-year-old driver may have a PRT closer to 2.0–2.5 seconds, adding another 50–100 feet of pre-brake distance at highway speeds.
Alcohol and Cannabis
Even at legal blood-alcohol limits, alcohol measurably slows decision time. At 0.08% BAC, mean reaction times in simulator studies increase by 10–15%. Cannabis impairment affects tracking and hazard detection differently but consistently degrades overall driving performance in studies reviewed by NHTSA.
Use the 3-Second Rule as Your Baseline
At any highway speed, pick a fixed landmark and count three seconds after the vehicle ahead passes it. If you reach that landmark before counting to three, you're following too closely. At 70 mph, three seconds equals roughly 308 feet — just enough buffer under ideal conditions. Extend to four seconds in rain, at night, or when fatigued.
Adjust Speed Before Conditions Force You To
Wet roads, reduced visibility, and heavy traffic all compress the margin between your reaction distance and your actual following gap. Reduce speed proactively when conditions change rather than after the hazard appears. A 10 mph reduction from 70 to 60 mph cuts stopping distance by roughly 100 feet on dry pavement — more on wet.
The core insight here is that the 1.5-second baseline is a ceiling, not a floor. Under real-world conditions — which include mild fatigue, mild distraction, and the occasional processing delay — most drivers are operating with reaction windows closer to 2–3 seconds, making the 55-vs-70 speed differential even more consequential.
Speed, Reaction Time, and Crash Outcomes: What the Data Shows
Reaction time matters because it determines whether a driver can intervene before impact. But speed also governs crash severity when intervention fails. These two factors compound each other in ways that explain why incremental speed increases produce disproportionate crash-fatality increases.
A 2021 analysis by the Insurance Institute for Highway Safety (IIHS) found that raising speed limits by 5 mph on interstates and freeways was associated with an 8.5% increase in fatality rates on those roads. The effect was consistent across multiple states and multiple decades of speed limit changes — a finding that held even when controlling for vehicle mix and traffic volume.
The underlying mechanism is kinetic energy. When braking fails or isn't possible in time, the energy that would have been dissipated by brakes and tires is instead transferred to occupants and structures. At 70 mph versus 55 mph, that energy difference is not marginal — it's the difference between a serious injury and a fatal one at the threshold where human bodies and vehicle structures begin to fail.
For a deeper look at how speed affects vehicle efficiency — not just safety — the physics behind EV range at higher speeds follows the same aerodynamic drag principles that make every extra mph costly in multiple dimensions.
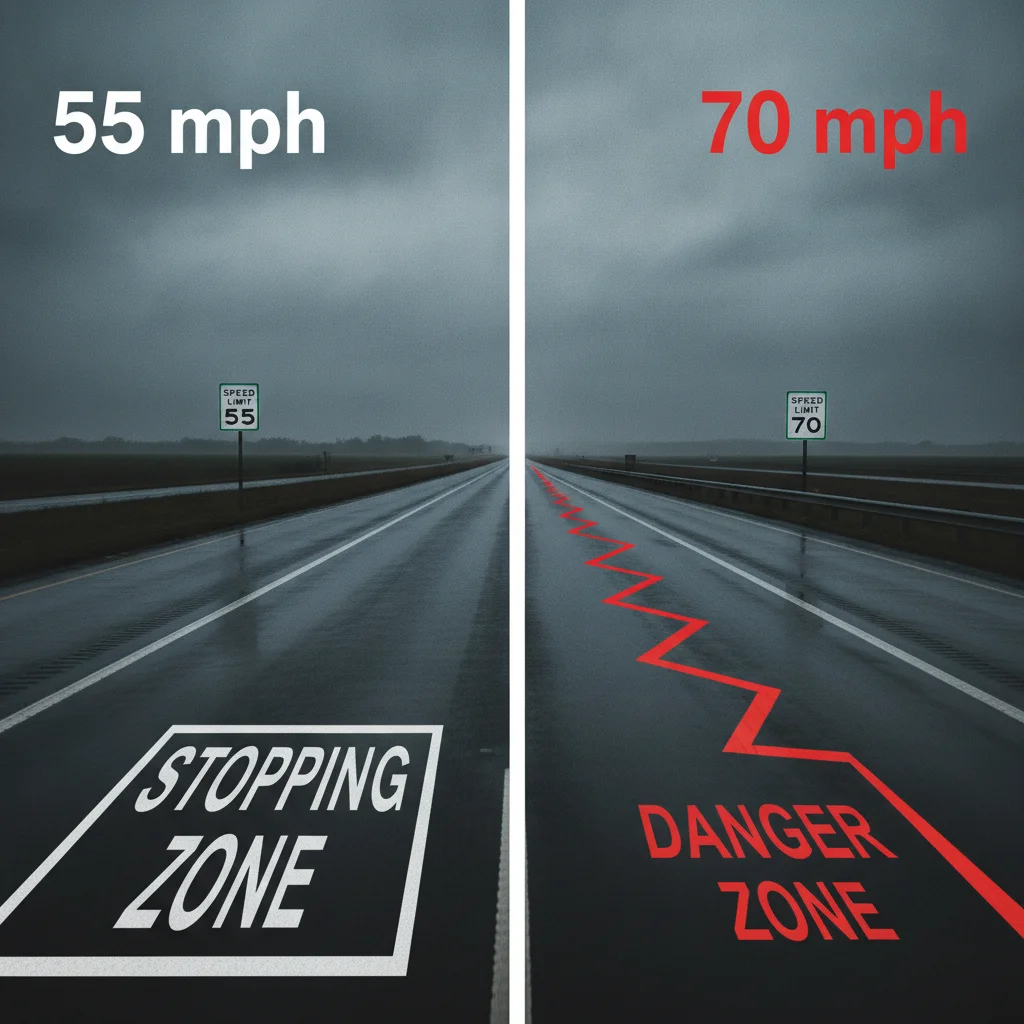
And the legal speed limit isn't always a reliable guide to what's actually safe. posted limits and actual safe speed diverge significantly in rain, at night, in construction zones, and in dense traffic — all situations where the reaction-time math becomes even less forgiving at 70 mph.
Practical Adjustments That Close the Margin
Understanding the physics is step one. Step two is translating it into habits that don't require checking mental arithmetic every time you merge onto a highway.
The Three- to Four-Second Following Rule
Pick a fixed landmark — an overpass, a sign — and count how many seconds pass between the car ahead clearing it and your reaching it. At 70 mph, three seconds gives you roughly 308 feet of buffer, which aligns closely with total stopping-distance estimates under ideal conditions. In rain, fog, or heavy traffic, extend to four seconds.
Eyes Far Down the Road
Perception time shrinks when drivers scan further ahead. Highway driving safety training consistently emphasizes looking 12–15 seconds down the road — not at the bumper immediately in front. At 70 mph, 12 seconds corresponds to over 1,200 feet, which gives you time to identify and process hazards before they enter your stopping-distance bubble.
Speed Management in Adverse Conditions
Wet pavement effectively doubles stopping distance. Fog reduces visibility to distances shorter than your stopping distance at highway speeds. In these conditions, adjusting speed below the posted limit isn't excessive caution — it's basic physics literacy.
Understanding the Real Cost of Extra Speed
The financial and safety costs of driving faster are interconnected. every extra 10 mph on the highway costs measurably more in fuel and wear — and as this article documents, it also costs you reaction time and stopping margin.
The 1.5-Second Baseline Has Limits
The 1.5-second perception-reaction time is a best-case estimate for alert, unimpaired drivers in clear conditions. AASHTO uses 2.5 seconds for highway design specifically because real-world drivers — particularly older adults, fatigued commuters, and those dealing with complex traffic — routinely exceed the alert-driver baseline. Plan your following distance for 2.5 seconds, not 1.5.
Cruise Control Isn't the Same as Attentive Driving
Cruise control maintains speed accurately but doesn't compensate for delayed hazard recognition. Some drivers become less mentally engaged when using cruise control on long stretches of open highway — a phenomenon sometimes called 'highway hypnosis.' Adaptive cruise control systems react faster than humans in follow-distance scenarios but have detection limits in complex situations. Use both technologies as aids, not substitutes for active scanning.
Vehicle Weight Significantly Affects Braking Distance
The stopping-distance figures cited in this article are based on typical passenger vehicles. Pickup trucks, SUVs, and vehicles carrying heavy cargo have higher kinetic energy at the same speed and often require meaningfully longer stopping distances. If you regularly drive a heavier vehicle, add additional following distance — especially on highways.
Phone Management
Eliminating the five-second text-reading window at highway speed is the single highest-impact distraction intervention available to any driver. Hands-free systems reduce manual distraction but maintain cognitive load. The safest habit remains placing the phone out of reach in a bag or glove compartment before driving.
What This Means for How You Think About Highway Speed
The gap between 55 and 70 mph isn't primarily a legal question — it's an engineering one. Those 15 additional miles per hour compress your reaction window by roughly 33 feet, extend your braking distance by nearly 100 feet, and increase the kinetic energy in a collision by 62%. No amount of driving skill changes the underlying physics.
What skill and awareness can change is how you position yourself within those physics: maintaining enough following distance to use your reaction window effectively, scanning far enough ahead to extend your perception time, managing speed in conditions where friction coefficients drop, and eliminating the avoidable delays — distraction, fatigue — that push your real reaction time well beyond the 1.5-second engineering baseline.
The most useful reframe is this: speed limits are the upper bound under ideal conditions, not a target. The informed driver treats them as a ceiling and calibrates downward as conditions — weather, traffic density, visibility, fatigue level — shift the stopping-distance equation. That's not timidity. That's applied physics.

All claims are backed by peer-reviewed research. Sources on request.