Key Takeaways
Intersection Crash
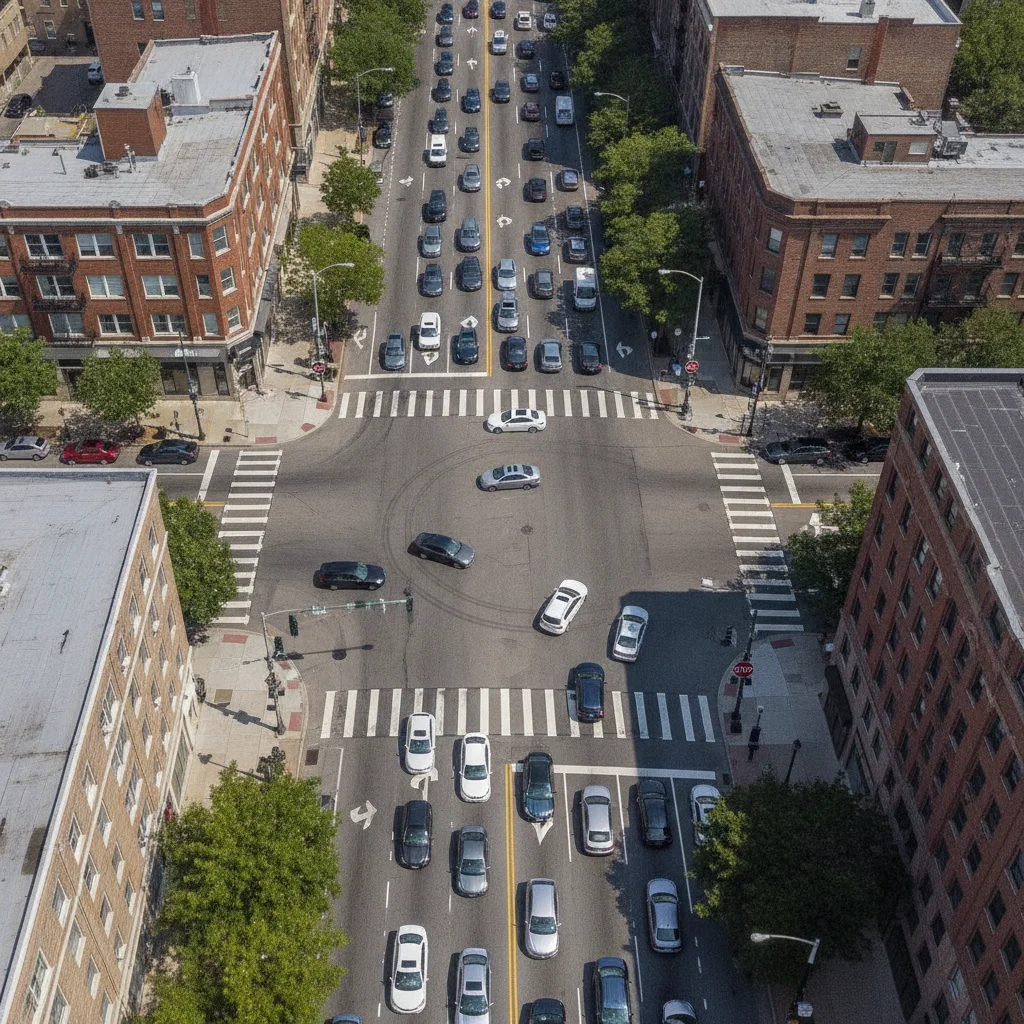
An intersection crash is any collision that occurs within or immediately adjacent to a road junction — where two or more roads meet, merge, or cross. These crashes typically involve vehicles traveling in conflicting directions and are most often triggered by failure to yield, misjudgment of speed or distance, and distracted or impaired driving. Because multiple streams of traffic converge at intersections, the margin for error is narrow and the consequences of mistakes are severe.
The Federal Highway Administration (FHWA) defines an intersection-related crash as one occurring within 250 feet of an intersection when the crash is influenced by the intersection environment — a distinction that captures indirect conflicts like rear-end crashes caused by sudden stops at signals.
Why Intersections Are America's Most Dangerous Road Feature
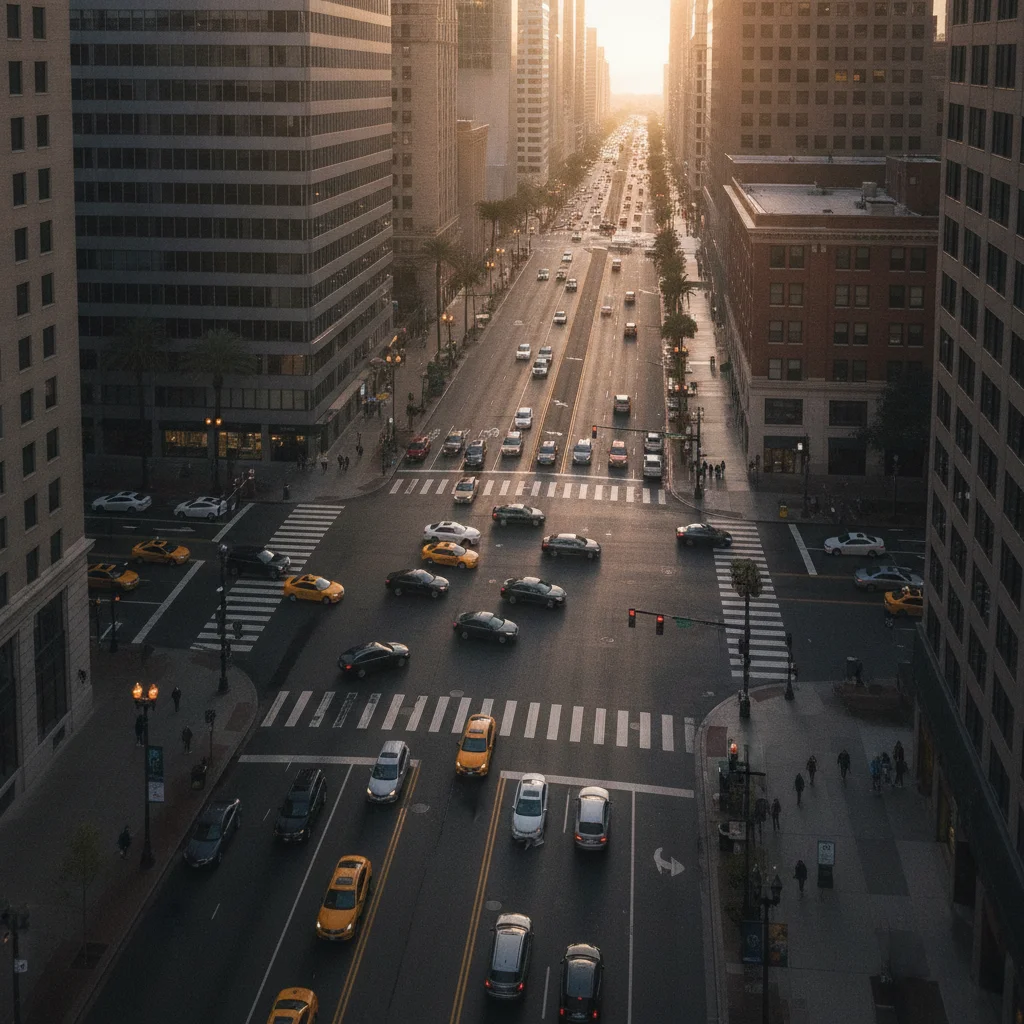
Intersections are engineering compromises. They exist because roads must cross, but every crossing is a controlled conflict — a point where vehicles traveling in different directions share the same physical space at the same moment. When the system works, it works invisibly. When it fails, the results are often catastrophic.
According to the Federal Highway Administration, intersections account for roughly 40% of all reported crashes in the United States and approximately 20% of traffic fatalities. That makes them the single most dangerous location category on American roads — more so than highways, construction zones, or rural curves, all of which receive far more public attention.
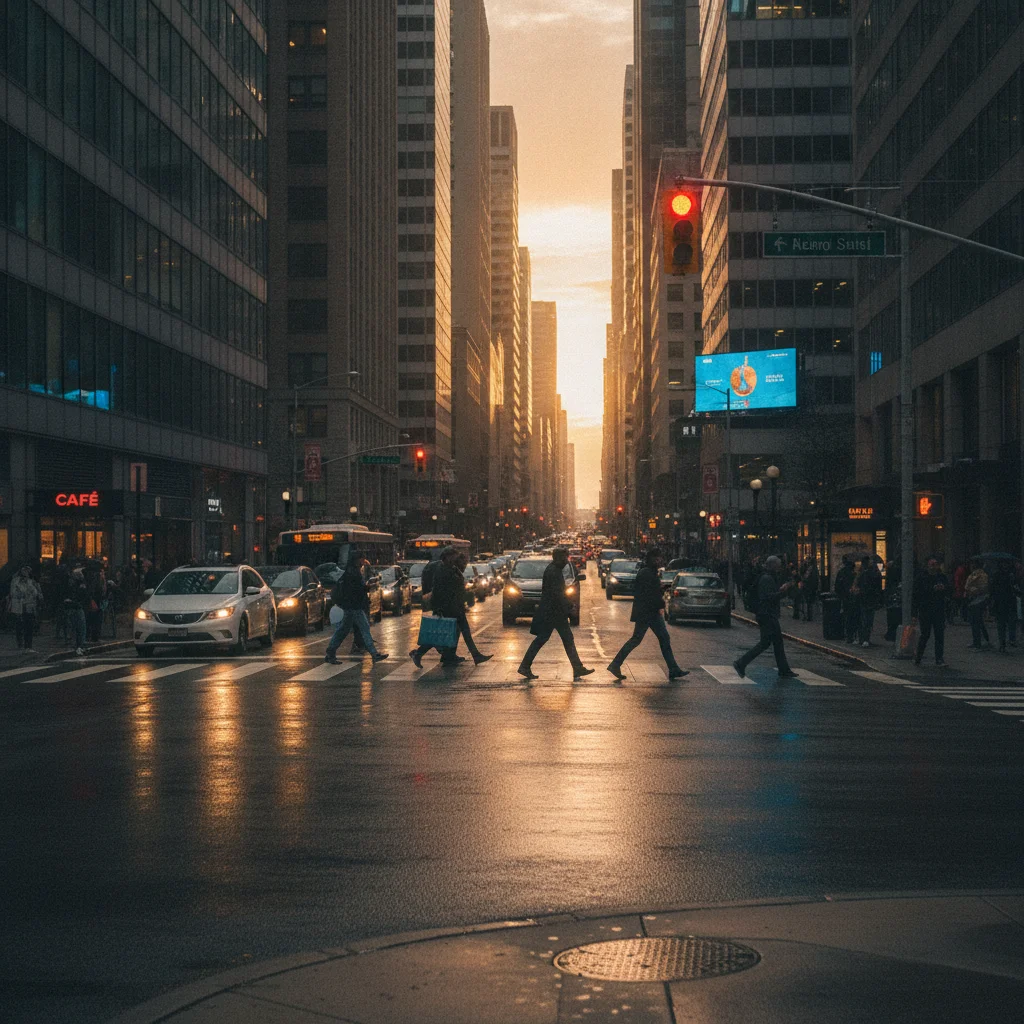
What makes this figure particularly striking is that intersections represent only a tiny fraction of total road mileage. A driver passes through dozens of them on a typical commute, and for most of those passages, nothing goes wrong. The danger is concentrated, repeated, and — critically — patterned. Researchers have identified recurring behaviors, design factors, and decision failures that explain why intersection crashes keep happening with such consistency. Understanding those patterns is the first step toward breaking them.
40%
Share of all U.S. crashes at intersections
According to the Federal Highway Administration, intersections account for approximately 40% of all reported traffic crashes in the United States.
~900
Annual U.S. deaths from red-light running
The Insurance Institute for Highway Safety (IIHS) estimates red-light running kills approximately 900 people and injures tens of thousands more each year.
96%
Intersection crashes with driver behavior as key factor
NHTSA research identified driver behavior as the critical pre-crash factor in approximately 96% of intersection-related crashes studied.
90%
Fatal crash reduction with roundabouts
The IIHS reports that converting traditional intersections to modern roundabouts reduces fatal crashes by up to 90%.
20–40%
Typical insurance premium increase after at-fault crash
Drivers found at fault in an intersection crash typically see auto insurance premiums rise 20–40% depending on carrier and crash severity.
The Behavior Patterns Behind the Numbers
The NHTSA's landmark intersection safety study identified driver behavior as the critical pre-crash factor in approximately 96% of intersection crashes — meaning engineering and environmental factors, while real, are secondary contributors. The dominant behaviors cluster into a short list that appears across nearly every serious intersection crash investigation.
Failure to Yield Right-of-Way
This is the single most cited factor in fatal intersection crashes. Yielding sounds simple — it's among the first concepts taught in driver's education — but in practice, it requires rapid judgment about the speed and intent of other vehicles, often in a fraction of a second. Drivers routinely misjudge closing speeds, assume others will brake, or simply don't check before entering. See our guide to right-of-way rules most drivers misread for a detailed breakdown of the specific rules — at four-way stops, uncontrolled intersections, and yield signs — where confusion is most common.
Running Red Lights and Stop Signs
Red-light running kills approximately 900 people annually in the U.S. and injures tens of thousands more, according to the Insurance Institute for Highway Safety (IIHS). The behavior isn't always deliberate: many incidents involve drivers who entered an intersection on yellow and were caught mid-crossing when the signal changed, or who misjudged the timing. Rolling stops at stop signs — universally common, widely normalized — contribute to thousands of angle crashes each year.
Inattention and Distraction
Cognitive distraction degrades driving performance in ways that are often invisible to the distracted driver. Phone use is the most studied form, but eating, in-car conversations, and even radio adjustments have measurable effects on hazard detection at intersections. The challenge at an intersection is that it demands peak attentional resources — multiple streams of information arriving simultaneously — at exactly the moment many drivers are mentally elsewhere.
Distraction Doesn't End When the Phone Does
AAA Foundation research found that cognitive distraction from a phone call can persist for up to 27 seconds after the call ends — well into the next intersection a driver encounters. Hands-free devices reduce physical distraction but do not eliminate the cognitive load of conversation. This means finishing a call just before an intersection does not restore full attentional capacity in time.
Secondary Crashes at Intersection Scenes
A primary intersection crash frequently creates conditions for secondary crashes: debris in the roadway, disabled vehicles blocking lanes, distracted rubbernecking from passing drivers, and emergency vehicles creating new traffic conflicts. Drivers approaching a crash scene should reduce speed significantly and avoid lane changes until well clear of the scene. This secondary crash risk is well-documented but rarely discussed in driver safety education.
Misjudging Speed and Gap Acceptance
Gap acceptance — the decision about whether there is enough space and time to cross or turn in front of an approaching vehicle — is one of the most error-prone perceptual tasks in everyday driving. Research consistently shows that drivers underestimate the speed of approaching vehicles and overestimate their own ability to complete the crossing or turn. This problem is amplified at night, in poor weather, and when approaching vehicles are motorcycles or large trucks (whose speeds are harder to gauge).
Left Turns: The Asymmetric Risk
Not all intersection movements carry equal risk. Left turns stand out as disproportionately dangerous — a pattern so consistent that it has shaped vehicle design, delivery logistics, and infrastructure planning.
The geometry is straightforward: a left turn requires crossing the path of oncoming traffic traveling in the opposite direction. A driver must find a safe gap, judge the speed of approaching vehicles, accelerate through the gap, and complete the turn — all while managing cross-traffic from the other direction. The exposure window is longer, the consequences of misjudgment are more severe, and the cognitive load is higher than almost any other routine driving maneuver.
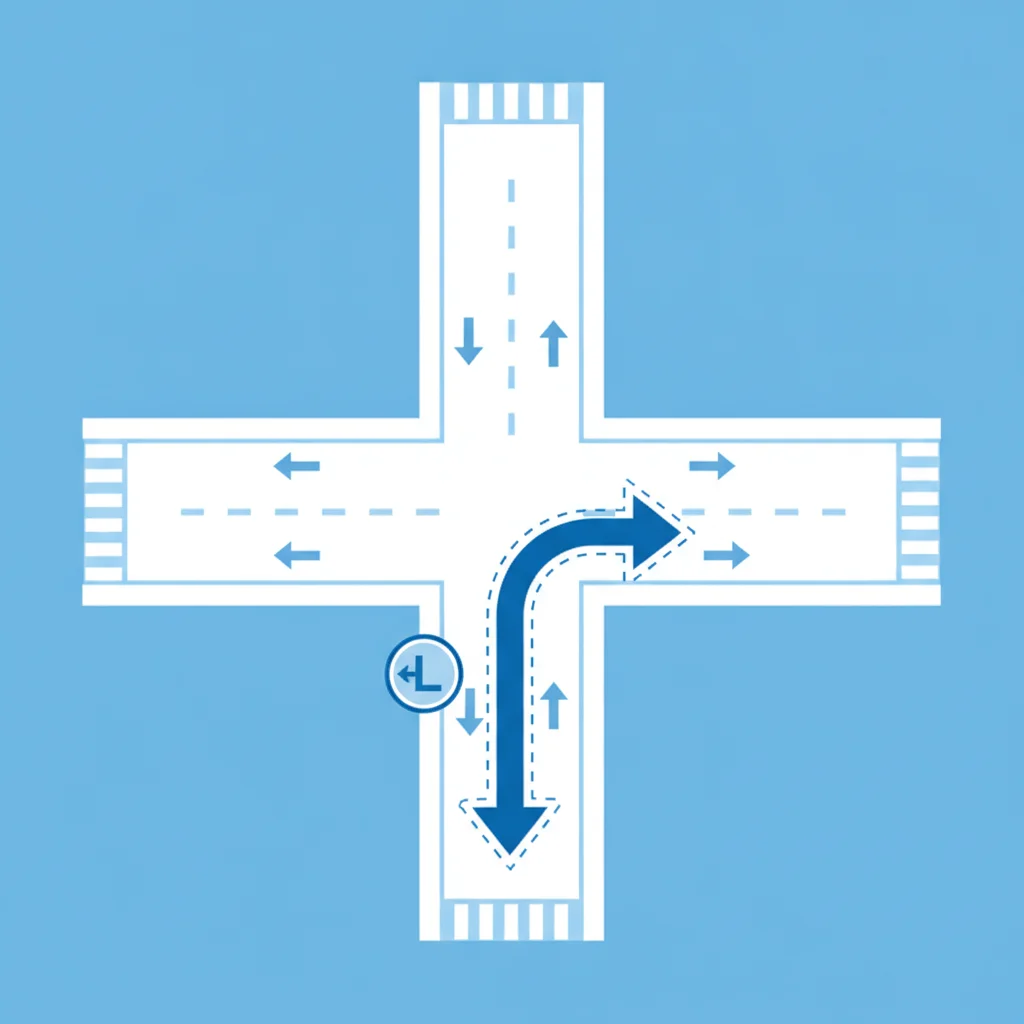
UPS famously restructured its delivery routes in the mid-2000s to minimize left turns — not for safety theater, but because the data showed that left-turn waits wasted fuel and that left-turn crashes generated real operational costs. The company reported saving millions of gallons of fuel annually and reducing accidents as a side effect of a logistics optimization.
For everyday drivers, the implication isn't to eliminate left turns entirely but to recognize their elevated risk profile. At uncontrolled or low-visibility intersections, choosing a route that substitutes three right turns for one left turn is a legitimate safety strategy — not an overreaction.
When to Choose Three Rights Over One Left
At uncontrolled or low-visibility intersections — particularly during night driving or in poor weather — three consecutive right turns can substitute for a single left turn without adding significant travel time. This routing strategy eliminates crossing oncoming traffic entirely. Navigation apps rarely suggest it automatically, so it's a conscious driver habit rather than a default route.
Approach Speed Is Your Margin for Error
Reducing your speed by just 10–15 mph on intersection approach nearly triples your stopping distance advantage in an emergency. This is especially valuable at intersections with obstructed sight lines, high pedestrian traffic, or known red-light-running histories. Think of reduced approach speed as buying time — the one resource you can't recover once a conflict enters your path.
Dedicated left-turn signal phases — the green arrow — exist specifically to reduce this risk by eliminating the oncoming traffic variable. When a protected left-turn phase is available, using it is consistently safer than turning on a permissive (solid green) signal.
Design, Infrastructure, and Why Roundabouts Work
Not every intersection crash is the result of driver failure. Road design shapes driver behavior, and poorly designed intersections create predictable failure modes regardless of driver skill or intent.
High-speed approaches, obscured sight lines, inadequate lighting, missing or faded pavement markings, and poorly timed signal phases all increase crash probability. The FHWA's Highway Safety Improvement Program tracks intersection modifications — adding turn lanes, improving visibility, adjusting signal timing — that have produced measurable reductions in crash rates at specific locations.
But no intersection design has accumulated stronger safety evidence than the modern roundabout. By eliminating 90-degree crossing conflicts and forcing vehicles to slow to merge speeds, roundabouts fundamentally change the type of crash that can occur. The IIHS reports that converting a traditional intersection to a roundabout reduces fatal crashes by up to 90% and injury crashes by roughly 75%. The physics is simple: vehicles enter roundabouts at 15–25 mph rather than crossing at 45 mph, and they travel in the same direction rather than opposing paths — meaning any collision is a sideswipe at low speed rather than a T-bone at highway speed.
“Roundabouts are one of the most effective safety tools we have. The evidence is overwhelming — they save lives, and the main barrier to adoption isn't engineering, it's familiarity. Once drivers use them regularly, acceptance consistently rises.”
— Anne T. McCartt, Former Senior Vice President of Research, Insurance Institute for Highway Safety
Despite the evidence, roundabout adoption in the U.S. has been slower than in Europe and Australia, partly due to public unfamiliarity and partly due to the upfront cost of retrofitting existing intersections. Where they have been built — particularly in states like Washington, Florida, and Maryland — crash reduction outcomes have closely tracked the research predictions.
Vulnerable Road Users: A Hidden Dimension of Intersection Risk
Motor vehicle occupants aren't the only ones at risk at intersections. Pedestrians and cyclists are exposed to the same conflict points but with none of the structural protection that a vehicle provides. According to the NHTSA, intersections are the location of the majority of pedestrian fatalities involving turning vehicles — particularly right-turn-on-red movements, where drivers focus on vehicle traffic gaps and fail to check the crosswalk for pedestrians who have a legal right to be there.
Cyclists face a specific intersection hazard called the right hook — when a motor vehicle overtakes a cyclist and then turns right, cutting across the cyclist's path. This maneuver is rarely deliberate but reflects a consistent failure of drivers to account for the speed of cyclists in their blind spots and mirrors.
Speed is a decisive variable in all of these scenarios. A pedestrian struck by a vehicle traveling at 20 mph has roughly a 90% chance of surviving; at 40 mph, the fatality rate flips to roughly 85%. Approach speed at intersections is therefore a life-or-death variable for vulnerable road users who may be in a driver's path.
Breaking the Pattern: Habits That Actually Reduce Risk
Research on driver behavior at intersections consistently points to a set of habits that lower individual crash probability — not by eliminating risk entirely, but by building in decision margins that prevent single errors from becoming collisions.
The One-Second Cross-Traffic Scan
Before entering any intersection — even on a green light — pause for one full second to scan left, then right, for vehicles that may be running the red. This habit costs almost nothing in time and catches the category of red-light runners that kill even compliant drivers.
Complete Stops, Not Rolling Stops
A rolling stop at a stop sign reduces stopping time but also reduces the scan window to near zero. Complete stops — where the vehicle is fully stationary before the driver scans and proceeds — are associated with meaningfully lower angle crash rates in controlled intersection studies.
Speed Reduction on Approach
Approaching intersections at reduced speed extends reaction time and reduces stopping distance. At 40 mph, stopping distance in an emergency braking scenario is roughly 160 feet. At 25 mph, it drops to approximately 62 feet — a difference that routinely determines whether a driver can avoid a conflict that enters the intersection unexpectedly.
When to Choose Three Rights Over One Left
At uncontrolled or low-visibility intersections — particularly during night driving or in poor weather — three consecutive right turns can substitute for a single left turn without adding significant travel time. This routing strategy eliminates crossing oncoming traffic entirely. Navigation apps rarely suggest it automatically, so it's a conscious driver habit rather than a default route.
Approach Speed Is Your Margin for Error
Reducing your speed by just 10–15 mph on intersection approach nearly triples your stopping distance advantage in an emergency. This is especially valuable at intersections with obstructed sight lines, high pedestrian traffic, or known red-light-running histories. Think of reduced approach speed as buying time — the one resource you can't recover once a conflict enters your path.
Phone Elimination, Not Reduction
Research from the AAA Foundation for Traffic Safety found that the cognitive distraction of a hands-free call persists for up to 27 seconds after the call ends. At intersections, that residual distraction is as dangerous as active phone use. The evidence supports elimination of phone conversations while approaching intersections — not merely switching to hands-free.
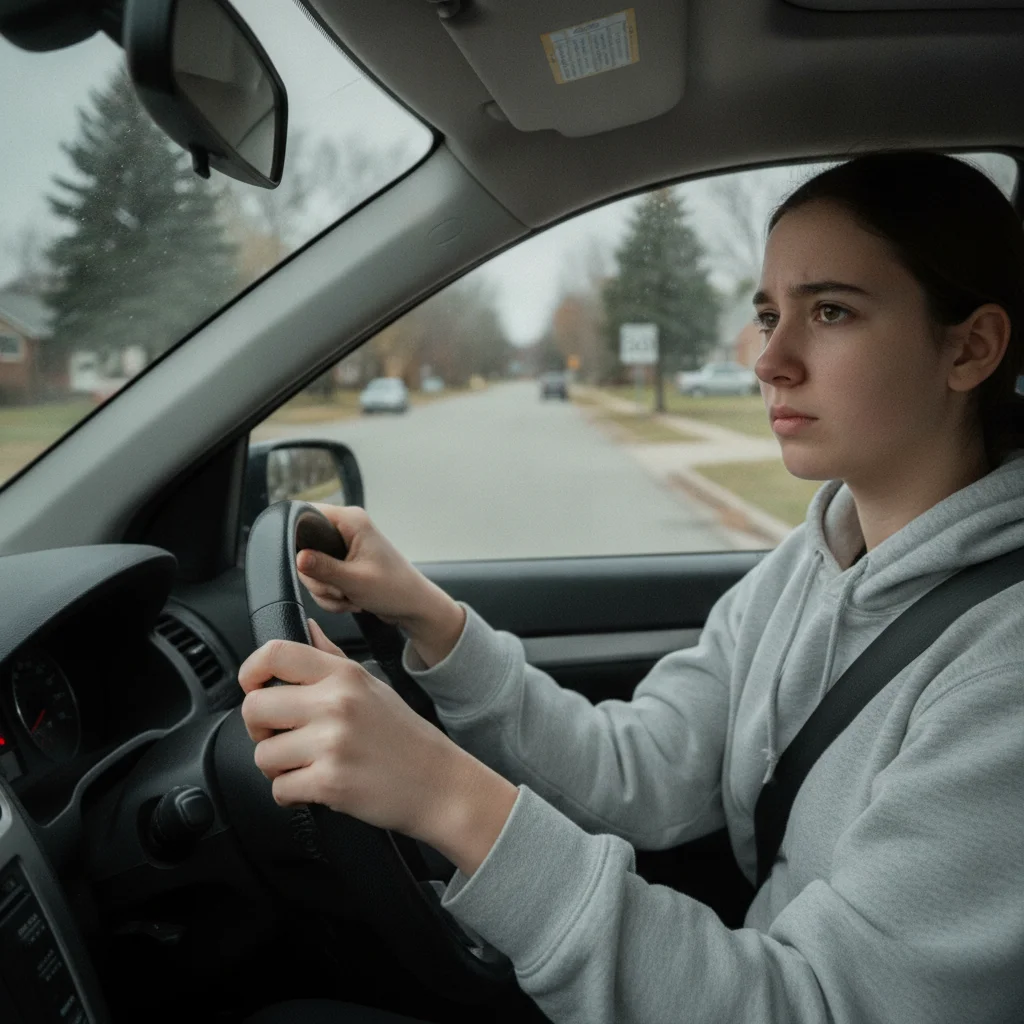
For teen drivers in particular, these habits are critical. Teen crash rates are nearly three times higher than adult rates, and intersection crashes are a primary contributor — in part because novice drivers haven't yet developed the automatic hazard-detection patterns that experienced drivers apply without conscious effort.
What Intersection Crashes Cost Beyond the Scene
The immediate consequences of an intersection crash — vehicle damage, injury, delayed traffic — are visible. The downstream costs are less obvious but equally real.
An at-fault intersection crash typically triggers an insurance premium increase of 20–40%, depending on the carrier, the severity of the crash, and the driver's prior record. For a driver paying $1,800 annually, that's an additional $360–$720 per year for three to five years — often more than the cost of repairing the vehicle damage itself.
Injury claims from angle crashes — the dominant crash type at intersections — are disproportionately expensive because broadside collisions expose occupants to serious thoracic and spinal injuries. Whiplash claims from rear-end crashes at intersections are among the most litigated in personal injury law, partly because they are difficult to objectively verify and partly because they are extremely common.
Distraction Doesn't End When the Phone Does
AAA Foundation research found that cognitive distraction from a phone call can persist for up to 27 seconds after the call ends — well into the next intersection a driver encounters. Hands-free devices reduce physical distraction but do not eliminate the cognitive load of conversation. This means finishing a call just before an intersection does not restore full attentional capacity in time.
Secondary Crashes at Intersection Scenes
A primary intersection crash frequently creates conditions for secondary crashes: debris in the roadway, disabled vehicles blocking lanes, distracted rubbernecking from passing drivers, and emergency vehicles creating new traffic conflicts. Drivers approaching a crash scene should reduce speed significantly and avoid lane changes until well clear of the scene. This secondary crash risk is well-documented but rarely discussed in driver safety education.
Beyond financial costs, the secondary safety risk of intersection crashes is often overlooked: a crash in an active intersection can create debris, disabled vehicles, and distracted bystanders that trigger subsequent crashes. Rubbernecking-related rear-end crashes at crash scenes are a well-documented phenomenon. In this sense, intersection crashes are not self-contained events — they ripple outward in ways that compound both the human and economic toll.
The patterns that produce intersection crashes are consistent, well-documented, and largely within driver control. That's both the sobering reality and the actionable opportunity. Understanding what the research shows about why these crashes keep happening is the prerequisite to changing personal behavior in ways that meaningfully shift the odds.

All claims are backed by peer-reviewed research. Sources on request.