Key Takeaways
Option A
Depreciation
The silent, largest cost most owners never track.
Best for: Understanding the true long-term financial impact of owning — or selling — a vehicle at any point in its life.
Option B
Out-of-Pocket Costs
The visible, day-to-day expenses that feel like the whole story.
Best for: Budgeting monthly cash flow and planning for routine maintenance, fuel, and insurance obligations.
If you're deciding which vehicle to buy and want to minimize total ownership cost
Depreciation
Choosing a vehicle with a strong residual value curve saves far more money over five years than squeezing a few cents off the price of gas. Start here before anything else.
If you're on a tight monthly budget and need to keep cash outflows predictable
Out-of-Pocket Costs
Mapping your insurance, fuel, and maintenance obligations tells you what you'll actually need in your account each month — essential for living with the car comfortably.
If you're deciding when to sell or trade in your current vehicle
Depreciation
Depreciation curves tell you the worst and best windows to exit. Selling before a major depreciation drop can recover thousands of dollars you'd otherwise leave on the table.
If you're comparing a new car purchase to a used car purchase
Out-of-Pocket Costs
Used cars sidestep the worst depreciation years but typically come with higher maintenance bills. Modeling out-of-pocket costs for both scenarios gives you an honest apples-to-apples comparison.
If you're calculating the true long-term cost of any vehicle over a five-year period
Depreciation
For most drivers, depreciation accounts for 40–50% of total ownership cost over five years — dwarfing fuel and insurance when you run the full numbers.
Why Most Owners Only See Half the Bill
When you think about what your car costs you, the mental checklist is pretty consistent: gas, insurance, oil changes, maybe a set of tires every few years. Those are real costs, and they show up on your bank statement like clockwork. But there's another cost running in the background, one that never generates an invoice and never hits your checking account directly — and it's almost certainly bigger than everything on that checklist combined.
That cost is depreciation. And if you've never consciously tracked it, you're not alone. Most drivers have no idea how much value their vehicle is shedding every year because they never see a bill for it. You only feel it when you go to sell and the number the dealer quotes — or the number Kelley Blue Book spits out — is a lot lower than you were expecting.
The goal here isn't to make you feel bad about that. It's to give you a clear-eyed view of what ownership actually costs so you can make smarter decisions on the next purchase, the right timing to sell, and which vehicles are quietly destroying wealth versus which ones hold their ground. Start with a complete owner's introduction to vehicle depreciation if you want the full foundation before we dig in.

Depreciation vs. Out-of-Pocket: How They Actually Compare
Let's put both sides of the ledger on the table. Understanding the structure of each cost type is what allows you to actually do something about them.
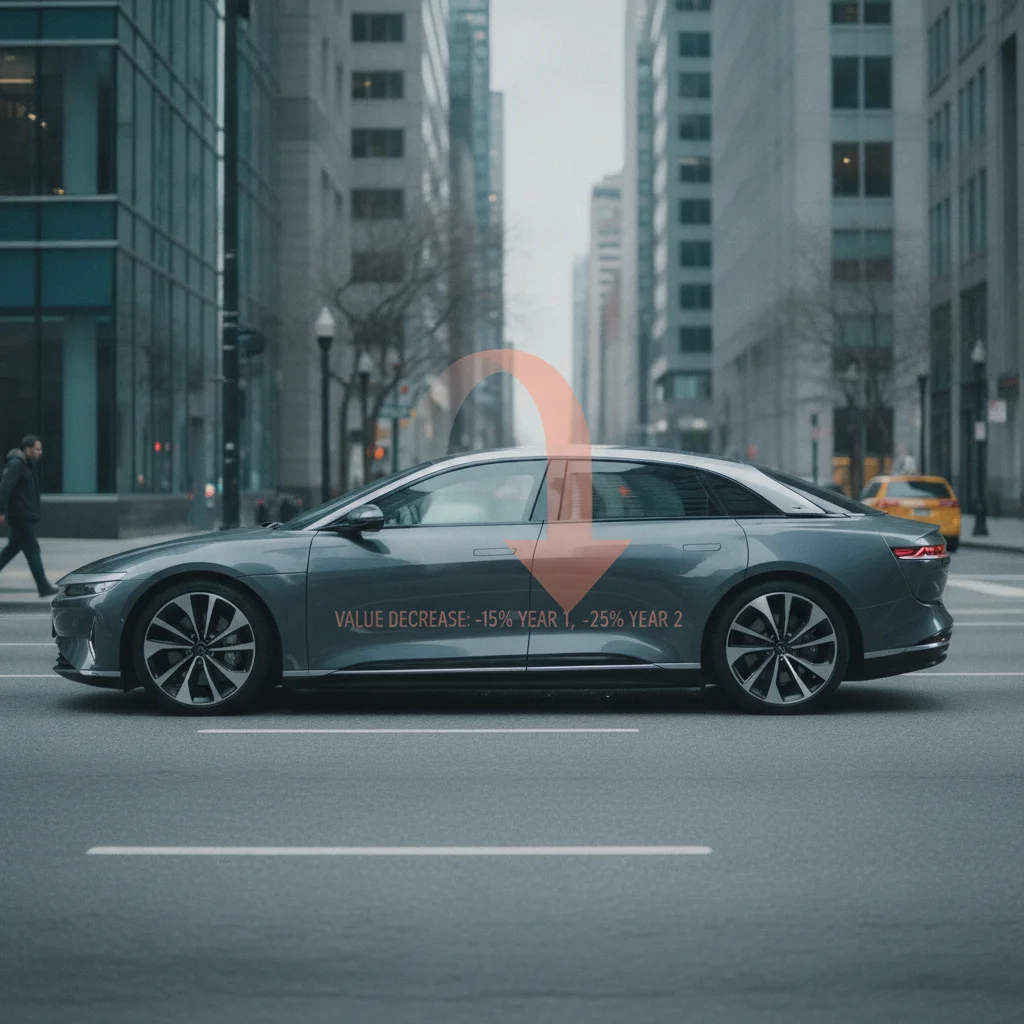
Depreciation is the difference between what you paid for a vehicle and what it's worth when you sell or trade it in. It's a paper loss until the moment you try to exit the asset — then it becomes very real. The average new car loses about 20% of its value in the first year. By the end of year five, most vehicles have shed 40–60% of their original purchase price. That's not a small number on a $40,000 car.
Out-of-pocket costs are everything you physically pay for: fuel, insurance premiums, registration and taxes, scheduled maintenance (oil changes, filters, brakes, tires), and unscheduled repairs. These vary widely based on vehicle type, driving habits, and where you live — but they're largely predictable once you know the vehicle.
| Criterion | Depreciation | Out-of-Pocket Costs |
|---|---|---|
| Visibility | Invisible — no bill generated | Fully visible on statements |
| Typical 5-Year Share of Total Cost | 40–50% of total ownership cost | 50–60% combined (fuel, insurance, maintenance) |
| When It's Felt | At point of sale or trade-in | Monthly and annually |
| Owner Control | Mostly set by vehicle choice | Highly adjustable through behavior |
| Steepest Phase | Years 1–3 of ownership | Rises in older, higher-mileage vehicles |
| Affected by Mileage | Yes — high mileage accelerates loss | Yes — more miles means more fuel and wear |
| Affected by Vehicle Choice | Heavily — varies by make and model | Moderately — fuel economy and reliability vary |
| Can Be Reduced by Buying Used | Yes — significantly reduced | Mixed — maintenance often increases |
The key insight in that comparison is scale. On a mid-range new vehicle driven for five years and 75,000 miles, depreciation alone routinely runs $3,000–$5,000 per year. Fuel might run $1,500–$2,500 per year depending on your commute. Insurance averages around $1,500–$2,000 per year nationally. Maintenance on a well-kept vehicle might run $600–$1,200 per year in the early years, rising in years four and five.
Add it up and depreciation is consistently the single largest line item — often 40–50% of total ownership cost. It's just invisible, which is why it rarely gets the attention it deserves. For a deeper look at how these numbers integrate into a full financial picture, see how depreciation fits into the total cost of ownership calculation.
20%
Average first-year depreciation on new vehicles
According to Carfax and Edmunds data, most new cars lose roughly 20% of their value within the first 12 months of ownership.
$9,000+
Typical 5-year depreciation savings buying used vs. new
iSeeCars analysis of five-year ownership costs consistently shows used buyers absorbing significantly less depreciation than new car buyers on equivalent models.
49%
Depreciation's share of total ownership cost
AAA's annual 'Your Driving Costs' study regularly finds depreciation accounts for roughly half of total vehicle ownership costs for new car buyers.
60%
Value lost on average vehicle after 5 years
Edmunds True Cost to Own data shows the average new vehicle retains only about 40% of its original value after five years of typical use.
The Depreciation Curve: When It Hurts Most
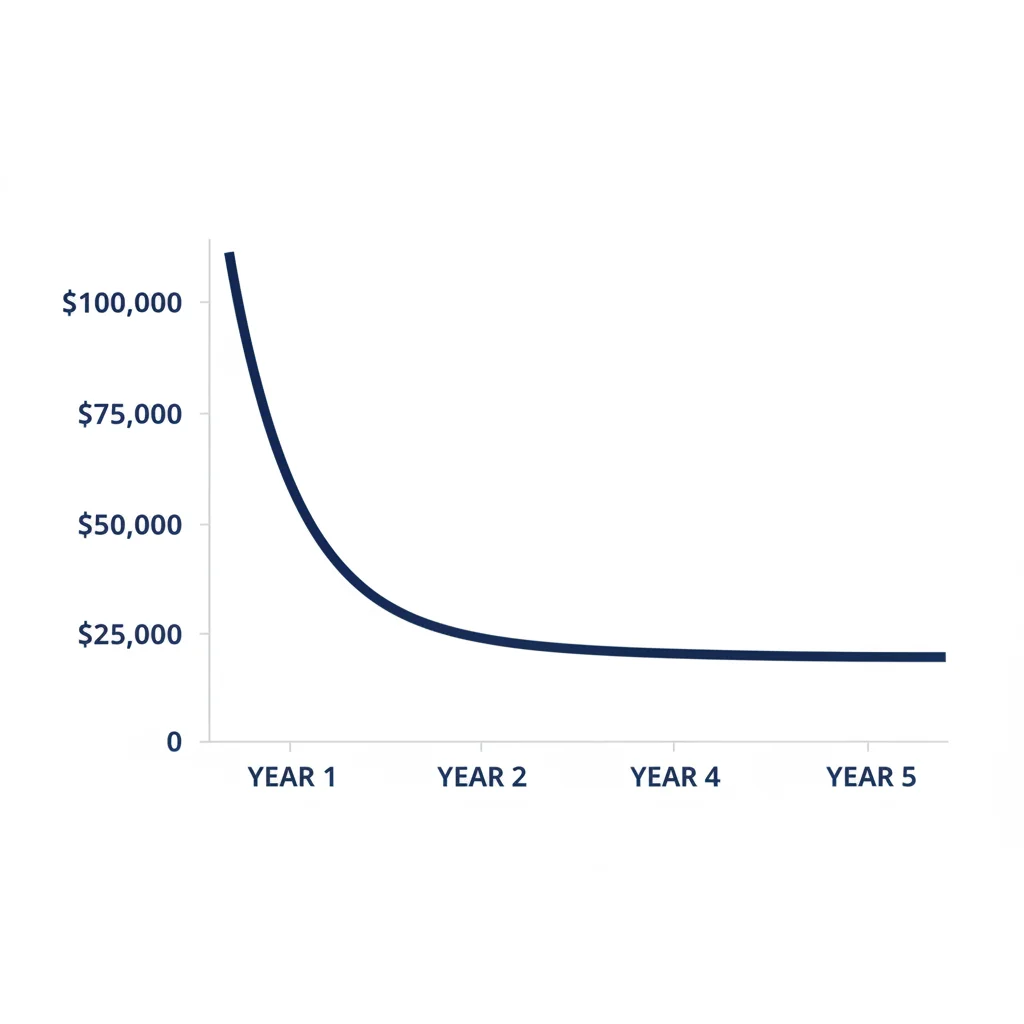
Not all depreciation years are created equal. The curve is steep early and flattens out significantly after year three or four — which has major implications for when you should buy and when you should sell.
Here's the rough shape of a typical new car depreciation curve:
- Year 1: 15–25% value loss from purchase price (the "drive it off the lot" hit is real)
- Year 2: Another 10–15% drop
- Year 3: Another 8–12% drop
- Years 4–5: Slowing to 5–8% per year
- Years 6+: Depreciation flattens considerably; some vehicles stabilize or even appreciate in strong resale markets
This means the person who buys a vehicle new and sells it after three years absorbs the worst depreciation the vehicle will ever experience. The person who buys that same three-year-old vehicle and drives it for another four years gets to ride the flat part of the curve while likely dealing with somewhat higher maintenance costs — but often comes out ahead overall.
The practical takeaway: if you're buying new, plan to own long enough that you spread that early depreciation hit over many years of use. If you're buying used, target vehicles that are two to four years old — you'll skip the worst depreciation but ideally still have most of the reliable service life ahead of you. The real cost of owning a used car breaks down exactly what shifts when you move to the used side of the market.
Depreciation Varies Significantly by Segment
Luxury vehicles, electric vehicles, and certain domestic sedans tend to depreciate faster than the average. Trucks, compact SUVs, and Japanese brand vehicles have historically held value better. Before assuming your vehicle follows the averages, check segment-specific depreciation data on Edmunds or iSeeCars for a more accurate projection. A vehicle that depreciates 10% faster than average can cost you an additional $3,000–$5,000 over five years on a $40,000 purchase.
What You Can — and Can't — Control
Here's where the two cost types diverge sharply in terms of what you as an owner can actually influence.
Out-of-pocket costs are highly controllable. You can shop your insurance annually and switch carriers when rates drift. You can do your own oil changes and basic maintenance to cut labor costs. You can drive more efficiently to stretch fuel economy. You can comparison-shop for tires and brakes. None of this requires a mechanic's certification — it just requires paying attention.
Depreciation is mostly determined before you sign the paperwork. The biggest lever you have on depreciation is vehicle selection. Some vehicles hold value dramatically better than others — Toyota Tacomas, Honda CR-Vs, and certain Jeep Wranglers have historically depreciated far slower than the segment average. Luxury vehicles and certain domestic sedans often depreciate faster. Once you own the vehicle, the depreciation rate is largely baked in by the market.
What you can do after purchase to protect residual value:
- Keep mileage reasonable. High mileage accelerates depreciation faster than almost anything else. Every 10,000 miles above average annual mileage at point of sale typically costs 1–2% of resale value.
- Maintain documented service history. A clean Carfax and a folder of service records are tangible assets at trade-in time. Buyers and dealers both pay more for verifiable history.
- Avoid non-factory modifications. Aftermarket wheels, lifted suspensions, and custom audio typically reduce resale value for general buyers, even if they reflect your personal taste.
- Protect the exterior and interior. Paint condition is a significant factor in appraisal. A detail and a paintless dent repair before selling often returns more than they cost.
For a comprehensive look at the factors that move depreciation rates up or down, the complete owner's reference on vehicle depreciation covers every variable in detail.
Running the Numbers: A Real-World Comparison
Abstract percentages only go so far. Let's build out a concrete five-year ownership scenario for a $38,000 mid-size SUV purchased new, compared to the same model purchased used at three years old for $24,000.
Buying New — Five-Year Total Cost Estimate:
| Cost Category | Annual Average | 5-Year Total |
|---|---|---|
| Depreciation | $3,800 | $19,000 |
| Fuel (15,000 mi/yr, 28 mpg, $3.50/gal) | $1,875 | $9,375 |
| Insurance | $1,800 | $9,000 |
| Maintenance & Repairs | $700 | $3,500 |
| Registration & Taxes | $400 | $2,000 |
| Total | $8,575 | $42,875 |
Buying Used (3 Years Old, $24,000) — Five-Year Total Cost Estimate:
| Cost Category | Annual Average | 5-Year Total |
|---|---|---|
| Depreciation | $1,900 | $9,500 |
| Fuel (same driving) | $1,875 | $9,375 |
| Insurance | $1,600 | $8,000 |
| Maintenance & Repairs | $1,100 | $5,500 |
| Registration & Taxes | $300 | $1,500 |
| Total | $6,775 | $33,875 |
That's roughly a $9,000 difference over five years in favor of the used purchase — and most of that gap is depreciation. The used buyer does pay more in maintenance and slightly more in repairs, but it doesn't come close to closing the spread.
Of course, these numbers shift depending on the specific model, your location, driving patterns, and what deals you negotiate. But the structural relationship holds: depreciation dominates the early-ownership equation, and out-of-pocket costs become more prominent as the vehicle ages. Check registration and tax obligations by state to refine the registration line item for where you live.
If you're weighing whether leasing changes this math in your favor, leasing vs. buying when depreciation is in the equation walks through how leases structure the depreciation exposure differently — though not necessarily more favorably for every driver.
How to Use Both Numbers Together When Making Decisions
The real power comes from treating depreciation and out-of-pocket costs as a single, unified ownership cost number — not two separate conversations. Here's how to apply that in practice.
When buying: Before you commit to a vehicle, look up its projected five-year depreciation using tools like Edmunds True Cost to Own or iSeeCars depreciation data. Add that depreciation figure to your estimated five-year fuel, insurance, maintenance, and registration costs. That total is what owning this vehicle actually costs — not the sticker price, not the monthly payment. The hidden cost nobody mentions when buying a new car puts this in plain terms for first-time buyers.
When comparing two vehicles: A cheaper vehicle with bad depreciation and poor fuel economy can easily cost more over five years than a pricier vehicle that holds its value and sips fuel. Run the full five-year number on every serious candidate before you decide.
When deciding to sell: Plot where you are on the depreciation curve. If you're approaching year three on a new vehicle, you're near the end of the steepest depreciation phase. Selling in years three to four — while mileage is still moderate and the vehicle is still attractive to used buyers — often yields significantly better returns than holding through years five and six when reliability questions start entering buyers' minds and maintenance costs for you are rising simultaneously.
When considering a long hold: If you've already absorbed years one through four, the case for holding gets stronger. You've eaten the worst depreciation, and if the vehicle is reliable, your out-of-pocket costs may still be manageable. The math for keeping a paid-off, well-maintained vehicle through years seven to ten can be very favorable compared to starting the depreciation clock over on something new.

Bottom line: neither depreciation nor out-of-pocket costs tells the full story on its own. The owners who make consistently smart car decisions are the ones who run both numbers, together, every time. For more on how these costs fit into the broader financial picture, depreciation's role in the total cost of ownership is a solid next read.

All claims are backed by peer-reviewed research. Sources on request.