Key Takeaways
Our Verdict
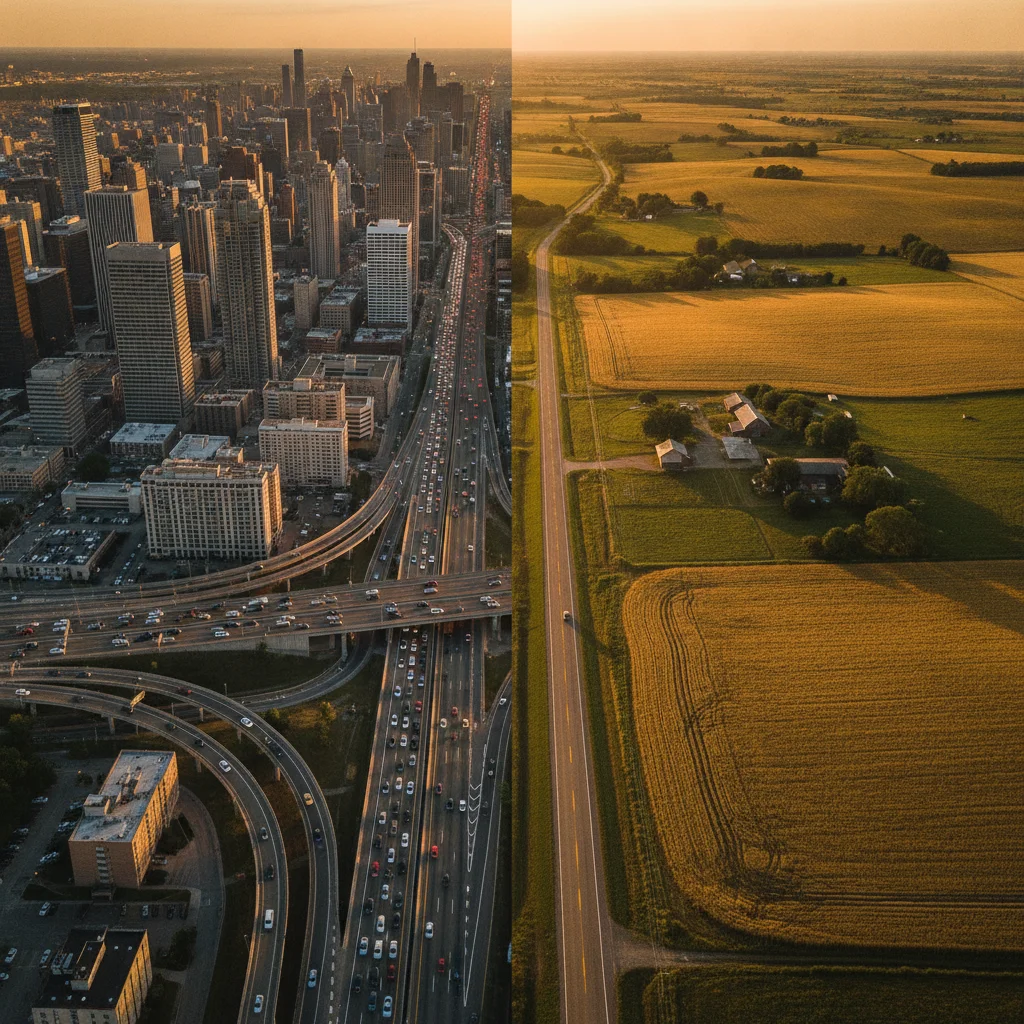
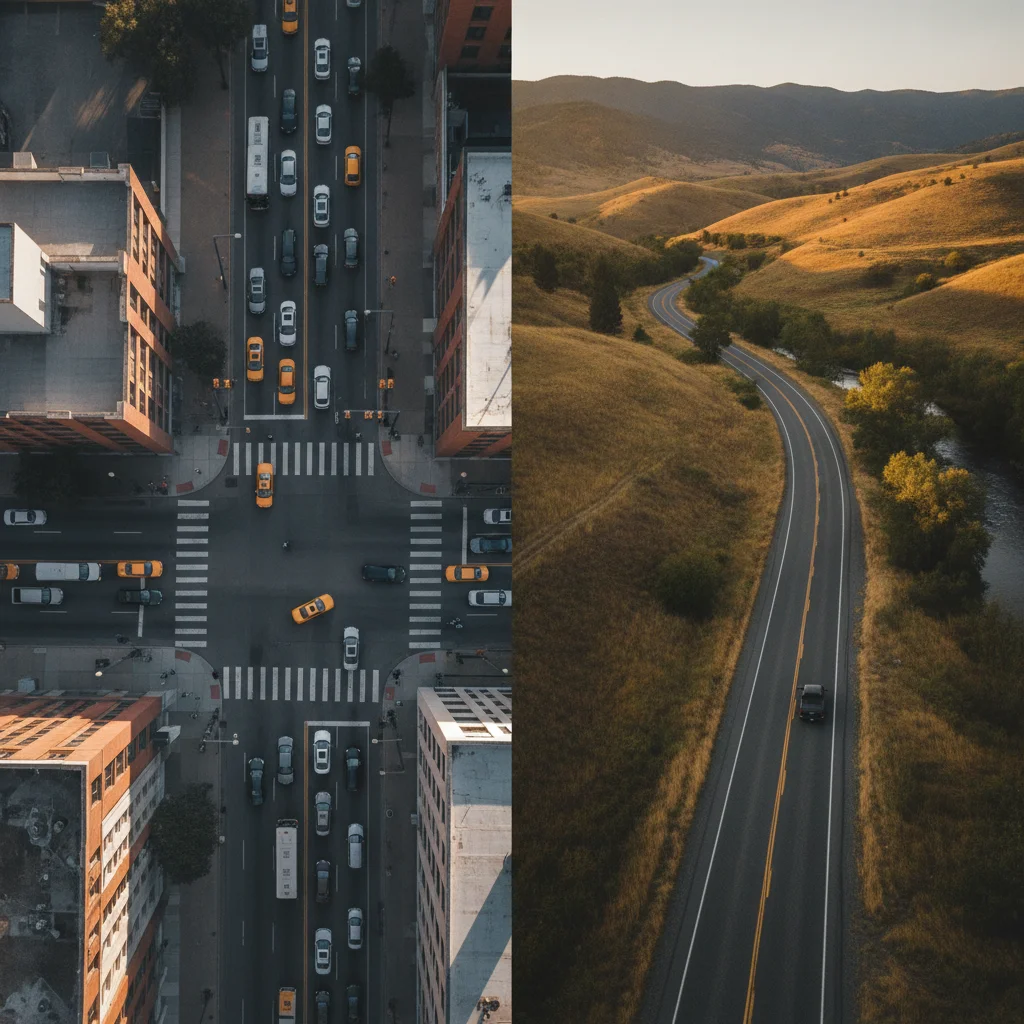
By the most meaningful measure — deaths per mile driven — rural roads are considerably more dangerous than urban ones. Urban environments produce more total crashes, but the individual collision is far less likely to be fatal. Rural roads combine speed, isolation, limited guardrails, and delayed emergency response into a consistently deadlier package. Neither environment is risk-free, and the best safety habits overlap significantly, but drivers venturing onto rural routes should treat that choice with the same seriousness they give highway driving.
| Best for | Recommended |
|---|---|
| Drivers prioritizing crash frequency reduction | Rural roads (fewer total crashes per mile) |
| Drivers prioritizing survival odds if a crash occurs | Urban roads (proximity to trauma care, lower speeds) |
| Drivers seeking predictable, low-complexity conditions | Rural roads (less traffic, fewer intersections) |
| Drivers most concerned about pedestrian and cyclist conflicts | Rural roads (lower pedestrian exposure) |
The Core Paradox: More Crashes in Cities, More Deaths in the Country
Ask most Americans which type of road they find more dangerous, and the instinct points toward cities — gridlocked intersections, aggressive lane changes, cyclists darting through traffic. That intuition isn't entirely wrong, but it misses the more important half of the story.
According to the National Highway Traffic Safety Administration (NHTSA), rural roads account for approximately 46% of all vehicle miles traveled in the United States but consistently generate around 60% of traffic fatalities. That gap — between share of miles driven and share of deaths — is the central fact of American road safety. Urban roads kill people at a lower rate per mile, even though they produce more total crashes in raw numbers.
The explanation isn't complicated once you lay out the variables: speed, road design, seat belt use, alcohol involvement, and how far away a trauma center is when everything goes wrong. Each of those factors tilts decisively against rural drivers. This article walks through what the crash data actually shows, what makes each environment uniquely risky, and how you can adjust your driving habits accordingly regardless of where you spend most of your time behind the wheel.
What the Crash Data Actually Shows
NHTSA's Fatality Analysis Reporting System (FARS) provides the most granular public data on U.S. traffic deaths. A consistent pattern emerges from its annual releases: the rural fatality rate per mile driven runs roughly two to three times higher than the urban rate, depending on the year and road type examined.
~60%
Rural share of U.S. traffic fatalities
Despite accounting for roughly 46% of vehicle miles traveled, rural roads generate nearly 60% of all U.S. traffic deaths, according to NHTSA FARS data.
2–3x
Rural vs. urban fatality rate per mile
NHTSA analysis consistently shows the rural fatality rate per mile driven is two to three times higher than the urban rate across recent reporting years.
18+ min
Average rural EMS response time
The median emergency medical services response time in rural U.S. counties exceeds 18 minutes, compared to under 8 minutes in urban areas, significantly affecting survival outcomes.
80%+
Pedestrian fatalities occurring in urban areas
Over 80% of all U.S. pedestrian traffic deaths occur in urban environments, reflecting the far greater concentration of foot traffic near roadways in cities.
45%
Seat belt fatality risk reduction
NHTSA estimates that seat belts reduce the risk of death in a front-seat crash by approximately 45%, making belt use the single highest-impact safety behavior in any environment.
A 2022 NHTSA analysis found that of the 42,795 people killed in motor vehicle crashes that year, approximately 56% died on rural roads. That's a smaller share than some earlier years — a sign that rural safety is slowly improving — but it still represents a profound overrepresentation given how many fewer miles rural roads carry.
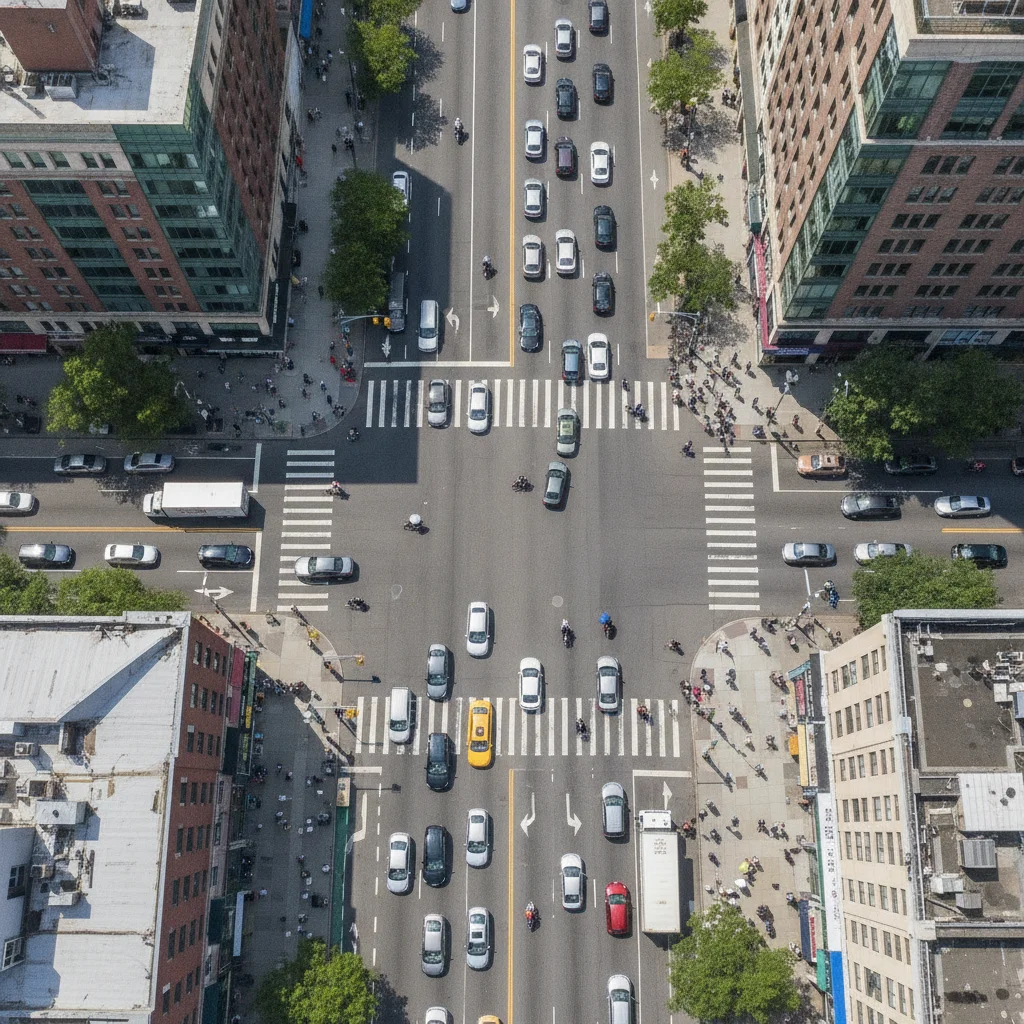
Urban crash statistics look different primarily because of traffic density. More vehicles in a shared space means more minor collisions, more fender-benders, more parking lot incidents. But density also enforces a natural speed cap. A city driver stuck behind a traffic signal or merging into a congested lane rarely has room to accelerate to the speeds where crashes become fatal. A rural driver on an undivided two-lane state highway does.
The distinction between crash frequency and crash severity is not just academic. It directly shapes how insurers price your policy based on your zip code. If you've ever wondered why your premium changed when you moved from a suburb into the city, urban vs. rural insurance rate factors offer a detailed breakdown of how that math works.
Why Rural Roads Are Deadlier: Speed, Isolation, and Road Design
Several compounding factors make rural crashes so much more likely to be fatal.
Speed
The physics of kinetic energy are unforgiving: crash severity increases with the square of speed. A collision at 60 mph releases four times more energy than one at 30 mph. Rural speed limits — often 55 to 70 mph on undivided two-lane roads — mean that when a crash occurs, the forces involved are categorically different from a 25 mph urban fender-bender. Even a single-vehicle run-off-road event, which accounts for a large share of rural fatalities, becomes unsurvivable at highway speed without barriers or forgiving roadsides.
Road Design and Infrastructure
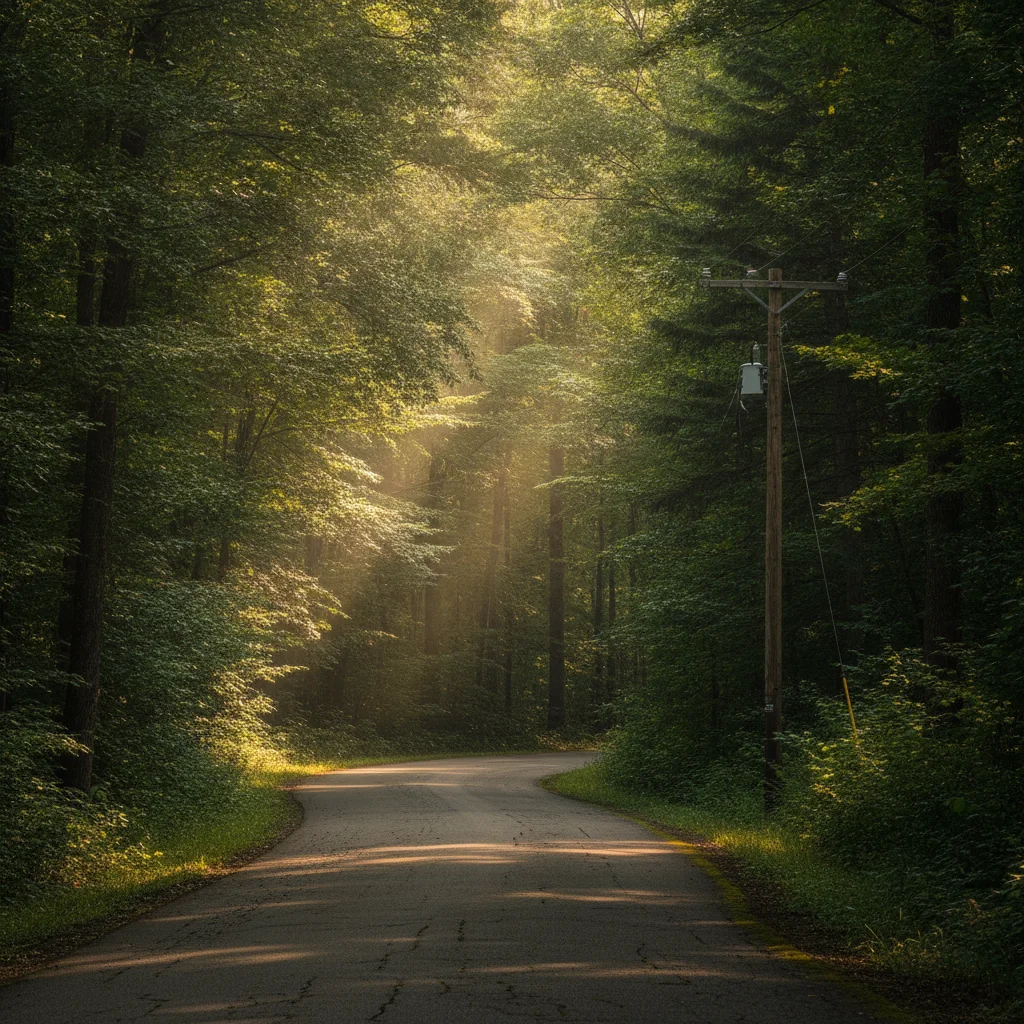
Urban roads receive substantially more maintenance funding per lane mile and are more likely to feature engineered safety elements: concrete medians, dedicated turn lanes, traffic signals with dedicated pedestrian phases, and protected bike lanes. Rural roads often lack center medians, have narrower shoulders, feature unforgiving fixed objects (trees, utility poles, drainage culverts) close to the travel lane, and rely on painted centerlines as the primary separation between opposing traffic.
The Federal Highway Administration estimates that roadway departure crashes — where a vehicle leaves its lane — are the leading crash type in rural fatalities. Without a forgiving roadside or a guardrail to redirect the vehicle, these incidents often turn fatal.
Delayed Emergency Response
Trauma surgeons refer to the "golden hour" — the window in which treatment of severe injuries most dramatically improves survival. In urban areas, that hour is easily within reach. The average EMS response time in urban areas runs under eight minutes. In rural areas, the median exceeds 18 minutes, and in the most remote counties it can exceed 30 minutes. When you've lost significant blood or sustained a traumatic brain injury, that gap in response time is frequently the difference between survival and death.
Seat Belt Use
NHTSA data consistently shows that rural drivers and passengers wear seat belts at lower rates than their urban counterparts — roughly 10 to 15 percentage points lower in some state-level surveys. In crashes where occupant ejection occurs — which is itself more likely at higher speeds — the fatality rate skyrockets. The combination of high speed, roadway departure, and an unbelted occupant is the most common pathway to a rural traffic death.
Alcohol Impairment
Alcohol-involved crashes are disproportionately rural. Part of this is structural: rural areas have fewer ride-share services, less public transportation, and longer distances between bars or gathering places and residential addresses. NHTSA data shows that alcohol impairment is present in a higher share of rural fatalities than urban ones. Distracted driving vs. impaired driving crash data examines how impairment stacks up against other behavioral risk factors across driving environments.
Rural Driving at Night Multiplies Risk Dramatically
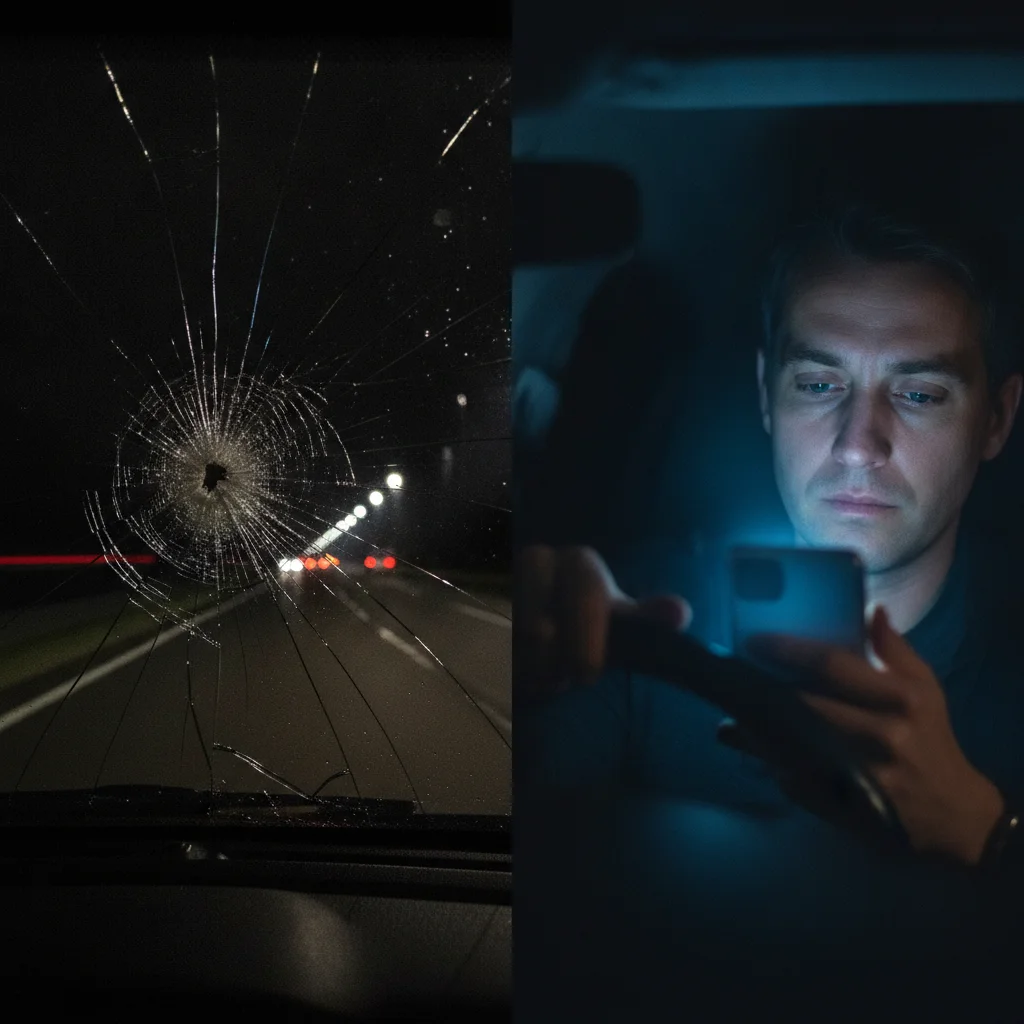
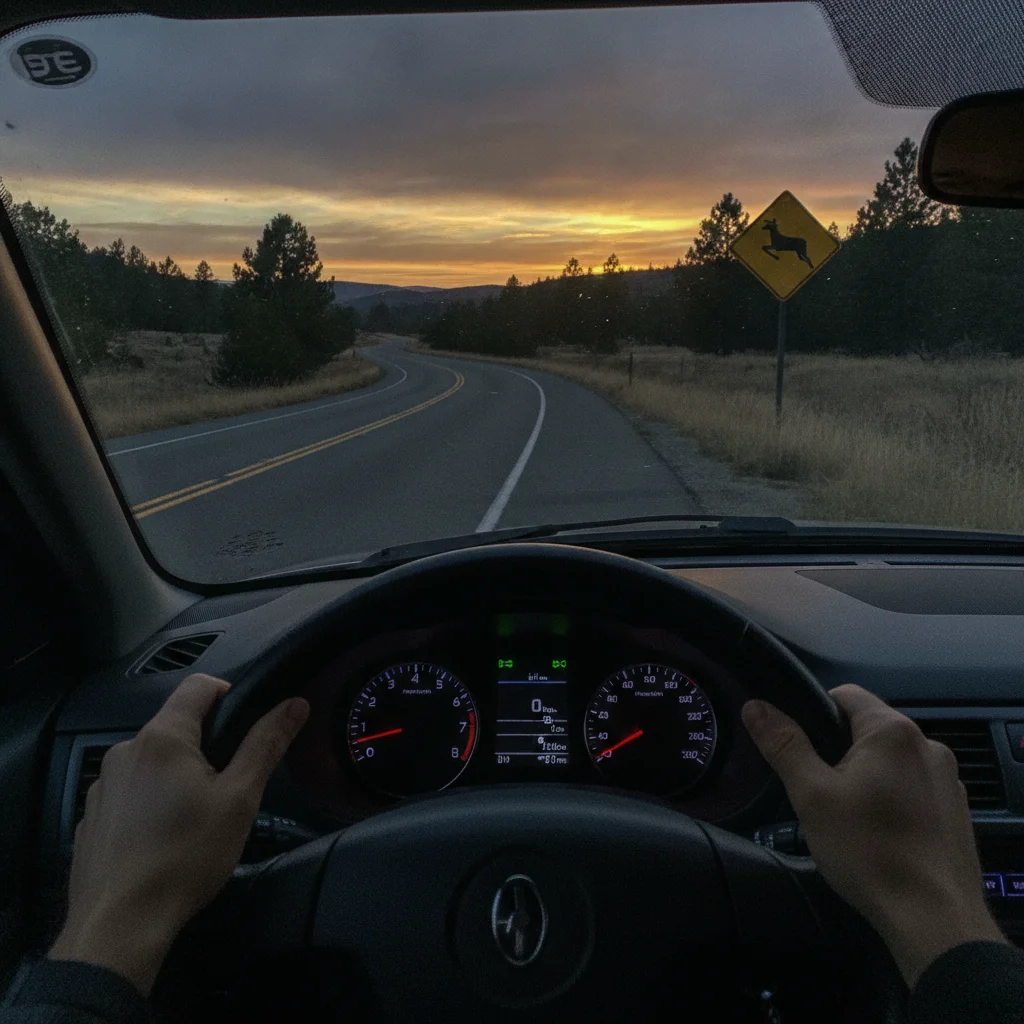
Nighttime driving on rural roads combines three compounding hazards: reduced visibility, higher likelihood of encountering wildlife, and greater probability of crossing paths with an alcohol-impaired driver. NHTSA data shows that a significant share of rural fatalities occur between 9 p.m. and 3 a.m. If your route involves an unfamiliar rural road after dark, reduce speed by at least 10 mph below the posted limit and treat high-beam use as the default rather than the exception when no oncoming traffic is present.
Why Urban Roads Are Dangerous in Their Own Right
The lower fatality rate per mile driven does not make urban roads safe — it makes them differently dangerous. Urban environments generate their own distinct risk profile that drivers should understand and prepare for.
Intersections
The IIHS identifies intersection crashes as one of the leading causes of urban traffic deaths. Red-light running, failure to yield, and complex multi-phase signal timing all contribute. A 2020 IIHS study found that about one in four urban fatal crashes involved an intersection conflict. Roundabouts dramatically reduce fatal intersection crashes — by as much as 90% versus traditional signalized intersections — but U.S. adoption remains inconsistent.
Vulnerable Road Users
Pedestrian and cyclist fatalities are concentrated overwhelmingly in urban environments. NHTSA data shows that urban areas account for over 80% of all pedestrian deaths. The exposure is simply higher: denser populations mean more people on foot near traffic. Crosswalk compliance, turning vehicle conflicts, and distracted walking all contribute. This makes attentive driving — particularly vigilance at crosswalks and driveways — a distinctly urban safety priority. For a deeper look at how behavioral distractions compound these risks, see our coverage of how distracted driving compares to impaired driving.
Congestion-Driven Frustration
Stop-and-go traffic doesn't just burn fuel inefficiently — it generates behavioral risks. Driver frustration, late merging, and aggressive maneuvering are all products of congestion. Road rage research links aggressive driving to thousands of U.S. fatalities annually, with urban environments serving as the primary incubator for these incidents.
Lane Complexity and High-Volume Merges
Multilane urban expressways concentrate significant crash risk at on-ramps, off-ramps, and weave zones where vehicles are simultaneously accelerating and decelerating in close proximity. Research on lane position safety suggests that lane choice matters more than most drivers realize on these high-volume corridors.
| Factor | Urban Roads | Rural Roads | |
|---|---|---|---|
| Fatalities per mile driven | Lower | 2–3x higher | |
| Total crash frequency | Higher (more vehicles) | Lower (less traffic) | |
| Typical crash severity | Lower (lower speeds) | Higher (higher speeds) | |
| Primary crash type | Intersection, pedestrian | Roadway departure, head-on | |
| Average EMS response time | Under 8 minutes | 18+ minutes | |
| Seat belt non-use rate | Lower | 10–15% higher | |
| Alcohol involvement in fatalities | Present but lower share | Disproportionately higher share | |
| Road infrastructure quality | Generally higher (more funding) | Generally lower (limited medians, barriers) | |
| Pedestrian/cyclist exposure | High — 80%+ of pedestrian deaths | Low — rare exposure | |
| Insurance premium (average) | Higher (claim frequency) | Lower (fewer claims) |
Habits That Improve Safety in Both Environments
Despite the differences in risk profile, the behavioral interventions with the strongest evidence base apply universally. Here's what the research actually supports.
Always Wear Your Seat Belt — Regardless of Trip Length
Seat belts reduce the risk of death in a front-seat passenger vehicle crash by approximately 45% and the risk of serious injury by 50%, according to NHTSA. The injury-prevention benefit is as relevant in a low-speed urban crash as in a high-speed rural one. "I'm just running to the store" is the most dangerous reasoning in road safety — a large share of fatal crashes occur within 25 miles of home.
Match Speed to Conditions, Not Just Posted Limits
Posted speed limits represent legal maximums under ideal conditions. On a rural road with curves, dawn lighting, deer activity, and gravel runoff from farm equipment, the appropriate speed may be considerably lower. Urban drivers benefit from the same principle: posted limits on residential streets assume attentive drivers and predictable pedestrian behavior. Neither can be assumed.
Scan Ahead on Rural Two-Lane Roads
On undivided two-lane rural roads, scan 12–15 seconds ahead rather than the 6–8 seconds typically sufficient in urban traffic. This extended visual horizon gives you time to react to deer, agricultural equipment, gravel spillage, or an oncoming vehicle drifting into your lane — all common rural hazards that appear with little warning. Slowing 5–10 mph below the posted limit on blind curves costs minimal time and creates significant response margin.
Urban Crosswalk Protocol That Actually Works
Before proceeding through an urban crosswalk — even with a green signal — make a brief visual sweep left, right, and left again. Pedestrians who step off the curb mid-cycle, cyclists running lights, and vehicles turning across your path can all materialize within the crosswalk zone. This two-second habit costs nothing and catches the conflicts that cause a disproportionate share of urban injury crashes.
Eliminate Phone Use While Moving
The evidence on phone-induced distraction is unambiguous. Cognitive distraction persists for up to 27 seconds after ending a hands-free call, according to the AAA Foundation for Traffic Safety. In that window, an urban driver can miss a red light or pedestrian; a rural driver can drift across the centerline. Both outcomes are serious. Crash data on distracted versus impaired driving makes a compelling case for treating phone use as an impairment-level risk.
Understand Your Specific Road Type
Rural two-lane undivided roads are the most dangerous road type per mile in the U.S. If your commute or road trip involves a significant stretch of this road type — state routes, county roads, farm-to-market roads — build in margin. Add buffer space behind the vehicle ahead, reduce speed on curves beyond what the limit suggests, and treat nighttime driving on these roads with particular caution. Deer strikes, road debris, and oncoming headlights represent risks that are absent or rare on urban streets.
For urban drivers, the equivalent discipline is intersection and crosswalk attentiveness: slow before the intersection even when you have the right of way, make eye contact with pedestrians before proceeding, and treat a yellow signal as a genuine stop prompt rather than an acceleration cue.
Plan Around Work Zones
Work zones combine elements of both environments — often on rural or semi-rural roads, but with the compressed complexity of urban conditions. Construction zone crash data shows these areas kill over 800 Americans annually and demand specific habits around speed reduction and following distance.
How Road Environment Affects Your Insurance and Fuel Costs
The safety data doesn't just affect your physical risk — it flows directly into what you pay for insurance and how much fuel your vehicle consumes.
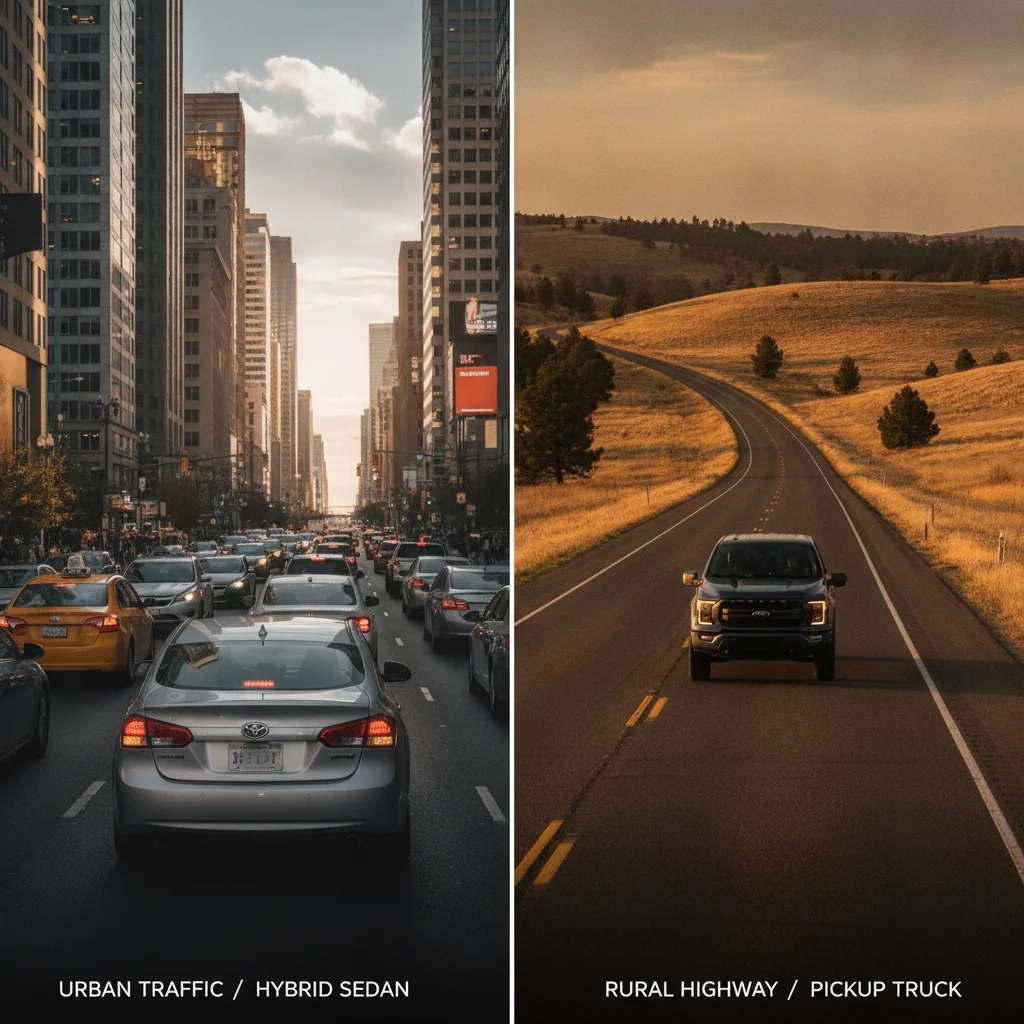
Urban policyholders generally pay higher premiums despite lower per-mile fatality rates because insurers price on claim frequency, not just severity. More fender-benders, more theft exposure, more comprehensive claims from dense parking situations, and higher repair costs in metro areas all push premiums upward. Rural policyholders benefit from lower frequency but face higher severity claims when crashes do occur — and may find claim payouts compressed by lower regional labor rates at body shops.
Fuel efficiency follows a similar environment-driven pattern. The sustained speeds of rural driving favor highway fuel economy ratings, while urban stop-and-go conditions punish conventional internal combustion engines with excessive idling losses and constant braking. City versus highway fuel consumption breaks down exactly where those efficiency losses occur in each setting.
The practical implication: if you're buying a vehicle primarily for rural highway use, optimizing for highway fuel economy ratings makes sense. If your driving is predominantly urban, a hybrid or plug-in hybrid recaptures far more efficiency from regenerative braking than a conventional powertrain does.
The Bottom Line on Where Your Risk Actually Lives
The data makes a clear case: mile for mile, rural roads are the more dangerous environment in America. They're faster, less forgiving, farther from help, and traveled by a population that uses seat belts less and encounters alcohol impairment more. The relative safety of urban roads is real but partial — urban driving generates its own catalogue of serious risks centered on vulnerable road users, complex intersections, and behavioral friction from congestion.
What this means practically is that drivers shouldn't mentally downgrade their vigilance on rural roads simply because traffic is light. Light traffic doesn't equal low risk. The same attentiveness, speed discipline, and belt-wearing habits that prevent urban crashes also prevent the crashes that are most likely to be fatal — which occur, disproportionately, on the open road.
The habits with the clearest evidence base — seat belt use, speed management, and phone elimination — apply with equal force in a Kansas county road and a Chicago arterial. The difference is that on that Kansas county road, the consequences of getting it wrong are statistically more likely to be permanent.

All claims are backed by peer-reviewed research. Sources on request.